 Hui Liang
 Yang Shen
 Junhong Xu
 Xue Shen
- 1Key Laboratory of Geomechanics and Embankment Engineering of Ministry of Education, Hohai University, Nanjing, China
- 2College of Civil Engineering, Nanjing Forestry University, Nanjing, China
Particle morphology is a fundamental inherent property that substantially affects the macroscopic behavior of granular materials. The division and separation of particle morphology at different scale levels contributes to the further multiscale morphology related orthogonal researches. In this context, the high-resolution X-ray micro-computed tomographic (X-CT) scanning and spherical harmonic (SH) analysis were combined to complete the precise and digitized reconstruction of sand particles. The 3D sphericity, roundness and roughness were introduced to define the particle morphology at three scale levels (the general shape, local angularity and surface textures). Two typical sand particles, Calcareous sand (CS) and Fujian sand (FS), were tested in this study. The results showed that the irregularity, angularity and roughness of CS is higher than that of FS, and the multiscale morphological features of the two types of natural sand were given and compared digitally.
Introduction
Particle morphology is an important factor affecting the mechanical properties of granular materials. Recent years have seen increasing research efforts aimed at gaining better approaches to the acquisition of authentic particle morphology [1, 2], and more insights into the relationships between morphological features and macroscopic responses [3, 4]. Shapecharacteristics of ballast aggregates subjected to monotonic and cyclic triaxial tests indicated that particle shape varies with load frequency because of breakage and the ballast aggregates become increasingly regular with the increase of load frequency [5]. As a typical kind of naturally occurring granular materials, sand particles often retain their inherent morphological features derived from the generating environment, geological process, and chemical compositions [6]. The macroscopic engineering properties of natural sands, including compressibility, shear strength, crushability and critical state behavior, were demonstrated to be significantly affected by particle morphology through computational and experimental methods [7–9]. Studies based on discrete element method (DEM) have revealed the micromechanical mechanism of the influence of particle morphology on the macro-mechanical behavior of sand assemblies at the particle scale level, such as interlocking mechanism, energy dissipation mechanism and particle breakage [10]. Moreover, the 3D printing techniques have further provided opportunities for laboratory testing in systematic parametric researches [11]. Therefore, in order to quantitatively analyze the influence of particle morphology on the mechanical properties of sand assemblies, there is a need of accurate reconstruction for the 3D morphology of sand particles, and reasonable quantification for their morphological features.
The study of sand morphology originated from two dimensions and gradually developed to three dimensions. The two-dimensional projection plane of sand morphology is often obtained by means of microscope observation and high-definition photography, and the two-dimensional morphology descriptors of sands, such as sphericity, roundness, convexity and size, were calculated by means of image processing [12]. However, due to the high randomness of the two-dimensional projection plane, the morphological descriptors are not able to accurately represent the authentic three-dimensional morphological features [13]. Comparison of the 3D true sphericity and the corresponding two-dimensional sphericity indicated that the latter would underestimate sphericity [14]. In recent years, the development of X-CT scanning technology provides a powerful tool for the study of three-dimensional morphology of granular matters at a much smaller scale level. CT-based image processing and analysis technology can be used to calculate the volume, surface area and three-dimensional size of sand particles [15]. However, due to the serrations of volume element pixels in the CT images and the excessive stacking of boundary volume elements detected by the boundary search algorithm, the surface morphology reconstructed by image processing are quite different from the real sand surface, which leads to the inaccuracy in calculating the surface area and surface curvature of sand particles. To overcome this problem, SH analysis was developed for convex concrete aggregates by expanding the polar radius from a standard sphere [16]. The SH expansion was also demonstrated to be successfully used in the identification and reconstruction of morphological structure in bioinformatics [17], and topography surveying in geophysics and astronomy [18]. As for the sand particles, modified SH series was introduced to reconstruct the three-dimensional surface morphology of natural sand particles [19]. Based on the mathematical and digital reconstruction of the particle surface, a series of morphological descriptors, such as sphericity, roundness, elongation, aspect ratio, were proposed to further quantify these morphology features [20]. But the current descriptors generally lack a clear scale level division to guide further single scale level morphology related orthogonal experiments.
Calcareous sand (CS) is a special geotechnical medium with marine biological origin and calcium carbonate content of more than 50%, mainly distributed in the continental shelf and coastline of tropical or subtropical areas between latitude 30° north and south. CS particles are porous and irregular in shape, which is due to the fact that most of the CS particles has not been transported long distance during the deposition process and retains the fine pores in the protozoan skeleton [21]. According to the classical soil mechanics, sand does not possess cohesive force, but CS was found to have distinct characteristics from the ordinary terrigenous sands [22]. The interlocking between particles contributes greatly to the shear strength, which is manifested as a high apparent cohesion during the shear process [23]. Moreover, the internal friction angle of CS is much higher than that of other ordinary sands, mostly about 40°, and some even exceed 50° [22]. Recent researches showed that the irregular grain shape is the precondition of CS to produce interlocking, which is also a major factor leading to its high shear strength [24]. For these reasons, it is necessary to introduce a sophisticated method to accurately characterize the 3D particle morphology of CS, and quantify its morphological features for further computational and experimental researches.
Hence, in this paper, the high-resolution X-CT scanning and SH analysis were combined to complete the precise and digitized reconstruction of two typical types of natural sand particles. The three-dimensional morphological information of the sand particles at different scale levels, including general form, local roundness and surface roughness, was extracted and analyzed respectively. A series of descriptors were further proposed accordingly to characterize and quantify these morphological features. The morphological characteristics of the two types of natural sand were given and compared digitally.
Reconstruction of Particle Surface
Two sands of different shapes and similar sizes were used in this study. Fujian sand (FS), also known as China ISO standard sand, is a type of natural sand with a silica content of more than 98% and rounded and smooth particle morphology. The calcareous sand (CS) used in this paper is derived from islands and reefs in the South China Sea. To implement the X-CT scanning of the sand particles, more than 130 CS particles and 100 FS particles with grain size of 1–2 mm were randomly selected from the screening packing.
X-CT Particle Imaging
In order to fasten the particles and ensure the scanning accuracy, transparent epoxy glue, a two-component fast curing transparent epoxy resin adhesive, was used to make the scanning sample. The sample was made layer by layer, and each layer included 30–40 particles. A total of 8 layers of sand particles were placed, including 4 layers of CS and 4 layers of FS. After that, the particles were scanned using an X-ray CT scanner (Phoenix Nanotom s) at the Institute of soil science, Chinese academy of science. A voxel size of 18 µm was achieved.
Then, the section images obtained by X-CT scanning were processed and reconstructed. The main objective of processing the original scanning images was to capture information of the shape irregularity and surface texture of the sand particles, both visually and digitally. Processing of the X-CT scanning images mainly includes four steps: separating the solid phrase (sand particle), reducing noise, obtaining point cloud information of each particle and getting the surface voxel of each particle. The solid phases were distinguished from the void and transparent epoxy glue using thresholding. A filter of size two was used to reduce noise in the raw images. The voxel coordinate information of each particle was obtained through the plugin of ImageJ, Point Cloud [25]. Finally, intrinsic MATLAB function of boundary was used to get the surface voxel of each particle.
SH-Based Analysis and Reconstruction
After obtaining the surface vertices of a given particle from the image processing and reconstruction of X-CT images, SH analysis was used to reconstruct the particle surface. For completeness, the SH theory used in this study is simply introduced in the following.
The basic idea of SH analysis is to expand the polar radius of the particle surface from the unit sphere, and take the associated coefficients dn,m of the SH series as the mathematical representation of the 3D particle morphology, which can be expressed as:
where
where pn,m(x) are the associated Legendre polynomials function given by Eq. 3:
where n and m are the degree and order of pn,m(x), respectively.
Taking the surface vertices with spherical coordinates r(θ, φ) as the input on the left side of Eq. 1, the optimised solution of dn,m can be easily determined by adopting the standard least-squares estimation for the linear equation system. Thus, the complex surface morphology of a three-dimensional particle can be succinctly characterized by a set of dn,m.
In order to reduce distortion and improve computational efficiency, a bijective mapping from the surface profile to a unit sphere with 10,240 vertices and 20,480 faces was used, which has been proved to be sufficient to characterize the multiscale morphology of sand particles, from the general form to the surface texture and roughness [20]. It has been found that the resemblance between the SH reconstruction particle and the actual one has a great positive correlation with SH degree n, and the maximum SH degree nmax was set to 15 in this study. Figure 1 shows the triangular mapping mesh and computational algorithms used in this paper. The line slope between the results of particle volume and surface area by SH analysis and by image analysis is 1.017 and 1.109, respectively, both close to 1, which indicates that SH reconstructed particles can well reproduce the multiscale morphological characteristics of natural particle surface. The higher line slope between the results of surface area is due to the overestimation of the surface area resulting from the highly overlapping boundary voxels in X-CT reconstruction. Directly from the reconstructed image, it can be seen that both X-CT images and SH reconstructed particles show great multiscale morphological differences of the two type of sand particles. As expected, CS generally exhibit a more varied general shape, richer edges and corners, and more complex surface textures than FS. However, it is still a challenge to accurately describe and quantify such morphological differences, especially on a single scale-level. In the next section, a novel method will be proposed to discuss particle morphology features at three scale levels including general form, local angularity and surface roughness. Furthermore, a series of descriptors will be proposed accordingly to characterize and quantify these morphological features.
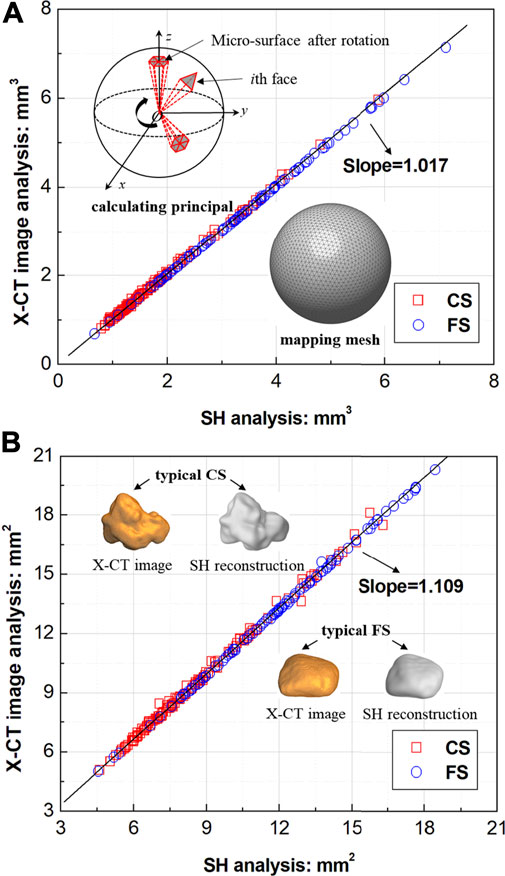
FIGURE 1. Mapping mesh and computational algorithms and results comparison with the SH degree of 15: correlation between the results of (A) particle volume, (B) surface area by SH analysis and by image analysis.
Multiscale Morphological Description and Quantization
Scale Division
Actually, the essence of the SH-based reconstruction of particle surface lies in the accumulation of spherical harmonics in different frequency spaces fn and the spherical harmonic accumulation from a low to a high degree can be understood to represent the morphological features from a large-scale to a small-scale level [26]. It has been found that f0 contains only the information of the particle volume; f1 contains information of a small shift in the particle profile with respect to the position of the original particle center, which has no effect on the reconstruction of particle morphology [27].
Figure 2 shows the SH reconstructions of two types of sand particles in different scopes of frequency spaces. Obviously, there is a strong corresponding representation relationship between spherical harmonics accumulation in different frequency spaces and the particle morphology at different scale levels. Specifically, f2 to f4 represent the general shape of the particle at general form scale level; f5 to f8 represent the local angularity and roundness of the particle at small scale level; and f9 to f15 represent the surface texture and roughness of the particle at a much smaller scale level. This scale division was also used in [28] for Leighton Buzzard sand and highly decomposed granite. The corresponding representation relationship is of great significance to the multiscale morphological study of sand particles: 1) The morphological information at certain scale levels can be easily extracted by definable accumulation of spherical harmonics. 2) The morphological descriptors of certain scale levels are able to be unaffected by the morphological information from other scale levels, which greatly improves the reliability and stability of the morphological descriptors. 3) Independent control variables for particle morphology at certain scale levels are obtained, and the characterization and quantization of particle multiscale morphology is more intuitionistic and laconic.
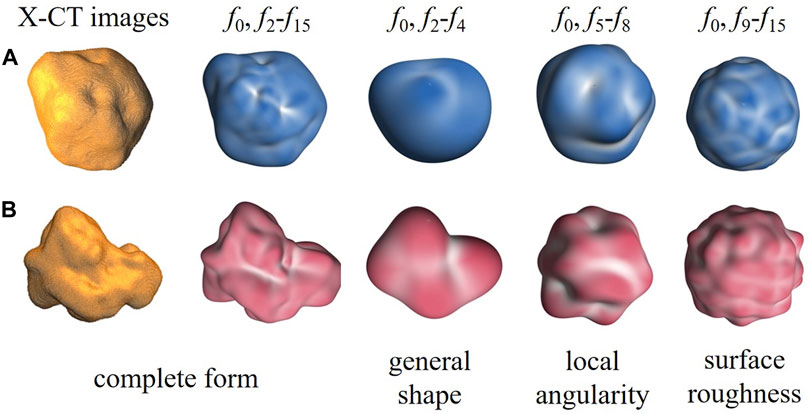
FIGURE 2. SH reconstructions of a typical CS particle and a typical FS particle by accumulating harmonics in different scopes of SH frequency spaces (A) the typical CS particle, (B) the typical FS particle. The columns from left to right are X-CT images, SH reconsturction at f0 and f2-f15, f0 and f2-f4, f0 and f5-f8, f0 and f9-f15, which represent the complete form, general shape, local angularity and surface roughness, respectively.
Multiscale Morphological Descriptors
Three morphological descriptors, sphericity, roundness and roughness, are introduced accordingly to quantify the particle morphology at three scale levels, general form, local roundness and surface texture. These morphological descriptors are calculated based on surface reconstruction in f2-f4, f5-f8, f9-f15, respectively.
Sphericity is a common parameter to characterize the general shape of particles, which is defined by:
where V and S denote the particle volume and surface area, respectively. The algorithm is based on the triangular mesh in Figure 1. The value of sphericity ranges from 0 to 1, and the closer the value is to 1, the closer the general shape of the particle is to spherical.
Roundness is a parameter to characterize the local angularity on the particle surface, in other words, the angularity of the particle surface, which is defined by [29]:
where N is the number of sharp corners on the particle; kins is the curvature of the maximum inscribed sphere of the particle; kmax is the max curvature of each sharp corners on the particle. The sharp corner was identified by
In order to measure the local principal curvatures at a given vertex vc (xc, yc, zc) on the SH-reconstructed surface, a Taylor Series was introduced to approximate the micro-surface consisting of a central point and six vertices, which is also used in [30], as expressed by:
where a1, a2, a3, a4, a5 and a6 are the unknown coefficients that need to be determined.
For reasons of avoiding the fitting error of the micro-surface caused by the difference of its position in Cartesian coordinate system, a rotation of the micro-surface was performed before each calculation of the curvature.
where vms is the component vertices of the ith micro-surface; vms′ is the component vertices of the ith micro-surface after rotation;
Taking vms′ as the input of Eq. 6, a fitting surface function can be obtained. The maximum curvature at a given vertex kmax was used to characterize the local roundness of the micro-surface. Consequently, the roundness of the particle can be obtained by Eq. 5.
According to [31], the roughness of a fracture surface is defined as follows:
where Sfs is the true fracture surface area and Ap is the apparent projected area on a plane parallel to the mean or average topographic plane of the fracture surface.
Similarly, for spherical particles in three dimensions, the quantitative descriptor of surface roughness can be defined by:
where S is the particle surface area under f9-15 accumulation and SE is the surface area of a sphere of the same volume.
Results and Discussion
According to the reconstruction methods in the previous section ‘Reconstruction of particle surface’, it is proved that SH reconstructed particles can well reproduce the multiscale morphological characteristics of the surface of the two typical natural sand particles, CS particles and FS particles, with the SH degree of 15. Then, the 3D sphericity, roundness and roughness of real CS and FS can be obtained by the methods proposed in ‘Multiscale morphological description and quantization’. Figure 3 shows the cumulative distribution functions of sphericity, roundness and roughness of the CS particles and FS particles. As expected, CS tends to have lower values of sphericity and roundness than the FS particles, which again prove that the particle morphology of CS is more irregular and angular than that of FS. With regard to roughness, the value of CS is higher than those of the FS particles. This indicates that the surface textures of the CS particles are rougher and more complex than those of FS. Numerically speaking, the mean value of sphericity of CS (0.892) is 3% higher than that of FS (0.921), and the mean value of roundness of CS (0.625) is 14% higher than that of FS (0.728), the mean value of roughness of CS (1.081) is 6% lower than that of FS (1.021).
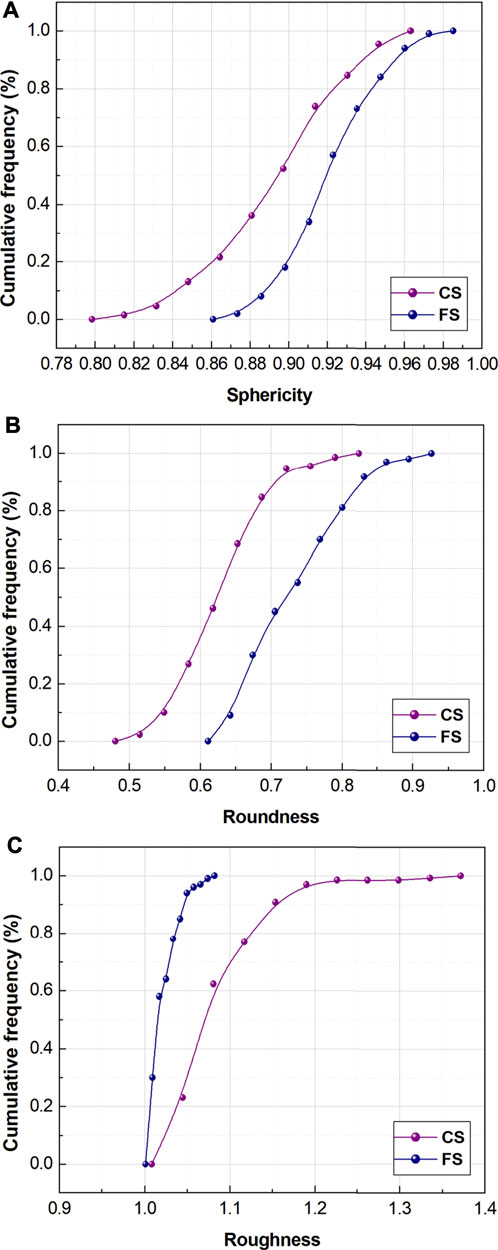
FIGURE 3. Cumulative distribution functions of sphericity, roundness and roughness of the CS particles and FS particles (A) sphericity under f2-f4; (B) roundness under f5-f8; (C) roughness under f9-f15.
Figure 4 further displays the correlation between the multiscale morphological descriptors. Obviously, there is a fairly strong correlation between the descriptors in each subfigure, indicating that the morphological features of natural sand particles at different scale levels are not independent from each other. Specifically, the correlation coefficients between sphericity and roundness, sphericity and roughness, and roundness and roughness are 0.736, 0.688, 0.786, respectively. This result agrees well with the results of [20], who found a strong correlation between the sphericity and the roundness and fractal dimension of sand particles. Moreover, it is believed that most environmental data displays the fractal property of statistical self-similarity through at least a limited range of scales [32]. The strong correlation between morphological features and different scale levels potentially results from the natural self-similarity of sand particles, which only depends on the natural properties of the sand particles, including particle composition, sedimentary environment, transport path, etc. Therefore, although the particle morphology at a single scale level can be easily isolated, there is still a notable correlation between the morphological features of natural sand particles at different scales.
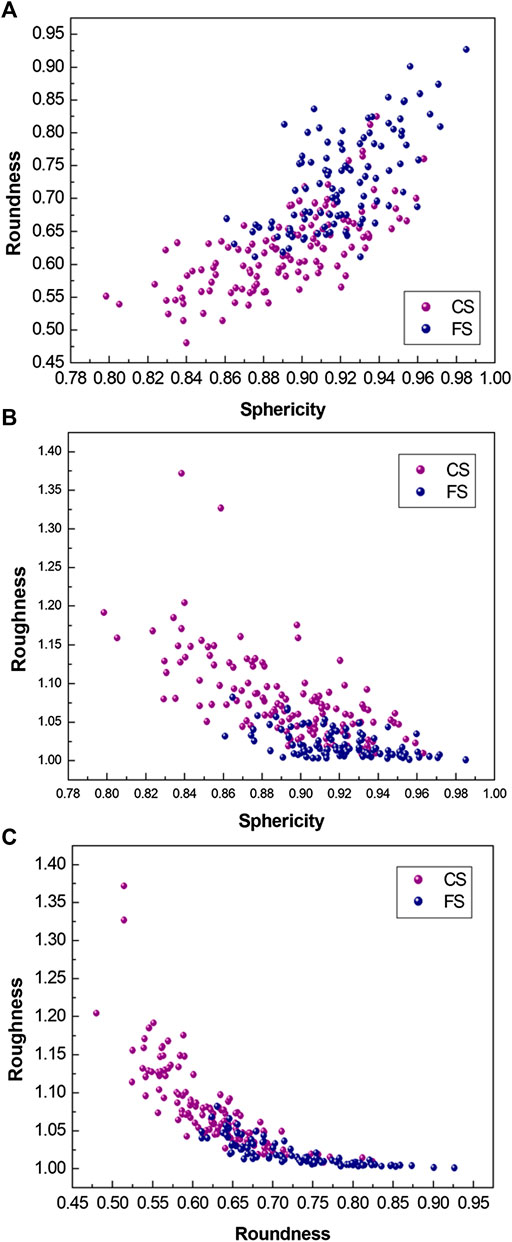
FIGURE 4. Correlation between the multiscale morphological descriptors (A) sphericity plotted against roundness, (B) sphericity plotted against roughness, (C) roundness plotted against roughness.
Conclusion and Future Work
This study successfully combined X-CT scanning and SH analysis to complete a precise and digitized reconstruction of two morphologically different natural sand particles: CS particles and FS particles. It is proved that a maximum spherical degree of 15 is sufficient for the reconstruction of the multiscale morphology of CS and FS. The particle morphology was divided and separated at three scale levels, and 3D sphericity, roundness, and roughness were introduced to define the general form, local angularity and roundness, and surface texture and roughness.
Based on the algorithms of the morphological descriptors proposed above, the multiscale morphological features of CS and FS were rigorously defined and quantified. The mean value of sphericity and roundness of CS are 0.892 and 0.625, which are 3 and 14% lower than that of FS (0.921 and 0.728), respectively. With regard to roughness, the mean value of CS (1.081) is 6% higher than that of FS (1.021). The results indicates that the particle morphology of CS is more irregular and angular than that of FS, and the surface textures of the CS are rougher and more complex than those of FS. Moreover, the morphological difference between CS and FS mainly exists in the smaller scale levels, namely, the roundness and roughness scale levels. The higher standard deviation indicates that CS is more diverse and random in particle morphology. The correlation coefficients between the morphological descriptors at different scale levels are greater than 0.6, indicating that the morphological features of natural sand particles at different scale levels are not independent from each other. This potentially results from the natural self-similarity of sand particles, in other words, the fractal features.
Based on this work, the present authors’ future research will focus on experimental and numerical studies of the effect of these multiscale morphological descriptors on the micro- and macro-mechanical behavior of granular sands. In particular, the influence of particle morphology at different scale levels on the mechanical response of particle assembly will be as a significant problem in the future’s research, aiming at establishing better relationships between the multiscale particle morphology of these geomaterials and their mechanical, hydrological and rheological performance.
Data Availability Statement
The original contributions presented in the study are included in the article/Supplementary Material, further inquiries can be directed to the corresponding author.
Author Contributions
HL wrote the manuscript. All authors discussed about the contents.
Funding
This study was supported by Research Grants (No. 51979087) from the National Natural Science Foundation of China.
Conflict of Interest
The authors declare that the research was conducted in the absence of any commercial or financial relationships that could be construed as a potential conflict of interest.
Publisher’s Note
All claims expressed in this article are solely those of the authors and do not necessarily represent those of their affiliated organizations, or those of the publisher, the editors and the reviewers. Any product that may be evaluated in this article, or claim that may be made by its manufacturer, is not guaranteed or endorsed by the publisher.
References
1. Meng Q, Wang H, Xu W, Zhang Q. A Coupling Method Incorporating Digital Image Processing and Discrete Element Method for Modeling of Geomaterials. Ec (2018) 35(1):411–31. doi:10.1108/ec-11-2016-0390
2. Altuhafi F, O'Sullivan C, Cavarretta I. Analysis of an Image-Based Method to Quantify the Size and Shape of Sand Particles. J Geotechnical Geoenvironmental Eng (2012) 139(8):1290–307. doi:10.1061/(asce)gt.1943-5606.0000855
3. Zhang Y, Liu Z, Shi C, Shao J. Three-dimensional Reconstruction of Block Shape Irregularity and its Effects on Block Impacts Using an Energy-Based Approach. Rock Mech Rock Eng (2018) 51:1173–1191. doi:10.1007/s00603-017-1385-x
4. Meng QX, Wang HL, Xu WY, Cai M. A Numerical Homogenization Study of the Elastic Property of a Soil-Rock Mixture Using Random Mesostructure Generation. Comput Geotechnics (2018) 98:48–57. doi:10.1016/j.compgeo.2018.01.015
5. Sun Y, Zheng C. Breakage and Shape Analysis of Ballast Aggregates with Different Size Distributions. Particuology (2017) 35:84–92. doi:10.1016/j.partic.2017.02.004
6. Alshibli KA, Druckrey AM, Al-Raoush RI, Weiskittel T, Lavrik NV. Quantifying Morphology of Sands Using 3D Imaging. J Mater Civil Eng (2014) 27(10):04014275. doi:10.1061/(ASCE)MT.1943-5533.0001246
7. Cho G-C, Dodds J, Santamarina JC. Particle Shape Effects on Packing Density, Stiffness, and Strength: Natural and Crushed Sands. J Geotech Geoenviron Eng (2006) 132(5):591–602. doi:10.1061/(asce)1090-0241(2006)132:5(591)
8. AltuhafiFatin NG, Vasiliki NC, RM. Effect of Particle Shape on the Mechanical Behavior of Natural Sands. J geotechnical geoenvironmental Eng (2016) 142(12):04016071. doi:10.1061/(asce)gt.1943-5606.0001569
9. Tovar R, Galvis A, Salgado R, Prezzi M. Effect of Surface Roughness on the Shaft Resistance of Displacement Model Piles in Sand. J geotechnical geoenvironmental Eng (2018). doi:10.1061/(asce)gt.1943-5606.0001828
10. Jiang M, Leroueil S, Zhu H, Yu H-S, Konrad J-M. Two-Dimensional Discrete Element Theory for Rough Particles. Int J Geomech (2009) 9(1):20–33. doi:10.1061/(asce)1532-3641(2009)9:1(20)
12. Zheng J, Hryciw RD. Traditional Soil Particle Sphericity, Roundness and Surface Roughness by Computational Geometry. Géotechnique (2015) 65(6):494–506. doi:10.1680/geot.14.p.192
13. Meng Q, Wang H, Cai M, Xu W, Zhuang X, Rabczuk T. Three-dimensional Mesoscale Computational Modeling of Soil-Rock Mixtures with Concave Particles. Eng Geology (2020) 277:105802. doi:10.1016/j.enggeo.2020.105802
14. Sun Y, Indraratna B, Nimbalkar S. Three-dimensional Characterisation of Particle Size and Shape for Ballast. Géotechnique Lett (2014) 4(3):197–202. doi:10.1680/geolett.14.00036
15. Yu L, Gong F, You Z, Wang H. Aggregate Morphological Characterization with 3D Optical Scanner versus X-Ray Computed Tomography. J Mater Civil Eng (2018) 30(1):04017248. doi:10.1061/(asce)mt.1943-5533.0002091
16. Garboczi JE. Three-dimensional Mathematical Analysis of Particle Shape Using X-ray Tomography and Spherical Harmonics: Application to Aggregates Used in concrete. Cement Concrete Res (2002) 32(10):1621–38. doi:10.1016/s0008-8846(02)00836-0
17. Shen L, Makedon F. Spherical Mapping for Processing of 3D Closed Surfaces. Image Vis Comput (2006) 24(7):743–61. doi:10.1016/j.imavis.2006.01.011
18. Bucha B, Janák J. A MATLAB-Based Graphical User Interface Program for Computing Functionals of the Geopotential up to Ultra-high Degrees and Orders. Comput Geosciences (2013) 56:186–96. doi:10.1016/j.cageo.2013.03.012
19. Bo Z, Wang J, Zhao B. Micromorphology Characterization and Reconstruction of Sand Particles Using Micro X-ray Tomography and Spherical Harmonics. Eng Geology (2015) 184(14):126–37. doi:10.1016/j.enggeo.2014.11.009
20. Zhou B, Wang J, Wang H. Three-dimensional Sphericity, Roundness and Fractal Dimension of Sand Particles. Géotechnique (2017) 68(1):1–13. doi:10.1680/jgeot.16.p.207
21. Skaropoulou A, Tsivilis S, Kakali G, Sharp JH, Swamy RN. Long Term Behavior of Portland limestone Cement Mortars Exposed to Magnesium Sulfate Attack. Cement and Concrete Composites (2009) 31(9):628–36. doi:10.1016/j.cemconcomp.2009.06.003
22. Wang XZ, Jiao YY, Wang R, Hu MJ, Meng QS, Tan FY. Engineering Characteristics of the Calcareous Sand in Nansha Islands, South China Sea. Eng Geology (2011) 120(1-4):40–7. doi:10.1016/j.enggeo.2011.03.011
23. Wang XZ, Weng YL, Wang X, Chen WJ. Interlocking Mechanism of Calcareous Soil. Yantu Lixue/Rock Soil Mech (2018) 39(9):3113–21. doi:10.16285/j.rsm.2017.2426
24. Wei H, Zhao T, Meng Q, Wang X, Zhang B. Quantifying the Morphology of Calcareous Sands by Dynamic Image Analysis. Int J Geomech (2020) 20(4):04020020. doi:10.1061/(asce)gm.1943-5622.0001640
25. Hossain A, Khan P, Meng Q, Lu CC, Clements RJ. Distributed ImageJ(Fiji): A Framework for Parallel Image Processing. IET Image Processing (2020) 14(12):2937–2947. doi:10.1049/iet-ipr.2019.0150
26. Burel G, Hénocq H. Three-dimensional Invariants and Their Application to Object Recognition. Signal Processing (1995) 45(1):1–22. doi:10.1016/0165-1684(95)00039-G
27. Mollon G, Zhao J. Generating Realistic 3D Sand Particles Using Fourier Descriptors. Granular Matter (2013) 15(1):95–108. doi:10.1007/s10035-012-0380-x
28. Wei D, Wang J, Nie J, Zhou B. Generation of Realistic Sand Particles with Fractal Nature Using an Improved Spherical Harmonic Analysis. Comput Geotechnics (2018) 104:1–12. doi:10.1016/j.compgeo.2018.08.002
29. Zhao B, Wang J. 3D Quantitative Shape Analysis on Form, Roundness, and Compactness with μCT. Powder Tech (2016) 291:262–75. doi:10.1016/j.powtec.2015.12.029
30. Colombo A, Cusano C, Schettini R. 3D Face Detection Using Curvature Analysis. Pattern Recognition (2006) 39(3):444–55. doi:10.1016/j.patcog.2005.09.009
Keywords: particle morphology, multiscale, calcareous sand, spherical harmonic, morphological description
Citation: Liang H, Shen Y, Xu J and Shen X (2021) Multiscale Three-Dimensional Morphological Characterization of Calcareous Sand Particles Using Spherical Harmonic Analysis. Front. Phys. 9:744319. doi: 10.3389/fphy.2021.744319
Received: 20 July 2021; Accepted: 17 August 2021;
Published: 03 September 2021.
Edited by:
Wanqing Shen, Université de Lille, FranceCopyright © 2021 Liang, Shen, Xu and Shen. This is an open-access article distributed under the terms of the Creative Commons Attribution License (CC BY). The use, distribution or reproduction in other forums is permitted, provided the original author(s) and the copyright owner(s) are credited and that the original publication in this journal is cited, in accordance with accepted academic practice. No use, distribution or reproduction is permitted which does not comply with these terms.
*Correspondence: Yang Shen, c2hlbnlhbmcxOTk4QDE2My5jb20=