 Zhihao Chen
 Jingjing Wei4
 Tiecheng Cai
- 1School of Computer and Data Science, Fuzhou University, Fuzhou, China
- 2Fujian Provincial Key Laboratory of Networking Computing and Intelligent Information Processing, Fuzhou University, Fuzhou, China
- 3Digital Fujian Institute of Financial Big Data, Fuzhou University, Fuzhou, China
- 4College of Electronics and Information Science, Fujian Jiangxia University, Fuzhou, China
- 5Peng Cheng Laboratory, Shenzhen, China
The cascades prediction aims to predict the possible information diffusion path in the future based on cascades of the social network. Recently, the existing researches based on deep learning have achieved remarkable results, which indicates the great potential to support cascade prediction task. However, most prior arts only considered either cascade features or user relationship network to predict cascade, which leads to the performance limitation because of the lack of unified modeling for the potential relationship between them. To that end, in this paper, we propose a recurrent neural network model with graph attention mechanism, which constructs a seq2seq framework to learn the spatial-temporal cascade features. Specifically, for user spatial feature, we learn potential relationship among users based on social network through graph attention network. Then, for temporal feature, a recurrent neural network is built to learn their structural context in several different time intervals based on timestamp with a time-decay attention. Finally, we predict the next user with the latest cascade representation which obtained by above method. Experimental results on two real-world datasets show that our model achieves better performance than the baselines on the both evaluation metrics of HITS and mean average precision.
1 Introduction
Social media online platforms, such as Twitter, Sina Weibo, WeChat, and so on, have greatly promoted the rapid spread of information on the Internet, which leads to an increasingly important impact on daily life of people. Cascade [1] consists of a series of users’ behaviors on the social network like share, comment, like and so on, which is regarded as a temporal sequence as shown in Figure 1. Who participated in the diffusion we call them infected users. Cascade is usually considered as the basis of information diffusion on social networks. Modeling and predicting cascades is conducive to understanding and quantifying user influence on social network. Cascade prediction aims to predict the process of information diffusion in the future based on observed cascades, which is of great significance to decision-making on social networks such as viral marketing [2] and support for Internet of Things [3].
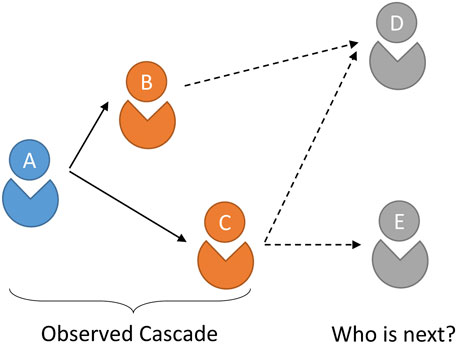
FIGURE 1. A toy example of cascade prediction, which contains several users who participated in information diffusion. A → B → C is a observed cascade in social network, we will predict who is the next infected user, D or E?
Traditionally, the existing works on cascade prediction mainly learn the cascade feature from the diffusion path or user relationship graph, which can be summarized into the following two categories: 1) Analysis methods based on traditional topological structure and characteristics. In the early stage, these methods were usually based on the network topology [4] and the network propagation mechanism [5, 6, 7] to model the cascading diffusion process; In order to further improve the predictive performance of the model, a series of feature-driven methods [8] such as learning user influence and susceptibility [9] have been proposed. 2) Method based on deep learning. With the successful application of end-to-end learning models such as DeepCas [10], various neural network models applied to cascade prediction have further improves the model performance. It has gradually become the main method on cascade diffusion prediction task. In recent works, Topo-LSTM [11] and DeepInf [12] modeled the network topology and predicted propagation through user-level representation learning. On the other hand, some researchers tried to use neural networks to learn the temporal feature in the cascade, and thus DeepHawkes [13], RNN-based CRPP method [14] and some other models were proposed.
However, traditional methods based on propagation mechanism [5] and features [9] often rely on manual definition through a large number of studies and observations. What’s more, the complex manual features [8] often limit the generalization and robustness. As for deep learning methods, existing works either study from the relationship of users from network topology [11] or cascade temporal feature [13] unilaterally. While in realistic social network, information diffusion is affected by spatial and temporal feature together. It is of great significance to study the potential relationship between the two aspects in information diffusion.
To solve this problems, in this paper, we propose an end-to-end neural network framework DLIC (Deep Leaning Information Cascades) that combines social network topology and temporal cascade information. The framework first learns the feature representations of each user through a graph attention based on the topological of social network. And then a recurrent neural network is built for learning cascade representation in different time intervals, and a time-decay attention mechanism is introduced for assigning different weights to them. The final user representation which learns previous cascade feature would be fed into decoder layer to predict the next infected user.
Extensive experiments on two public cascade diffusion datasets, namely Twitter [15] and Douban [16], validate the performance of our model compared with several baseline methods. The results indicate the improvements on HITS@100 by 2.2 and 2% on the twitter and douban datasets, respectively. Besides, our model performs best in all other metrics on both real datasets.
The paper is organized as follows: Section 2 introduce the relative works in cascade prediction task, while Section 3 describes our DLIC model. Section 4 shows our experimental results and discusses the effect of different features. Finally, Section 5 gives a conclusion of our main findings and future works.
2 Background
The goal of cascade prediction is to model the diffusion regularity in social network, which aims to effectively describe the propagation mechanism of information and predict the future diffusion path. The research on cascade prediction can be divided into tow categories, namely the methods based on traditional machine learning or deep learning techniques.
In terms of cascade feature learning, the most of works based on traditional machine learning have proposed many methods to learn the diffusion probability among different users from the observed cascade information. [8] modeled cascade information through a marked Hawkes self-exciting point process and predicted with content virality, memory decay and user influence. [17] learned the embedded feature representations of users on social networks in a latent space through independent cascade model. [18] proposed IEDP model based on information-dependent embedding, which mapped users to a latent embedding space in observed time sequence of the cascade diffusion process, and the prediction is made according to the distance of embedding representation. [19] proposed an opinion leader mining model EIC based on the extended independent cascade model, which integrated network structure characteristics, individual attributes and behavior characteristics together. [20] designed a route decision model by a data-driven method. [21] constructed interaction rules based on multi-dimensional features such as user influence, sentiment and age to simulate the process of information diffusion in social networks. [22] used the survival analysis model to learn the susceptibility and influence of users, which were used to calculate the diffusion probability among users. [23] proposed a feature extraction method from user behavior under urban big data. [24] argued that the spread of rumors is composed of multiple factors and proposed a multi-featured spread model. [25] computed the epidemic risk of COVID-19 by combining the number of infected persons and the way they pass through the station.
In recent years, with the rise of representation learning in deep learning methods, more and more deep learning models such as LSTM, RNN, GCN, etc. have also been used in the work of cascade prediction. The DeepHawkes model proposed by [13] used end-to-end deep learning to simulate the explainable factors of the Hawkes process and modeled cascade information. [26] proposed an attention-based RNN to capture the cross-dependence in the cascade and a coverage strategy to overcome the misallocation of attention caused by the memoryless of the traditional attention mechanism. [10] also proposed an end-to-end model to learn the cascade graph, which automatically learned the representation of a single cascade from the global network structure without manual features. [11] introduced a new data model named diffusion topologies and proposed a novel topological recurrent neural network Topo-LSTM. DeepInf proposed by [12] took the local area network among users as input, and learned their potential influence in social network through graph convolutional networks. [27] proposed a sequential information diffusion neural network with structure attention that considers the process of information diffusion and the structural characteristics of the user graph through a recurrent neural network. [28] also proposed an attention network to solve the diffusion prediction problem, which can effectively explore the implicit diffusion dependence among information cascade users. [14] proposed competing recurrent point process on RNN network, which models both the diffusion process and the competition process. [29] proposed a multi-scale diffusion prediction model based on reinforcement learning, which integrates the macroscopic information into the RNN-based microscopic spread model for predicting infected users. [30] proposed to perform multi-task joint learning framework to understand user relationships and predict cascades with graph attention networks and recurrent neural networks. [31] estimated traffic time from trajectory of taxi in different fine-grained time intervals based on deep learning. [32] designed a RNN model with a multi-relational structure, which not only captures the traditional time dependence, but also captures the explicit multi-relational topological dependence through a hierarchical attention mechanism.
In particular, the spatial-temporal feature learning methods that using the Graph Network and RNNs achieve remarkable results. They also belong to deep learning methods. [33] and [34] aimed to predict objective trajectories. They constructed graph based on spatial coordinate and learned the subsequent positional information with RNNs. Moreover, soft attention and self attention are used to enhance representation learning, separately. [35] proposed to a social recommendation via a dynamic graph method. They encoded the long-short term preferences for users in a session based on RNN. And then they learn the dynamic graph features for user and his friends through graph attention, which are used for recommendation. On the basis of above-mentioned work, we proposed to learn the user spatial features with graph attention and then encode cascade temporal features with RNN.
In summary, the methods based on deep learning which avoid the defects of feature engineering have gradually become the major technique in cascade prediction task, but most of previous research only focused on the representation of cascade. The lack of unified modeling about user structure and temporal feature is still a key problem to be solved.
3 Methods
In this section, we start with formalization of the cascade diffusion prediction problem. Then we introduce the framework of our model, which learns the structural context among users through graph attention and then integrates the temporal feature into cascade representation by time decay effect. Finally, we present the overall algorithm and details.
3.1 Problem Formalization
Cascade is a behavior of information adoption by people in a social network. To formalize our problem, we first introduce some terminologies. A user who shares information in social network is called infected user. Given users set U = {u1, u2, … , uN}, cascades set C = {c1, c2, … , cM}, where N and M are the number of users and cascades respectively. A cascade
Cascade prediction can be divided into macro level and micro level. Macroscopic diffusion prediction aims to predict the final cascade scale. The purpose of this paper is microscopic diffusion prediction, whose aim is to predict who is the next infected user ui+1 based on social graph G and cascades set C before time ti.
3.2 Overview of Technical Framework
In order to illustrate how to capture the potential spatial-temporal information in cascade. We introduce the proposed DLIC model. As shown in Figure 2, the framework of DLIC model takes the social network and cascade as input and outputs the next infected user one by one.
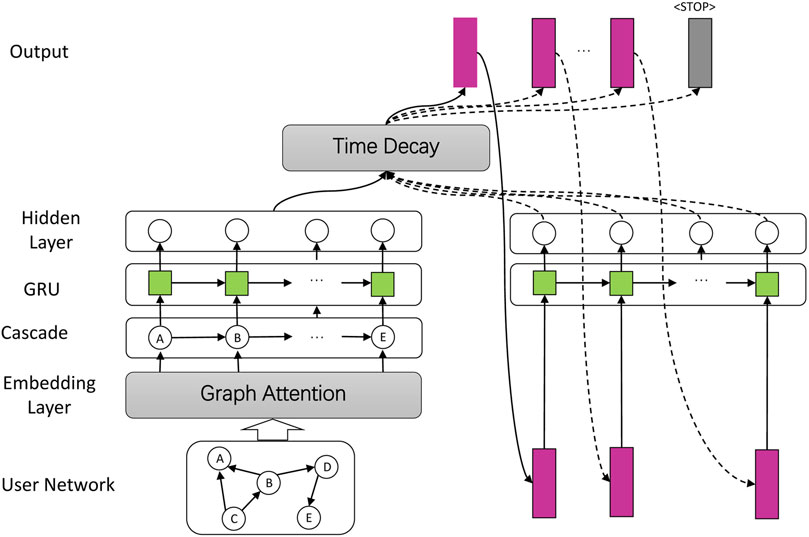
FIGURE 2. Illustration of proposed model DLIC. Given user network and a series of cascades. Our model learns their feature separately and predicts the following infected users.
The main part of the DLIC model consists of four components: 1) User embedding layer: learning user relationship based on social graph to obtain their representation through graph attention, which reflects the different influence of users. 2) Cascade encoding layer: feeding the embedding representation according to the order of observed cascade to encode cascade path through recurrent neural network. 3) Time-decay attention: the cascade representation would be further extracted through assigning different attention weights based on timestamp slice. 4) Decoding and Output layer: The last hidden state of encoding layer is the representation of this cascade. It would be took as input into decoding layer to predict the next infected user and output them one by one. Next, we give a detailed introduction to these components.
3.3 User Embedding
Social network refers to the relationship graph among users. The behaviors such as follow, like, reply and forward forms the topology of social network. This structure affects and promotes the information diffusion. Therefore, it makes sense that learn the feature of users in the social network. However, The user graph in the social network is usually very huge and complicated. If we learn the features from all users directly, it will not only take up a lot of hardware resources and time, but also may cause model performance degradation due to some noise nodes such as paid posters. So we propose a user sampling method. As Figure 3 shows, for the K observed users in cascade, we randomly selected several their neighbor nodes shown as yellow nodes. The nodes with higher degree would be selected more easier. And the others would be discarded show as white. We can obtain a subgraph for each cascade and finally integrate them as the new user graph G.
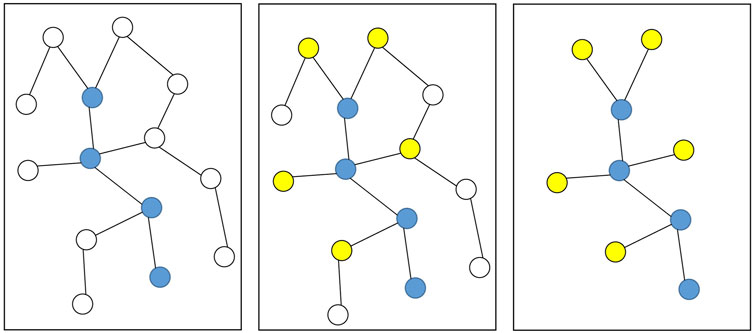
FIGURE 3. An example of users sampling method. Blue nodes is observed users. Yellow nodes is what we select.
For the obtained subgraph through above methods, we feed the adjacency matrix into a multi-layer graph attention network [36] with multi-heads to learn the user representations. Specifically, we assume vector sets h = {h1, h2, … , hN}, hi ∈ RF as features of all users, where N is the number of users, F is the number of feature dimension. And then we apply a linear transformation in h as the Eq. 1 shows:
Where W ∈ RF′×F is an independent trainable weight matrix. For a pair of neighbor nodes i and j, i.e., eij = 1, we learn the attention weight zij between them. Firstly, for each neighbor j of user i, we apply a linear transformation again after a concatenation operation for their feature vector vi and vj to obtain the attention coefficients cij = a (Wvi‖Wvj), where ‖ is the concatenation operation, a ∈ R(F′×F′) is a trainable matrix. cij represents the importance of node j relative to node i. And then it is activated with LeakyRelu function. Finally, we obtain their neighbor attention weight for each node by softmax function. The process as Eq. 2 shows:
Where
Where σ is a nonlinear activation function, i.e., RELU (⋅). Finally, we adopt the multi-head attention to stabilize the process of user feature learning. Each head attention executes the transformation of Eq. 3 independently and then concatenate them to obtain feature presentation, which contains different attention of user neighborhood. The result
Where ‖ is concatenation operation, E is the number of heads,
3.4 Cascade Encoding Layer
A user who participated in cascade diffusion is not only affected by the latest infected user, but also influenced by previous users. As shown in Figure 4, we construct a cascade path A → B → C → D which ordered by the timestamps of infected users. We can see that B is affected by A and C is affected by B which looks like a chain according to the relationship among them. Though C is the latest infected user, A may have greater influence so that D still receives message from A and become the next infected user. It means each user in cascade may affect users in the whole diffusion process from start to finish. However, a cascade does not record the message forwarding source of users. The long distance dependence of cascade feature is a problem that needs to be solved.

FIGURE 4. An illustrative example of structural context in cascade.
RNN has shown its effectiveness in many fields, which provides a theoretical support for the learning of cascade sequences. For a given cascade sequence
The reset gate ri is calculated as Eq. 6 shows:
Where σ(⋅) is sigmoid activation function, Wr ∈ RH×F, Ur ∈ RH×H and br ∈ RH are independent trainable parameters.
The update gate vi is calculated as Eq. 7 shows:
Similarly, where Wv ∈ RH×F, Uv ∈ RH×H and bv ∈ RH are also trainable parameters.
Then GRU uses reset gate ri to remember the current hidden state
Where ⊚ represents hadamard product, Wh ∈ RH×F, Uh ∈ RH×H and bh ∈ RH.
Finally, update gate zi activates the actual hidden state as Eq. 9 shows:
3.5 Time Decay Attention
In social network, the influence of previous message usually decays with time passing because of timeliness. Users are usually more sensitive to the latest messages. The information that is closer to the user’s infection time usually has a greater impact on users. However, the time function of traditional methods based on artificial definition generally can not describe this effect exactly and is hard to decide which one should be used.
In order to learn the influence of time on cascades, the following time decay attention mechanism is employed to learn the weight coefficient of current user to the previously infected users. Firstly, we divide the maximum observed time
Where ti is the infected time of user i in cascade c. We define a parameter λf(T−t) for each interval as the time decay weight. We can get the final hidden state
3.6 Decoding and Output Layer
In order to predict the subsequent infected user, we feed the presentation
Where pi ∈ R|U| is the infection probability of user i in next propagation, Wp, bp is the trainable weight matrix and bias, respectively. The training objective function to maximize the log-likelihood of all cascades is defined as Eq. 13:
Where
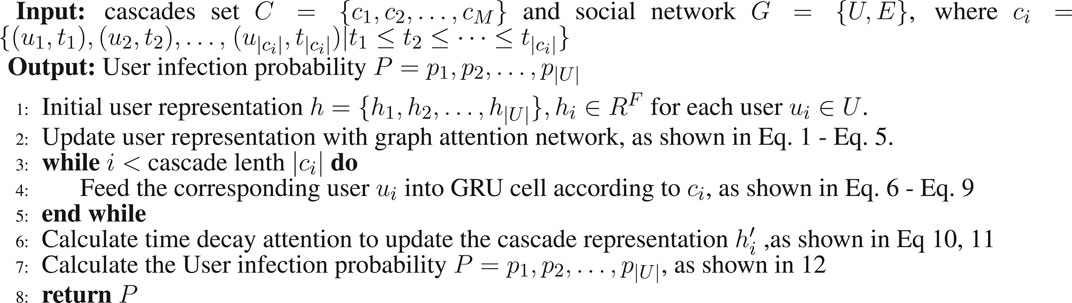
Algorithm 1. The Algorithm description of DLIC
4 Experiments
In this section, we compare the prediction performance of the proposed DLIC model with baselines and present the empirical evaluations to demonstrate the effectiveness of our model. Moreover, we perform detailed analysis to understand the role of each component in DLIC.
4.1 Datasets
In this paper, we verify the performance of our model on two public datasets. The datasets are split into training, validation and test set for 80, 10, and 10%, respectively. Table 1 shows the statistics of datasets.

TABLE 1. Statistics of datasets.
Twitter [15] dataset records retweets URL among users on Twitter during October 2010. The cascade consists of all the users who retweeted are sorted according to the time. There are 3,442 cascades which contains 12,627 users in this dataset.
Users on Douban [16] can comment on books they have read. Users’ comments on a book at a certain time can be regarded as infected. The diffusion process of a book is regarded as a cascade. There are 10,602 cascades which contains 23,123 users in this dataset.
4.2 Evaluation Metric
The purpose of cascade prediction is to predict the next infected user based on given observed users. In order to simplify the task and make it easy to evaluate, we regard it as a retrieval task that detect k infected users in the remaining users. Therefore, we first rank the uninfected nodes according to the predicted infection probability, and then evaluate the Top-k infected users according to k = 10, 50, 100, respectively. The evaluation metrics are mean average precision (MAP) and HITS.
MAP@k: Mean average precision for a set of cascade predictions is the mean of the average precision scores for each cascade. We assume there are M infected users in top-k users so we can obtain a set of recall value R = (1/M, 2/M, … , M/M). Then for each r ∈ R, we can calculate the maximum precision maxr′>rP (r′) to obtain average precision AP. Finally, mean average precision is calculated by the average of AP in cascades set C that we predicted. The formula is showed as Eq. 14:
HITS@k: The rate of the top-k ranked nodes containing the next infected node. The formula is showed as Eq. 15:
Where p (⋅) is an indicator function. If there is actual infected user in prediction result of cascade c, then p = 1. Otherwise, p = 0.
4.3 Baselines
In order to evaluate the performance of the DLIC model, the following baselines are applied to the same dataset to compare with the proposed model.
Topo-LSTM [11] is a model based on LSTM, which extracts directed acyclic graph from social graph and integrates its features into hidden state, which is used to predict the next node and its network structure.
SNIDSA [19] calculates the pairwise similarity of all user pairs, captures the structural dependency among users, and designs a gating mechanism to merge temporal and structural information into RNN.
FOREST [29] uses RNN to encode microscopic cascade information, which is used to learn the structural characteristics of the cascade. Also, it improved the performance through a reinforcement learning framework from macroscopic level to predict the infected nodes.
4.4 Experimental Settings
The DLIC model proposed in this paper adopts the seq2seq as the framework and graph attention network with 8 heads is used to optimize the target task. During the experiment, we set the number of observed users K = 10, then randomly sampled 20 neighbors of each node and used half-precision fp16 for training, and the objective function is optimized through the Adam algorithm. The specific hyperparameters setting of the experiment are shown in Table 2.
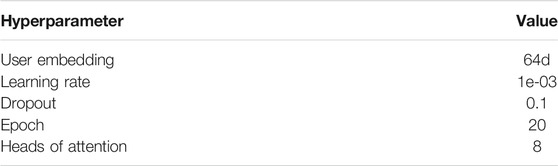
TABLE 2. The setting of hyperparameters.
4.5 Experimental Results
In order to verify the effectiveness of our proposed model, we compared it with the state-of-the-art cascade prediction methods on two datasets, trying to evaluate the effect of predicting the future infected users with the metric of HITS and MAP. The result is the average of five experiments as shown on Table 3.
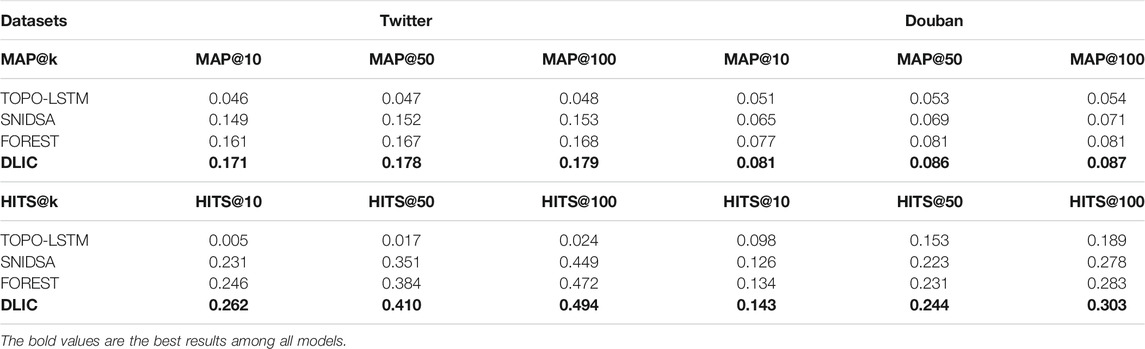
TABLE 3. Experimental results of our proposed model on Twitter and Douban. Results are evaluated by MAP@k and HITS@k in different categories of model on the cascade prediction task. For both metrics, scores are the higher the better.
The experimental results show that the DLIC model proposed in this paper has improved all metrics on the two datasets. The results indicate improvements on MAP@k and HITS@k by more than 1 and 1.6% separately on Twitter, more than 0.4 and 0.9% separately on Douban, which proved that DLIC performs the best over other SOTR baselines in cascading prediction task.
The overall superiority of DLIC over the baselines mainly comes from two facts: 1) In the aspect of user network structure, thanks to the improvements of encoding of structural context, we achieve a better performance in the user embedding representation. The previous works only considered the influence of neighboring user nodes, while DLIC learns global user features through graph attention network. 2) In the aspect of cascading features, the improvements mostly come from the latent influence of user activation time. The previous works only regarded timestamps as a sequence of users activation order or simple learning parameters, while DLIC learns the weights of different time periods by introducing time decay attention mechanism.
Overall, the proposed DLIC model which combines users relationship and cascade feature could achieve better performance. It proves that research on unified modeling is a effective way to predict cascade diffusion. We will consider it for our future work.
4.6 Ablation Study
Our model uses a graph attention on the embedding layer to learn the user topology structure and takes the time decay attention to learn temporal feature of cascades. In order to explore the influence of each component in our proposed model, we remove them separately for experiments. For this purpose, we present two simplified versions of DLIC, denoted as w/o GAT and w/o time decay.
The results of ablation experiments on two datasets verify the effectiveness of components mentioned above. When we remove the corresponding component, all metrics have decreased on both datasets, which show they are effective and reflect the different impacts of them in our model. As we can see on Figure 5, results on MAP@50 and HITS@50 decrease by 0.9 and 1.8%, respectively, on Twitter, and 0.7 and 2.2% respectively on Douban when we remove GAT. Results on MAP@50 and HITS@50 decrease by 0.2 and 0.7% respectively on Twitter, and 0.3 and 0.6% respectively on Douban when we remove time decay attention.
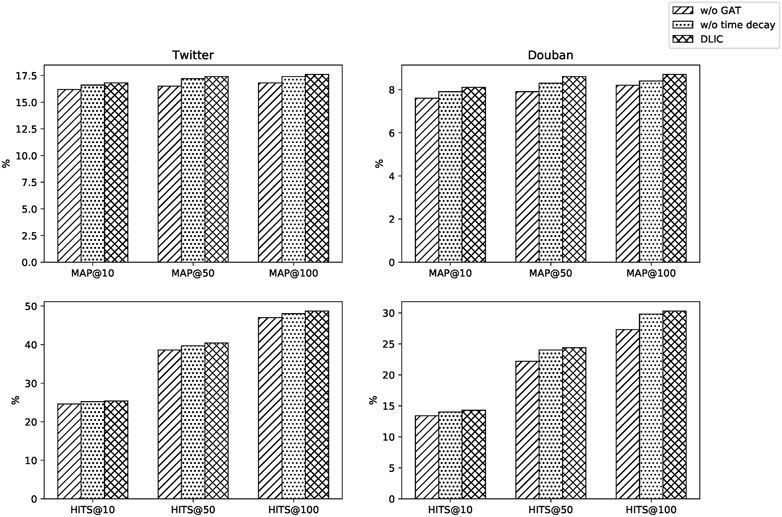
FIGURE 5. The experimental results of ablation study, which show the influence of different components, w/o means removing the corresponding component.
In summary, it can be seen that GAT has a great impact on our model, because the user topology structure is learned so that more context information is integrated to user embedding representation. The time-decay attention alone has little effect on the model when we remove time-decay. However, it can improve model performance when combined with the graph attention network.
4.7 Analysis of User Neighbor Sampling
To effectively utilize the user relationship from social network, we construct subgraph by sampling several user neighbors to learn the user representation with graph attention. For this purpose, we select different number of user neighbor sampling for experiment.
As we can see in Figure 6, with the increase of the number of user neighbor sampling, the performance of our model decreases first, then increases to the top, finally continues to decline on the metric of MAP@k. The result on metric of HITS@k also increases first and then decrease. Our proposed model achieves the best performance on both metric when we sample 20 neighbors. It shows that user representation with relationship structure is conductive to the cascade prediction. The main reason is the position of user in social network can reflect the influence to a certain extent. However, too many neighbors who is lack of influence may also introduce noise, which leads to the decline of prediction performance. Based on the above analysis, finally we sample 20 user neighbors for experiment.
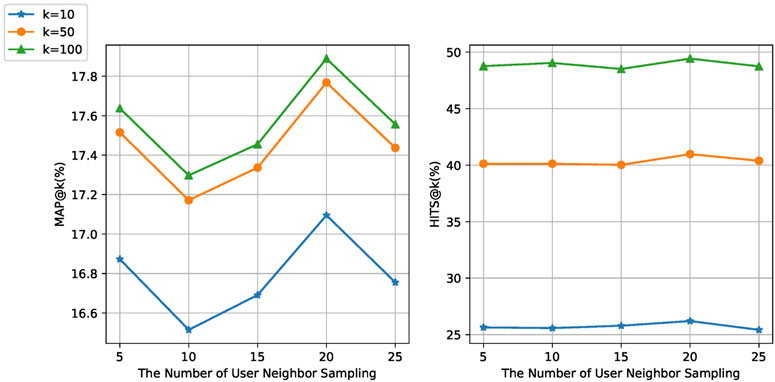
FIGURE 6. The influence of number of user neighbor sampling on the metrics of MAP@k and HITS@k.
5 Conclusion
In this paper, we proposed a cascade prediction method based on graph attention recurrent neural network for cascade prediction task. The main creative point is that our model can learn the spatial-temporal feature at the same time based on GAT and time-decay attention, respectively. Experiments on two public real-word datasets verify the effectiveness of our model in cascade prediction task and analyse the performance of different components. In the future, we plan to explore more attention mechanism to further mine the structural information between cascades.
Data Availability Statement
The original contributions presented in the study are included in the article/Supplementary Material, further inquiries can be directed to the corresponding author.
Author Contributions
All authors conceived the paper. ZC drafted the initial manuscript. ZC and SL developed the software, run the analyses. TC participated in discussion of theories. JW and XL supervised the study and edited manuscript. All authors reviewed the paper.
Funding
This research was Supported by National Natural Science Foundation of China (No.61976054), the science and technology guiding project (2019H0040) of Fujian Province of the people’s Republic of China.
Conflict of Interest
The authors declare that the research was conducted in the absence of any commercial or financial relationships that could be construed as a potential conflict of interest.
Publisher’s Note
All claims expressed in this article are solely those of the authors and do not necessarily represent those of their affiliated organizations, or those of the publisher, the editors and the reviewers. Any product that may be evaluated in this article, or claim that may be made by its manufacturer, is not guaranteed or endorsed by the publisher.
References
1. Guille A, Hacid H, Favre C, Zighed DA. Information Diffusion in Online Social Networks: A Survey. ACM Sigmod Rec (2013) 42:17–28. doi:10.1145/2503792.2503797
2. Barabási A-L, Albert R. Emergence of Scaling in Random Networks. science (1999) 286:509–12. doi:10.1126/science.286.5439.509 |
3. Qiu J, Tian Z, Du C, Zuo Q, Su S, Fang B. A Survey on Access Control in the Age of Internet of Things. IEEE Internet Things J (2020) 7:4682–96. doi:10.1109/JIOT.2020.2969326
4. Wang Xiaoming YJ, Wang L. Research on Microblog Information Diffusion Network Structural Properties. J Chin Inf Process (2014) 28:55.
5. Zhao L, Wang J, Chen Y, Wang Q, Cheng J, Cui H. Sihr Rumor Spreading Model in Social Networks. Physica A: Stat Mech its Appl (2012) 391:2444–53. doi:10.1016/j.physa.2011.12.008
6. Xia C, Wang L, Sun S, Wang J. An Sir Model With Infection Delay and Propagation Vector in Complex Networks. Nonlinear Dyn (2012) 69:927–34. doi:10.1007/s11071-011-0313-y
7. Zhao L, Cui H, Qiu X, Wang X, Wang J. Sir Rumor Spreading Model in the New Media Age. Physica A: Stat Mech its Appl (2013) 392:995–1003. doi:10.1016/j.physa.2012.09.030
8. Mishra S, Rizoiu M, Xie L. Feature Driven and point Process Approaches for Popularity Prediction. In: Proceedings of the 25th ACM International Conference on Information and Knowledge Management, CIKM 2016; October 24-28, 2016; Indianapolis, IN, USA. (ACM) (2016). p. 1069–78. doi:10.1145/2983323.2983812
9. Aral S, Walker D. Identifying Influential and Susceptible Members of Social Networks. Science (2012) 337:337–41. doi:10.1126/science.1215842 |
10. Li C, Ma J, Guo X, Mei Q. Deepcas: An End-To-End Predictor of Information Cascades. In: Proceedings of the 26th International Conference on World Wide Web, WWW 2017; April 3-7, 2017; Perth, Australia. (ACM) (2017). p. 577–86. doi:10.1145/3038912.3052643
11. Wang J, Zheng VW, Liu Z, Chang KC. Topological Recurrent Neural Network for Diffusion Prediction. In: 2017 IEEE International Conference on Data Mining, ICDM 2017; November 18-21, 2017; New Orleans, LA, USA. IEEE Computer Society (2017). p. 475–84. doi:10.1109/ICDM.2017.57
12. Qiu J, Tang J, Ma H, Dong Y, Wang K, Tang J. Deepinf: Social Influence Prediction With Deep Learning. In: Proceedings of the 24th ACM SIGKDD International Conference on Knowledge Discovery & Data Mining, KDD 2018; August 19-23, 2018; London, UK. (ACM) (2018). p. 2110–9. doi:10.1145/3219819.3220077
13. Cao Q, Shen H, Cen K, Ouyang W, Cheng X. Deephawkes: Bridging the Gap Between Prediction and Understanding of Information Cascades. In: Proceedings of the 2017 ACM on Conference on Information and Knowledge Management. (ACM) (2017). p. 1149–58. doi:10.1145/3132847.3132973
14. Saha A, Samanta B, Ganguly N, De A. CRPP: Competing Recurrent Point Process for Modeling Visibility Dynamics in Information Diffusion. In: Proceedings of the 27th ACM International Conference on Information and Knowledge Management, CIKM 2018; October 22-26, 2018; Torino, Italy. (ACM) (2018). p. 537–46. doi:10.1145/3269206.3271726
15. Hodas NO, Lerman K. The Simple Rules of Social Contagion. Scientific Rep (2014) 4:4343. doi:10.1038/srep04343 |
16. Zhong E, Fan W, Wang J, Xiao L, Li Y. Comsoc: Adaptive Transfer of User Behaviors over Composite Social Network. In: The 18th ACM SIGKDD International Conference on Knowledge Discovery and Data Mining, KDD ’12; August 12-16, 2012; Beijing, China. (ACM) (2012). p. 696–704. doi:10.1145/2339530.2339641
17. Bourigault S, Lamprier S, Gallinari P. Representation Learning for Information Diffusion Through Social Networks. In: Proceedings of the Ninth ACM international conference on Web Search and Data Mining. (ACM) (2016). p. 573–82. doi:10.1145/2835776.2835817
18. Gao S, Pang H, Gallinari P, Guo J, Kato N. A Novel Embedding Method for Information Diffusion Prediction in Social Network Big Data. IEEE Trans Ind Inform (2017) 13:2097–105. doi:10.1109/TII.2017.2684160
19. Mi Z, Hui Z, Chunming Y, Bo L, Xujian Z. Microblog Opinion Leader Mining Based on a Multi-Feature Information Diffusion Model. J Chin Inf Process (2018) 32:129–38.
20. Tian Z, Su S, Shi W, Du X, Guizani M, Yu X. A Data-Driven Method for Future Internet Route Decision Modeling. Future Gener Comput Syst (2019) 95:212–20. doi:10.1016/j.future.2018.12.054
21. Liu Xiaoyang HD, Tang T. Mathematical Modeling and Public Opinion Evolution Analysis of Information Diffusion With the User Attributes. J Chin Inf Process (2019) 33:115.
22. Liu S, Shen H, Zheng H, Cheng X, Liao X. Ct Lis: Learning Influences and Susceptibilities Through Temporal Behaviors. ACM Trans Knowledge Discov Data (Tkdd) (2019) 13:1–21. doi:10.1145/3363570
23. Tian Z, Luo C, Lu H, Su S, Sun Y, Zhang M. User and Entity Behavior Analysis Under Urban Big Data. Trans Data Sci (2020) 1:16. doi:10.1145/3374749
24. Guo J, Chen T, Wu W. A Multi-Feature Diffusion Model: Rumor Blocking in Social Networks. IEEE/ACM Trans Networking (2021) 29:1. 386–397. doi:10.1109/TNET.2020.3032893
25. Gu Z, Wang L, Chen X, Tang Y, Wang X, Du X, et al. Epidemic Risk Assessment by a Novel Communication Station Based Method. IEEE Trans Netw Sci Eng (2021):1. doi:10.1109/TNSE.2021.3058762
26. Wang Y, Shen H, Liu S, Gao J, Cheng X. Cascade Dynamics Modeling With Attention-Based Recurrent Neural Network. In: Proceedings of the Twenty-Sixth International Joint Conference on Artificial Intelligence, IJCAI 2017; August 19-25, 2017; Melbourne, Australia. (ijcai.org) (2017). p. 2985–91. doi:10.24963/ijcai.2017/416
27. Wang Z, Chen C, Li W. A Sequential Neural Information Diffusion Model With Structure Attention. In: Proceedings of the 27th ACM International Conference on Information and Knowledge Management, CIKM 2018; October 22-26, 2018; Torino, Italy. ACM) (2018). p. 1795–8. doi:10.1145/3269206.3269275
28. Wang Z, Chen C, Li W. Attention Network for Information Diffusion Prediction. In: Companion of the The Web Conference 2018 on The Web Conference 2018, WWW 2018; April 23-27, 2018; Lyon , France. (ACM) (2018). p. 65–6. doi:10.1145/3184558.3186931
29. Yang C, Tang J, Sun M, Cui G, Liu Z. Multi-scale Information Diffusion Prediction with Reinforced Recurrent Networks. In: Proceedings of the Twenty-Eighth International Joint Conference on Artificial Intelligence, IJCAI 2019; August 10-16, 2019; Macao, China. (ijcai.org) (2019). p. 4033–9. doi:10.24963/ijcai.2019/560
30. Chen X, Zhang K, Zhou F, Trajcevski G, Zhong T, Zhang F. Information Cascades Modeling via Deep Multi-Task Learning. In: Proceedings of the 42nd International ACM SIGIR Conference on Research and Development in Information Retrieval. (ACM) (2019). p. 885–8. doi:10.1145/3331184.3331288
31. Qiu J, Du L, Zhang D, Su S, Tian Z. Nei-tte: Intelligent Traffic Time Estimation Based on Fine-Grained Time Derivation of Road Segments for Smart City. IEEE Trans Ind Inform (2020) 16:2659–66. doi:10.1109/tii.2019.2943906
32. Cai H, Nguyen TT, Li Y, Zheng VW, Chen B, Cong G. Modeling Marked Temporal point Process Using Multi-Relation Structure Rnn. Cogn Comput (2020) 12:499–512. doi:10.1007/s12559-019-09690-8
33. Vemula A, Muelling K, Oh J. Social Attention: Modeling Attention in Human Crowds. In: 2018 IEEE International Conference on Robotics and Automation, ICRA 2018; May 21-25, 2018; Brisbane, Australia. IEEE (2018). p. 1–7. doi:10.1109/ICRA.2018.8460504
34. Ye L, Wang Z, Chen X, Wang J, Wu K, Lu K. GSAN: Graph Self-Attention Network for Interaction Measurement in Autonomous Driving. In: 17th IEEE International Conference on Mobile Ad Hoc and Sensor Systems, MASS 2020; December 10-13, 2020; Delhi, India. IEEE (2020). p. 274–82. doi:10.1109/mass50613.2020.00042
35. Song W, Xiao Z, Wang Y, Charlin L, Zhang M, Tang J. Session-based Social Recommendation via Dynamic Graph Attention Networks. In: JS Culpepper, A Moffat, PN Bennett, and K Lerman, editors. Proceedings of the Twelfth ACM International Conference on Web Search and Data Mining, WSDM 2019, Melbourne, VIC; February 11-15, 2019; Australia. (ACM) (2019). p. 555–63. doi:10.1145/3289600.3290989
Keywords: social network, information diffusion, cascade prediction, deep learning, graph attention
Citation: Chen Z, Wei J, Liang S, Cai T and Liao X (2021) Information Cascades Prediction With Graph Attention. Front. Phys. 9:739202. doi: 10.3389/fphy.2021.739202
Received: 10 July 2021; Accepted: 05 August 2021;
Published: 20 August 2021.
Edited by:
Daihai He, Hong Kong Polytechnic University, SAR ChinaReviewed by:
Kam-Fai Wong, The Chinese University of Hong Kong, ChinaLiang Y. Ang, Dalian University of Technology, China
Copyright © 2021 Chen, Wei, Liang, Cai and Liao. This is an open-access article distributed under the terms of the Creative Commons Attribution License (CC BY). The use, distribution or reproduction in other forums is permitted, provided the original author(s) and the copyright owner(s) are credited and that the original publication in this journal is cited, in accordance with accepted academic practice. No use, distribution or reproduction is permitted which does not comply with these terms.
*Correspondence: Xiangwen Liao, bGlhb3h3QGZ6dS5lZHUuY24=