 Viviana Clavería1,2
 Philippe Connes3,4,5
 Luca Lanotte1
 Céline Renoux3,4,6
 Philippe Joly3,4,6
 Romain Fort3,4,7
 Alexandra Gauthier3,4,8
 Christian Wagner2
 Manouk Abkarian1,4*
- 1Centre de Biologie Structurale, CNRS UMR 5048 - UM - INSERM UMR 1054, Université de Montpellier, Montpellier, France
- 2Experimental Physics, Saarland University, Saarbrücken, Germany
- 3Laboratoire Interuniversitaire de Biologie de la Motricité (LIBM) EA7424, Equipe « Biologie Vasculaire et du Globule Rouge », Université Claude Bernard Lyon 1, COMUE, Lyon, France
- 4Laboratoire d’Excellence sur le Globule Rouge (Labex GR-Ex), Paris, France
- 5Institut Universitaire de France, Paris, France
- 6Laboratoire de Biochimie et de Biologie Moléculaire, UF de Biochimie des Pathologies érythrocytaires, Centre de Biologie et de Pathologie Est, Hospices Civils de Lyon, Lyon, France
- 7Médecine Interne, Hôpital Edouard Herriot, Hospices Civils de Lyon, Lyon, France
- 8Institut d’Hématologie et d’Oncologie Pédiatrique (IHOP), Hospices Civils de Lyon, Lyon, France
Red blood cells in sickle cell anemia (sRBC) are more heterogeneous in their physical properties than healthy red blood cells, spanning adhesiveness, rigidity, density, size, and shape. sRBC with increased adhesiveness to the vascular wall would trigger vaso-occlusive like complications, a hallmark of sickle cell anemia. We investigated whether segregation occurs among sRBC flowing in micron-sized channels and tested the impact of aggregation on segregation. Two populations of sRBC of different densities were separated, labeled, and mixed again. The mixed suspension was flowed within glass capillary tubes at different pressure-drops, hematocrit, and suspending media that promoted or not cell aggregation. Observations were made at a fixed channel position. The mean flow velocity was obtained by using the cells as tracking particles, and the cell depleted layer (CDL) by measuring the distance from the cell core border to the channel wall. The labeled sRBC were identified by stopping the flow and scanning the cells within the channel section. The tube hematocrit was estimated from the number of fluorescence cells identified in the field of view. In non-aggregating media, our results showed a heterogeneous distribution of sRBC according to their density: low-density sRBC population remained closer to the center of the channel, while the densest cells segregated towards the walls. There was no impact of the mean flow velocity and little impact of hematocrit. This segregation heterogeneity could influence the ability of sRBC to adhere to the vascular wall and slow down blood flow. However, promoting aggregation inhibited segregation while CDL thickness was enhanced by aggregation, highlighting a potential protective role against vaso-occlusion in patients with sickle cell anemia.
Introduction
Sickle cell anemia is an inherited hemoglobinopathy, which affects millions of people worldwide [1]. It is caused by a point mutation in the β-globin gene resulting in the production of abnormal hemoglobin, called HbS. When deoxygenated, HbS proteins polymerize into long fibers, which can span the size of a sickle red blood cell (sRBC), distorting it into the classical crescent shape. Frequent polymerization induces temporal, irreversible, and structural modifications of the membrane that reduce the lifespan of sRBC, showing a marked increase in their membrane average shear modulus [2] and adhesiveness [3, 4] compared to red blood cells from unaffected individuals (healthy RBC).
The resulting repeated acute vaso-occlusive crises and chronic vascular damaging lead to marked tissue ischemia and hypoxia, potentially causing multiple sequelae of the disease such as stroke, splenic infarction, priapism, acute chest syndrome, kidney failure, pulmonary hypertension, osteonecrosis, and retinopathy [5]. But the defining factors that lead mechanistically to vaso-occlusion remain unclear. In particular, the respective role of enhanced adhesiveness and mechanical stiffening of the membrane of sRBC is not yet deciphered. While it is simple to understand that more adhesive membranes could lead to sRBC deposition on specific locations of the vessels, leading to catastrophic caliber reduction or even occlusion, no study focused on the biophysical and hemodynamic properties that could make sRBC prone to flow more or less near the vascular wall while flowing as a suspension. Healthy RBC deformability is known to modulate the radial migration of single cells toward the centerline of the vessel. Any modification in the mechanical properties as described for sRBC membrane [6, 7] could induce a change in this protective hydrodynamic effect. We suspect that an opposite migration toward vessel walls, called margination, could occur for some sub-populations of sRBC, leading to a higher probability of deposition. While not studied experimentally for sRBC in suspensions, such margination has been described for white blood cells and platelets [8–12] more rigid cells than healthy RBC. Abundant literature discusses the role of particle shape, size, and rigidity in both migration and margination [13–24]. For example, recent numerical and theoretical investigations [14, 15, 25] showed how stiffness contrast remains a crucial parameter in these processes [13, 14]. Stiffer capsules from a binary suspension composed of capsules with two different rigidities would marginate, inducing capsules’ radial segregation during flow in vessels [13, 14, 25].
Heterogeneous distribution of sRBC in arterioles and venules is therefore a key point to consider in terms of their potential impact on vaso-occlusive phenomena. However, no study has directly investigated such segregation of adhesive sub-populations of sRBC. The present study aimed to test the effect of sRBC densities that relates mainly to sRBC rigidity, on the radial distribution of sRBC across a glass capillary-based microfluidic device. Since the presence of healthy RBC aggregates in flowing healthy RBC suspension may modulate blood flow spatial structuring [26], we tested the impact of aggregation in the segregation process of sRBC and discussed its potential role in vaso-occlusion.
Materials and Methods
Blood Samples
Blood from four patients with SCA (SS; HbS = 85.7 ± 4.0%; HbF = 7.0 ± 5.0%) at steady-state (i.e., no acute vaso-occlusive events or transfusion within the last 3 months preceding the study) were collected in EDTA tubes. The protocol was approved by the Hospices Civils de Lyon–CPP Est Ethics Committee (L14-127) and was carried out following the guidelines set by the declaration of Helsinki. Blood was centrifuged at 1,000 g for 5 min at 23°C. Plasma was removed by aspiration, reserved in a plastic container, and stored at 4°C to use as a suspending medium. The buffy coat was removed by aspiration, and the total volume of sRBC was measured with the help of a pipette. sRBC were washed 3 times with phosphate-buffered saline (PBS, Invitrogen, Darmstadt, Germany), by centrifuging the sRBC at 1,000 g for 5 min at 23°C each time. After washing, sRBC were resuspended in PBS supplemented by 5 mM of glucose.
Percoll Continuous Density Separation
sRBC suspensions were then separated according to their densities by discontinuous gradient Percoll-based method (Percoll P1644-500ML, Sigma Aldrich). The density values used were the following: 1.085, 1.092, 1.101, 1.107, and 1.122 g/ml, corresponding to mean corpuscular hemoglobin concentration (MCHC) of 31.2, 34.5, 38.7, and +42 g/dl, respectively [27]. One ml of sRBC suspended in PBS with 5 mM glucose (hematocrit ranging from 30 to 50%) was deposited at the top of the discontinuous percoll gradient and centrifuged at 4,000 g for 30 min at 4°C without a break in a centrifuge with a swinging rotor. At the end of the centrifugation, sRBC migrated and stopped according to their densities between the different layers. The lightest sRBC (fraction I) was located at the top between the buffer solution and the first percoll-based density layer (1.085 g/ml). Fraction II of sRBC was located between 1.085 and 1.092 g/ml layers, fraction III between 1.092 and 1.101 g/ml layers, fraction IV between 1.101 and 1.107 g/ml layers, and fraction V between 1.107 and 1.122 g/ml layers. Reversible sRBC are predominant in the lightest fraction (I), irreversible sRBC are predominant in the densest fraction (V), and a mixture of reversible and irreversible were found in the intermediate fractions [27]. In this study, we used fractions II and IV, which differ in density and deformability [28]. sRBC of each fraction were removed by aspiration, their volume measured with the help of a pipette and washed three times in PBS containing 5 mM of glucose. 1/16 parts of the total amount of sRBC in fractions II and IV were labeled using PKH67 (green) and PKH26 (red) fluorescent cell membrane linker (PKH26(67) GL-1KT, Sigma Aldrich), respectively. The band volume fraction VB/V, where VB is the volume of each band of sRBC, and V is the total sRBC volume of the pellet before being separated into bands, was obtained for each patient. Values were plotted (see Figure 1).
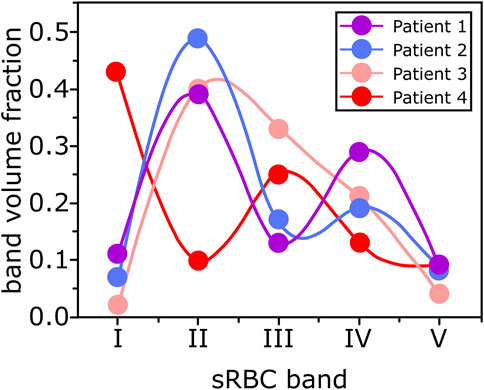
FIGURE 1. Each dot corresponds to a sRBC band volume fraction (VB/V, where VB is the sRBC band volume and V is the total volume of sRBC) for each patients’ blood sample. The curves are guidelines.
Finally, sRBC from all density fractions (labeled and non-labeled) were mixed to recover each patient’s original sRBC pellet composition. We tested the effects of different suspending media.
Suspending Media
We used PBS with 1 mg/ml concentration of bovine serum albumin (BSA, Polysciences, Warrington, United States) as a suspending medium. BSA was used to preserve the biconcave shape of the sRBC [29] and avoid echinocyte formation due to sRBC-glass interaction. This suspending medium is called buffer solution (BS). 20 mg/ml of dextran 70 (molecular weight of 70 kDa) was added to BS and the suspending medium called BS + Dex70. This amount of dextran 70 is known to induce interaction energy of ε = 4.8 μJm−2 among healthy RBC [30], mimicking interaction energy caused by a physiological amount of fibrinogen. Although there is no value for the interaction energy among sRBC for different fibrinogen and dextran 70 concentrations, we assumed the same concentration will mimic physiological interaction energies among sRBC. In a third set of experiments, we also used autologous plasma as a suspending medium (plasma condition) to better reflect the physiological flowing conditions of sRBC.
sRBC Aggregation Properties
Because dextran and plasma may promote sRBC aggregation, the strength of sRBC aggregates of SCA patients was evaluated by syllectometry in plasma and 3% of dextran 70 kDa (LORCA MaxSis, Mechatronics, Netherlands) [31]. 3% of dextran 70 kDa will promote interaction energy among sRBC similar to 20 mg/ml of dextran 70 kDa [26].
Microfluidic Device
A glass capillary-based microfluidic device (capillaries CV0508, CM Scientific) with an inner diameter of 50 μm and 50 mm in length was used. Inlet and outlet were fabricated using needles bases (20Gx1″, 0.9 × 25 mm, Terumo). The capillaries were surrounded with PDMS to approach its refractive index and avoid light-aberration during observation due to the cylindrical shape of the glass capillaries.
Experimental Setup and Stop Flow Technique
A high-precision pressure device (OB1, Elveflow) with two independent pressure lines was used to flow and stop the flow inside the glass capillaries. Glass capillaries were filled with PBS from the external reservoir (ER) 1 to 2 to eliminate bubbles and have a gas-tight system filled with our sample. Line 2 produced a counter pressure to Line 1 stopping sRBC flow inside the capillaries. sRBC suspension were pumped at four different pressure drops from ER 1 to ER 2: 25, 50, 100, and 200 mbar. See Figure 2 for configuration details.
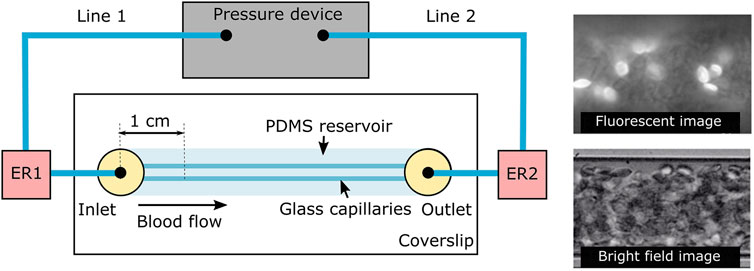
FIGURE 2. Experimental setup. A high-precision pressure device with two independent pressure lines 1 and 2 was used to flow and stop the flow of the sample inside the glass capillaries. Glass capillaries were surrounding by PDMS to decrease light diffraction. ER1 and ER2 are the external sample reservoirs integrated to the flow lines and sealed to the exterior to avoid leaking and pressure loses. Observations were made 1 cm onwards the channel entrance as shown in the scheme. At the right, examples of fluorescence (top) and bright field (bottom) images are shown.
In each experiment, around 50 sRBC were detected and recorded. Each experiment was repeated 5 to 6 times to have 300 sRBC for analysis for each flow condition.
Sample Observation
The microfluidic device was installed on an inverted microscope (Olympus IX71). sRBC were observed and recorded 1 cm downstream the entrance of the capillaries using an x60 magnification oil-immersion-objective (Olympus Corp.) and a high-speed camera (Phantom Miro LC310, Vision research). Bright-field image sequences at the channel middle-plane of flowing sRBC were recorded. Right after the flow was stopped, fluorescence image sequences were recorded for the same capillary position. In this last case, green and red filters were used to observe fluorescence sRBC from bands II and IV, respectively. sRBC were manually scanned from the capillary middle-plane to the bottom and from the bottom to the capillary middle-plane at a scan velocity of approximately 30 μm/s. Sedimentation velocity of single healthy RBC (plasma viscosity = 1.2 cP) has a value of around 0.02 μm/s in plasma [32] and 0.024 μm/s in PBS (PBS viscosity = 1 cP). Using these values as references for sRBC, we estimated that sRBC were displaced 0.06 μm from their original position after completing one full scan (back and forth), so we neglected any displacement due to sedimentation on the sRBCs’ positioning.
Image Processing and Data Post-Processing
PIVlab 1.41 Matlab-App [33] was used to estimate the instantaneous flow velocity evaluating the bright field images and using the sRBC as tracer particles. The cell-depleted layer thickness (δ) was determined by getting standard deviation pixel intensity values using 500 bright-field images. ImageJ 1.49v software was used to manually identify and select the position of fluorescence-labeled sRBC and the capillary limits (bottom and center) from the fluorescence images.
sRBC Positions in the Channel
We obtained three-dimensional spatial positions of sRBC inside the capillary by evaluating the fluorescence image sequence as shown in Figure 3. Only fluorescently labeled sRBC detected from the bottom up to half of the capillary height were considered (Figures 3A–C). Above this position, sRBCs’ brightness started to be too weak due to light absorption and scattering.
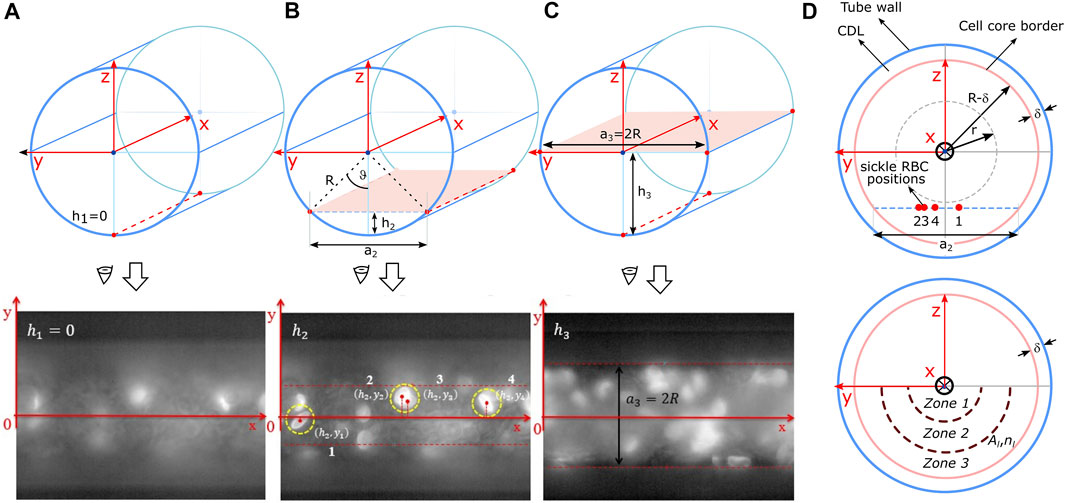
FIGURE 3. The upper and lower panel in (A–C) represent the scanning process of the fluorescence sRBC. In this case, the scanning goes from bottom of the capillary until its middle-plane. The spatial positioning of the sRBC, obtained on each scanning, was projected in the yz plane as shown in the upper panel in (D). The bottom-semicircular area shown in the lower panel in (D) is divided in three zones called zones 1, 2, and 3, that have the same area Al. The number of sRBC inside each zone is nl.
These three-dimensional positions were projected onto the capillary transversal plane as shown in Figure 3D to obtain the radial position of each labeled sRBC, normalized by the radius (R−δ) of the core of the entire suspension. Here, R is the radius of the channel, and δ the cell depleted layer (CDL) thickness (Figure 3D). Noteworthy, the thickness δ of the CDL was obtained from brightfield images as shown in Figure 4 as described in Image processing and data post-processing section. sRBC were located at the core extremity (or at the beginning of the CDL) when their position equals 1.
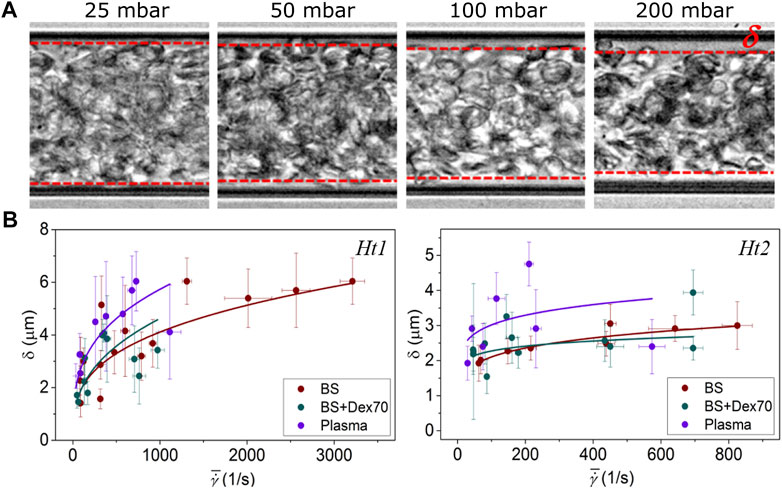
FIGURE 4. (A) Representative pictures of the CDL thickness (δ); (B), δ vs. average shear rate. A power law fitting has been included for easier visualization of the CDL thickness trend.
Once all sRBC positions were normalized and registered, we calculated the average number-density ρ over the first half of the core cross-sectional area π(R−δ)2/2 as:
where nL is the total number of counted sRBC. Radial variation of sRBC number-densities ρl was calculated by dividing the number of sRBC nl enclosed in three different zones with the same area Al as depicted in Figure 3D. A non-dimensional radial number-density was defined as ρl/ρ and named sRBC radial accumulation. sRBC radial accumulation was used to compare the radial distribution of the different labeled bands of sRBC at different experimental conditions.
Tube Hematocrit, Ht
We investigated the effect of hematocrit on sRBC segregation for two different bulk hematocrits H1 = 20% and H2 = 40% for each suspending media. The tube hematocrit Ht was estimated as follows:
where nL is the total number of sRBC projected in the transversal plane, VRBC is the average volume of a single healthy RBC, taken as a reference for sRBC [34–36], VC/2 is half of the cylindrical volume enclosed by the capillary in the field of view. 1/16 is the volume fraction of labeled sRBC with respect to the full sample volume V. For each bulk hematocrit H1 and H2, the mean tube hematocrit values were Ht1 = 18.5 ± 1.0% and Ht2 = 25.9 ± 1.3% respectively, considering all suspending media. Notice that these tube hematocrits were obtained experimentally. Also, the values decreased compared to the bulk hematocrit due to the Fåhræus effect. The bulk hematocrits were chosen to be around the physiological range reported for SCA patients (H1 = 20%) [47] and one higher value (H2 = 40%), to evaluate the effect of the hematocrit on sRBC segregation.
Pressure-Drop, ΔP
Four different pressure drops were investigated for each experimental condition of suspending media and hematocrit. Since pressure-drop variations produced no significant differences in the distribution of the sRBC, we averaged sRBCs’ radial densities over the different pressure-drops to increase statistics and compare accumulation among the various density bands observed in our experiments.
Flow Velocity
The maximum sRBC velocity increased when increasing pressure drops, ranging from 2 mm/s up to 40 mm/s for sRBCs suspended in BS, ∼1–16 mm/s in BS + Dex70, and ∼0.7–13 mm/s in plasma. The differences between the different suspending media are due to their slight difference in viscosity. The maximum velocity values decreased for higher tube hematocrit: ∼1–15 mm/s in BS and ∼0.9–11 mm/s for both BS + Dex70 and plasma. As a reference, physiological healthy RBC velocity at the arteriole level has a mean value around 5 mm/s. Arterioles have a diameter around 50 μm [26]. Therefore, we assumed that a pressure-drop of 50 mbar represented a physiological condition for sRBC suspended in BS, and 100 mbar when sRBC suspended in BS + Dex70 and plasma (i.e., media with higher viscosities).
Statistics
We performed a two-way analysis of variance (ANOVA) using Matlab’s Anova2 function, to assess differences in sRBC distributions for band II and IV. This approach allowed us to quantify differences between bands for the different core regions and differences among these zones for each band through p values. A p-value less than 0.05 indicated significantly different results.
Results
Cell Depleted Layer
To correctly normalize sRBCs’ radial position, we needed to measure the suspension core size by measuring accurately the CDL thickness (δ) for increasing pressure drops (see Figure 4A). At a given hematocrit, δ increased when pressure drops rose. Moreover, δ reached higher values for Ht1 compared to sRBC flowing at Ht2. δ had similar values when sRBC flowed in BS and BS + Dex70, but greater values when sRBC flowed in plasma (see Figure 4B).
Distribution of sRBC’s Bands Throughout the Population Core
Results of the average radial sRBC accumulation (ρl/ρ) over all pressure-drops by cross-sectional zones (see Materials and Methods, Cells channel positioning section for details) are presented in Figure 5 for band II and IV (low and high sRBC density, respectively), depending on the suspending media and hematocrit levels.
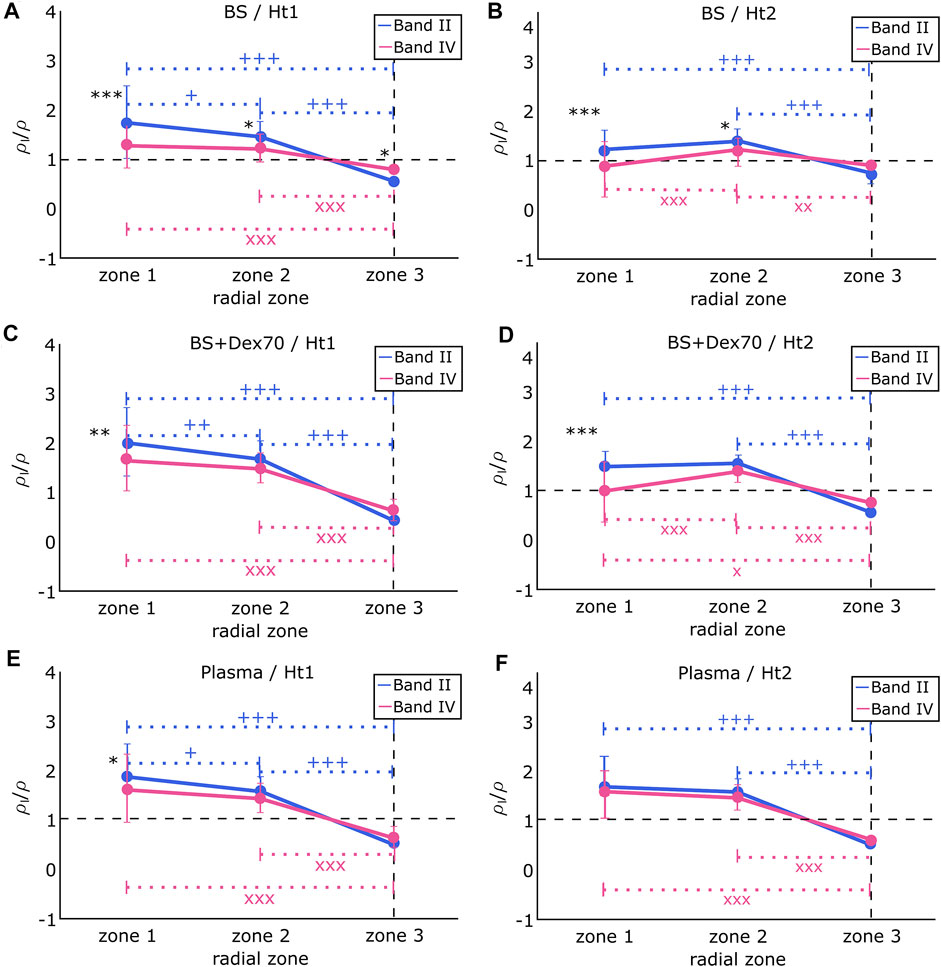
FIGURE 5. Radial sRBC accumulation (ρl/ρ) from band II and IV in (A) BS and at hematocrit Ht1. Difference between band II and band IV: *p < 0.05; ***p < 0.001. Difference between zones for band II: +p < 0.05; +++p < 0.001. Difference between zones for band IV: XXXp < 0.001. (B) BS and at hematocrit Ht2. Difference between band II and band IV: *p < 0.05; ***p < 0.001. Difference between zones for band II: +++p < 0.001. Difference between zones for band IV: XXXp < 0.001; XXp < 0.01, (C) BS + Dex70 and at hematocrit Ht1. Difference between band II and band IV: *p < 0.05. Difference between zones for band II: ++p < 0.01; +++p < 0.001. Difference between zones for band IV: XXXp < 0.001. (D) BS + Dex70 and at hematocrit Ht2. Difference between band II and band IV: ***p < 0.001. Difference between zones for band II: +++p < 0.001. Difference between zones for band IV: Xp < 0.01; XXXp < 0.001. (E) autologous plasma and at hematocrit Ht1. Difference between band II and band IV: *p < 0.05. Difference between zones for band II: +p < 0.05; +++p < 0.001. Difference between zones for band IV: XXXp < 0.001. (F) autologous plasma and at hematocrit Ht2. There is no difference between band II and band IV. Difference between zones for band II: +++p < 0.001. Difference between zones for band IV: XXXp < 0.001.
Figure 5A shows the results of sRBC flowing in BS at an average hematocrit Ht1. sRBC from band II and band IV differed in their accumulation from zones 1 to 3, with sRBC from band II being significantly more present than sRBC from band IV in zones 1 and 2, but not in the CDL where sRBC from band IV accumulated the most. On the other hand, the accumulation of sRBC from band II constantly decreased from the channel center to the CDL border, while sRBC from band IV were equally accumulated in zones 1 and 2, and only dropped down at the CDL border. Figure 5B shows the results of sRBC flowing in BS at an average hematocrit Ht2. In zones 1 and 2, sRBC from band II and band IV differed in their accumulation, with sRBC from band II being more present than sRBC from band IV in both cases. Nevertheless, in zone 3, sRBC from both bands did not significantly differ in their accumulation. sRBC from band II remained constant from zone 1 to 2, decreasing significantly from zone 2 to 3. sRBC from band IV behaved differently, with accumulation being higher in zone 2 and lower at the channel center, and in the sRBC core border zone.
The difference between BS and BS + Dex70 conditions is that sRBC aggregation was possible in the second condition, with a sRBC disaggregation threshold (i.e., sRBC aggregates robustness) measured by light scattering technique at 243 ± 90 s−1. Figure 5C shows the results of sRBC flowing in BS + Dex70 at an average hematocrit Ht1. In zone 1, sRBC from band II and band IV differ in their accumulation, with sRBC from band II being more present than sRBC from band IV. The presence of sRBC from band II constantly decreased from the channel center to the border of the sRBC core with the greater drop from zone 1 to 3. In contrast, the accumulation of sRBC from band IV did not significantly differ between zones 1 and 2 but decreased at zone 3. The accumulation of sRBC did not vary between band II and band IV in zones 2 and 3. Figure 5D shows the results of sRBC flowing in BS + Dex70 at an average hematocrit Ht2. sRBC accumulation from band II and band IV differed in zone 1 but was not different in zones 2 and 3. In zone 1, the presence of sRBC from band IV was lower compared to band II. The behavior on the accumulation of sRBC across the channel regarding each band was very different: accumulation of sRBC from band II did not differ between zones 1 and 2 and decreased in zone 3, while sRBC from band IV was not different between zones 1 and 3 and peaked in zone 2.
When sRBC flowed in their autologous plasma (Figures 4E,F), which mimic more closely the physiological conditions, the behaviors of band II and band IV were very similar. The sRBC disaggregation threshold was slightly higher than in the BS + Dex70 condition (i.e., 343 ± 160 s−1). At hematocrit Ht1, the accumulation of sRBC from band II and band IV was very close, even though the accumulation of sRBC from band II was slightly higher than sRBC belonging to band IV in zone 1. The presence of sRBC from band II constantly decreased from the channel center to the border of the CDL, with a small decrease from zone 1 to 2 compared to the higher decrease from zone 1 to 3 or zone 2 to 3. sRBC from band IV behaved similarly to sRBC from band II, except that the decrease in their accumulation between zone 1 and zone 2 did not reach statistical significance. sRBC from both bands accumulated equally in zones 2 and 3. Finally, Figure 5F shows the results of sRBC flowing in autologous plasma at an average hematocrit Ht2. The accumulation of both bands was very similar independently of the zone considered. sRBCs’ accumulation remained constant from zone 1 to 2 and decreased significantly in zone 3.
Discussion
Cell Depleted Layer Formed by sRBC
The CDL thickness was essential to investigate the segregation of sRBC as the core of sRBC was used as a limit of the relative position of the different sRBC bands. Nevertheless, it is worth comparing our results with the values already known for studies done with healthy RBC. For example, in vitro experiments have shown that aggregation increases the thickness of the CDL [37], while in vivo experiments demonstrated that the thickness remained the same with or without aggregating agents in the suspending media. Kim et al. [38] performed in vivo experiments in the rat cremaster muscle using dextran 500 to induce healthy RBC aggregation at the levels seen in the blood of healthy humans and they found no significant difference in the thickness of the CDL that remained around 3 μm in arterioles with diameters of about 50 μm, systemic hematocrit of 41–42%, and vmax around 14–11 mm/s, before and after dextran infusion. Pseudo shear rates (ranging from 100 to 600 s−1) and arterial pressure before and after infusion of dextran did not change significantly, either. The authors argued that the variations in the CDL thickness are not greatly affected by increasing sRBC aggregability, because the shear rates near the wall would be too high to allow aggregates formation. This behavior is comparable to our results, where mean shear rates varied between 100 and 500 s−1. The CDL thickness was around 2.5 μm in both hematocrit conditions, and no significant difference was noted between BS and BS + Dex70 solutions, even though hematocrit in our case was about half of the hematocrit used in Kim et al. experiments. From this difference in hematocrit, one can speculate that in our case, the CDL thickness should be greater than the value reported by Kim et al., but instead, our values were lower. This result indicates that the thickness of the CDL decreases for sRBC compared to the CDL produced with healthy RBC under similar conditions. This hypothesis needs to be tested in further experiments.
In vitro experiments performed by Maeda et al. [37] on hardened and elastic micro-vessels isolated from rabbit mesentery, showed that the thickness of the CDL decreased by increasing hematocrit for both hardened and elastic micro-vessels, which is in agreement with our results. Maeda et al. also investigated the effect of healthy RBC rigidity on CDL thickness. Results showed that CDL thickness decreased when healthy RBC were more rigid, which could mimic the condition of SCD where sRBC are poorly deformable [39]. Indeed, our findings indicates that the CDL thickness formed by sRBC may decreased compared to CDL formed by healthy RBC under similar conditions. In the same study, Maeda et al. explored the role of aggregation in the CDL formation, adding different concentrations of dextran 70 to the suspending media. Increasing dextran concentrations produced an increase of the CDL thickness, which contrasts with our finding and those of Kim et al. However, the range of velocities and, as a consequence, of shear rates, explored by Maeda et al. was lower than in our study, which could have resulted in a more significant influence of persistent sRBC aggregates on CDL thickness than in the present study.
Our results show that the effects of sRBC aggregation on the CDL thickness are different when using plasma than dextran. We have demonstrated that aggregation is more robust when sRBC are suspended in autologous plasma than in dextran 70, which could be due to the presence of plasma factors in sRBC aggregation [4] that are known to increase the strength of sRBC aggregates.
We can finally mention that any increase in the thickness of CDL could result in a reduction of vascular resistance. However, another physiological consequence would be a change in the nitric oxide (NO) scavenging effect of the sRBC core. Liao et al. [40] showed that, during flow, the scavenging of NO by healthy RBC in the vessel lumen was greatly reduced in isolated, blood-perfused arterioles, presumably because of the presence of the CDL. This is an interesting consequence that should be considered in the case of SCD, where the presence of NO could be critical in the chain of events that produces vaso-occlusion.
Segregation of sRBC Bands in Capillary Flow
SCD is described as a disorder where stiffer sRBC leads to vaso-occlusion due to capillary blockages. It is also known that in SCD, the endothelium is generally inflamed, attributed mainly to a chain of events caused by enhanced Hemolysis and the accumulation of free heme and hemoglobin into the plasma [41]. The pro-inflammatory environment and the increased sRBC adhesiveness to the endothelium contribute to SCD vasculopathy [41]. However, sRBC would need to flow close to the vascular wall to adhere to the endothelium.
Our results showed that stiffer sRBC (band IV) flowing in BS were segregated from the channel center and reached the CDL zone in the lower hematocrit condition Ht1. In contrast, more deformable sRBC (band II) remained highly accumulated in the channel center. Previous studies have already shown in silico and in vitro that increasing healthy RBC stiffness of a fraction of a full healthy RBC population diminished or eliminated the CDL, allowing stiffer healthy RBC to contact the vessel wall and deformable sRBC to concentrate in the channel center [14, 25, 42, 43]. Indeed, one could speculate that stiffer near-wall sRBC could cause collisions with endothelial cells, resulting in endothelial activation and inflammation, and/or could adhere more easily than deformable sRBC to the endothelial cells leading to vaso-occlusion. At the higher hematocrit condition Ht2, the same accumulation was observed for both bands near the CDL zone. But a higher fraction of stiffer sRBC was found between the sRBC core center and the CDL zone.
Both lighter and denser bands of labeled cells were flowed under normoxia conditions. Under this condition they had discocyte-like shape verified by observing the sickle RBC at rest under an inverted microscope before and after labeling. We could hypothesize that shape has no significant effect on the segregation reported, but on the contrary, rigidity is one of the main reasons for the segregation we had reported. We based our hypothesis on the following evidence: 1. density is known to be related to cell rigidity. From our experiments, we know that band II has lower density than band IV. From literature, band II has a mean hemoglobin content of 34.5 g/dl while band IV has a higher hemoglobin content of 38.7 g/dl [27]. Sickle red blood cells with higher mean hemoglobin content, have higher shear modulus [28], and therefore higher rigidity, and 2. evidence from previous studies, have shown that increasing red blood cell rigidity of a fraction of a full red blood cell population, allows stiffer red blood cells to contact the vessel wall and deformable cells to concentrate in the channel center [14, 25, 42, 43].
Nevertheless, when aggregation was induced, the flow behavior and the distribution of sRBC from band II and band IV were very different than the non-physiological situation where sRBC were resuspended in BS. Both deformable and stiffer sRBC (band II and IV) were equally distributed for both hematocrits near the wall and between the sRBC core center and CDL layer zone. A more pronounced difference was noted in a more physiological condition when sRBC flowed in their autologous plasma, mimicking in vivo blood conditions. In this last case, the thickness of the CDL increased, and stiffer sRBC did not segregate. Instead, they remained homogeneously distributed through the sRBC core together with the more deformable sRBC. Indeed, aggregation inhibited sRBC segregation with different intensities depending on the aggregative medium, being more pronounced when sRBC were suspended in their autologous plasma. The origin of this difference could be the stronger aggregates formed by sRBC suspended in their autologous plasma than in dextran 70.
The consequences of a spatially homogeneous versus heterogeneous distribution of sRBC of different densities/deformability in the arterioles can be different if we consider they feed the capillary bed. If a spatially segregated population of sRBC happens at the arteriole level (Figure 6A), this might lead to an enrichment of a given sRBC population (e.g., band II or IV) in the capillary branches leading to an accumulation at the outside of the capillary bed of a given population (for example band II). This is a critical point knowing that vaso-occlusion is frequently happening at the postcapillary level. We could speculate that a scenario of uniform distribution of sRBC population (Figure 6B) could not have so critical consequences, allowing a regular flow of sRBC.
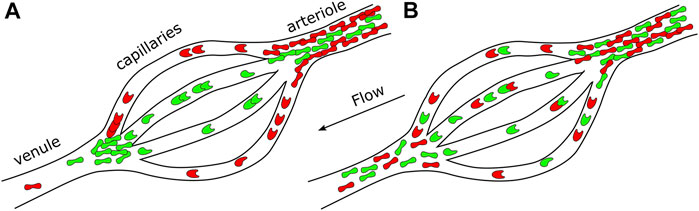
FIGURE 6. Scheme representing an arteriole, capillaries, and a venule. Possible consequences on the capillaries bed and venule feeding in both (A) heterogeneous sRBC distribution and (B) homogeneous sRBC distribution at the arteriole level.
Results on segregation of sickle red blood cells are comparable by themselves, since our control was the case of cells flowing in a media without proteins or other type of particles that induce aggregation among sickle red blood cells versus a more physiological scenario of cells flowing in its own plasma, where the behavior, as reported, was significantly different from control. Further exploring RBCs segregation in a mixture of sickle and normal RBCs may be relevant to transfused patients in sickle cell amenia.
Finally, we could highlight that we only investigated the behavior of sRBC in flow in this study. But other blood cells like white blood cells can also have an important role regarding vaso-occlusive events because of their high ability to adhere to endothelial cells. Healthy RBC axial migration influences the positioning of white cells and platelets with respect to the vascular wall [8–12, 44–46]. In healthy conditions, the margination of white cells and platelets has physiological importance as these cells need to be near the vessel walls to deal with inflammation and hemostasis [11, 12]. But in the case of SCD, sRBC Hemolysis triggers an inflammatory response in the blood vessels, leading to white blood cells recruitment to endothelial cells and platelet activation and adhesion or shear-induced platelet aggregation, depending on the flow conditions, which can lead to vaso-occlusive events. Healthy RBC aggregation has been found to cause a further elevation in the flux of marginated white cells, promoting margination even at low hematocrits [44], which could be critical for vaso-occlusive scenarios in SCD.
Conclusion
We have investigated segregation among low- and high-density sRBC populations flowing through cylindrical microchannels, and the impact of aggregation, hematocrit level, and velocities in their segregation. Our results showed a heterogeneous distribution of sRBC according to their density in a medium without elements inducing sRBC aggregation: low-density population remained closer to the center of the channel, while the densest sRBC segregated towards the walls. This segregation heterogeneity could influence the ability of sRBC to adhere to the vascular wall and slow down blood flow. However, promoting aggregation with dextran, and more particularly with autologous plasma, inhibited segregation. Our results highlight the natural protection aggregation promotes against such phenomenon but concomitantly, how any disturbances of aggregation could be deleterious. Regarding the clinical importance of this study, future experiments may elucidate the importance of the homogeneous or heterogeneous distribution of sRBC in arterioles and its consequences in the capillary bed and postcapillaries sRBC distribution and behavior. It is in this last place where vaso-occlusion occurs more frequently. Then, the history in the distribution of sRBC before arriving at this zone may have critical consequences in the sRBC behavior at this part of the microcirculatory system in patients with SCD and must be considered.
Data Availability Statement
The original contributions presented in the study are included in the article, further inquiries can be directed to the corresponding author.
Ethics Statement
The studies involving human participants were reviewed and approved by Hospices Civils de Lyon–CPP Est Ethics Committee (L14-127). The patients/participants provided their written informed consent to participate in this study.
Author Contributions
VC, PC, and MA designed research; VC carried out the experiments and data analysis with support from LL; VC, PC, and MA wrote the manuscript with support from LL and CW; CR, PJ, RF, and AG, coordinated blood samples withdrawal from patients. All authors carefully read and reviewed the article.
Funding
We would like to thank Labex Numev (Convention Grant No. ANR-10-LABX-20, Rheoblood project) as well as the Idex MUSE (Convention Grant No. ANR-16-IDEX-0006, Globule project).
Conflict of Interest
The authors declare that the research was conducted in the absence of any commercial or financial relationships that could be construed as a potential conflict of interest.
Publisher’s Note
All claims expressed in this article are solely those of the authors and do not necessarily represent those of their affiliated organizations, or those of the publisher, the editors and the reviewers. Any product that may be evaluated in this article, or claim that may be made by its manufacturer, is not guaranteed or endorsed by the publisher.
References
1. Russell EW, Montalembert M, Tshilolo L. Sickle Cell Disease. The Lancet (2017) 390:311–23. doi:10.1016/S0140-6736(17)30193-9
2. Nash G, Johnson C, Meiselman H. Mechanical Properties of Oxygenated Red Blood Cells in Sickle Cell (HbSS) Disease. Blood (1984) 63(1):73–82. doi:10.1182/blood.v63.1.73.bloodjournal63173
3. Kaul D, Chen D, Zhan J. Adhesion of Sickle Cells to Vascular Endothelium Is Critically Dependent on Changes in Density and Shape of the Cells. Blood (1994) 83(10):3006–17. doi:10.1182/blood.v83.10.3006.3006
4. Mohandas N, Evans E. Sickle Erythrocyte Adherence to Vascular endothelium.Morphologic Correlates and the Requirement for Divalent Cations and Collagen Binding Plasma Proteins. J Clin Invest (1985) 76(4):1605–12.
5. Ballas SK. Sickle Cell Disease: Classification of Clinical Complications and Approaches to Preventive and Therapeutic Management. Clin Hemorheol Microcirc (2018) 68(2-3):105–28. doi:10.3233/CH-189002
6. Baudin V, Pagnier J, Labie D, Girot R, Wajcman H. Heterogeneity of Sickle Cell Disease as Shown by Density Profiles: Effects of Fetal Hemoglobin and Alpha Thalassemia. Haematologia (Budap) (1986) 19(3):177–84.
7. Alapan Y, Little JA, Gurkan UA. Heterogeneous Red Blood Cell Adhesion and Deformability in Sickle Cell Disease. Sci Rep (1985) 76(4):1605–12.
8. Goldsmith HL, Cokelet GR, Gaehtgens P, Fahraeus R. Robin Fåhraeus: Evolution of His Concepts in Cardiovascular Physiology. Am J Physiol (1989) 257(3 Pt 2):H1005–15. doi:10.1152/ajpheart.1989.257.3.H1005
9. Pries AR, Secomb TW, Gaehtgens P. Biophysical Aspects of Blood Flow in the Microvasculature. Cardiovasc Res (1996) 32(4):654–67. doi:10.1016/s0008-6363(96)00065-x
10. Fedosov DA, Gompper G. White Blood Cell Margination in Microcirculation. Soft Matter (2014) 10:2961–70. doi:10.1039/c3sm52860j
11. Tangelder GJ, Teirlinck HC, Slaaf DW, Reneman RS. Distribution of Blood Platelets Flowing in Arterioles. Am J Physiol (1985) 248(3 Pt 2):H318–23. doi:10.1152/ajpheart.1985.248.3.H318
12. Firrell JC, Lipowsky HH. Leukocyte Margination and Deformation in Mesenteric Venules of Rat. Am J Physiol (1989) 256(6 Pt 2):H1667–74. doi:10.1152/ajpheart.1989.256.6.H1667
13. Graham M. Chapter 3 Blood as a Suspension of Deformable Particles. In: Dynamics of Blood Cell Suspensions in Microflows. Florida, US: CRC Press, Taylor and Francis Group (2019). p. 76–98.
14. Kumar A, Graham MD. Segregation by Membrane Rigidity in Flowing Binary Suspensions of Elastic Capsules. Phys Rev E Stat Nonlin Soft Matter Phys (2011) 84:066316. doi:10.1103/PhysRevE.84.066316
15. Kumar A, Henríquez Rivera RG, Graham MD. Flow-induced Segregation in Confined Multicomponent Suspensions: Effects of Particle Size and Rigidity. J Fluid Mech (2014) 738:423–62. doi:10.1017/jfm.2013.592
16. Rafael G, Henríquez R, Sinha K, Graham MD. Margination Regimes and Drainage Transition in Confined Multicomponent Suspensions. Phys Rev Lett (2015) 114:188101. doi:10.1103/physrevlett.114.188101
17. Kumar A, Graham MD. Mechanism of Margination in Confined Flows of Blood and Other Multicomponent Suspensions. Phys Rev Lett (2012) 109:108102. doi:10.1103/PhysRevLett.109.108102
18. Sinha K, Graham MD. Shape-mediated Margination and Demargination in Flowing Multicomponent Suspensions of Deformable Capsules. Soft Matter (2016) 12:1683–700. doi:10.1039/c5sm02196k
19. Young KD. The Selective Value of Bacterial Shape. Microbiol Mol Biol Rev (2006) 70(3):660–703. doi:10.1128/mmbr.00001-06
20. Geng Y, Dalhaimer P, Cai S, Tsai R, Tewari M, Minko T, et al. Shape Effects of Filaments versus Spherical Particles in Flow and Drug Delivery. Nat Nanotech (2007) 2(4):249–55. doi:10.1038/nnano.2007.70
21. Zhao H, Shaqfeh ESG, Narsimhan V. Shear-induced Particle Migration and Margination in a Cellular Suspension. Phys Fluids (2012) 24:011902. doi:10.1063/1.3677935
22. Qi Q, Shaqfeh E. Time-dependent Particle Migration and Margination in the Pressure-Driven Channel Flow of Blood. Phys Rev Fluids (2018) 3:034302. doi:10.1103/physrevfluids.3.034302
23. Bognet B, Cowles D, Ma A, Carboni EK. The Margination of Particles in Areas of Constricted Blood Flow. Biophys J (2018) 114(9):2221–30. doi:10.1016/j.bpj.2018.04.010
24. Qi Q, Shaqfeh E. Theory to Predict Particle Migration and Margination in the Pressure-Driven Channel Flow of Blood. Phys Rev Fluids (2017) 2:093102. doi:10.1103/physrevfluids.2.093102
25. Zhang X, Caruso C, Lam WA, Graham MD, Graham M. Flow-induced Segregation and Dynamics of Red Blood Cells in Sickle Cell Disease. Phys Rev Fluids (2020) 5:053101. doi:10.1103/physrevfluids.5.053101
27. Corbett JD, Mickols WE, Maestre MF. Effect of Hemoglobin Concentration on Nucleation and Polymer Formation in Sickle Red Blood Cells. J Biol Chem (1995) 270(6):2708–15.
28. Evans E, Mohandas N, Leung A. Static and Dynamic Rigidities of normal and Sickle Erythrocytes. Major Influence of Cell Hemoglobin Concentration. J Clin Invest (1984) 73(2):477–88. doi:10.1172/jci111234
30. Steffen P, Verdier C, Wagner C. Quantification of Depletion-Induced Adhesion of Red Blood Cells. Phys Rev Lett (2013) 110(1):018102. doi:10.1103/PhysRevLett.110.018102
31. Hardeman MR, Dobbe JG, Ince C. The Laser-Assisted Optical Rotational Cell Analyzer (LORCA) as Red Blood Cell Aggregometer. Clin Hemorheol Microcirc (2001) 25(1):1–11.
32. Peltomäki M, Gompper G. Sedimentation of Single Red Blood Cells. Soft Matter (2013) 9:8346. doi:10.1039/c3sm50592h
33. Thielicke W, Stamhuis EJ. PIVlab – towards User-Friendly, Affordable and Accurate Digital Particle Image Velocimetry in MATLAB. J Open Res Softw (2014) 2:e30. doi:10.5334/jors.bl
34. Diez-Silva M, Dao M, Han J, Lim CT, Suresh S. Shape and Biomechanical Characteristics of Human Red Blood Cells in Health and Disease. MRS Bull (2010) 35(05):382–8. doi:10.1557/mrs2010.571
35. Fung YC. Biomechanics, Mechanical Properties of Living Tissues. NY, USA: Springer-Verlag (1993).
36. Evans E, Fung Y-C. Improved Measurements of the Erythrocyte Geometry. Microvasc Res (1972) 4(4):335–47. doi:10.1016/0026-2862(72)90069-6
37. Maeda N, Suzuki Y, Tanaka J, Tateishi N. Erythrocyte Flow and Elasticity of Microvessels Evaluated by Marginal Cell-free Layer and Flow Resistance. Am J Physiology-Heart Circulatory Physiol (1996) 271(6):H2454–H2461. doi:10.1152/ajpheart.1996.271.6.h2454
38. Kim S, Kong RL, Popel AS, Intaglietta M, Johnson PC. Temporal and Spatial Variations of Cell-free Layer Width in Arterioles. Am J Physiology-Heart Circulatory Physiol (2007) 293(3):H1526–H1535. doi:10.1152/ajpheart.01090.2006
39. Connes P, Renoux C, Romana M, Abkarian M, Joly P, Martin C, et al. Blood Rheological Abnormalities in Sickle Cell Anemia. Ch (2018) 68:165–72. doi:10.3233/ch-189005
40. Liao JC, W. Hein T, Vaughn MW, Huang K-T, Kuo L. Intravascular Flow Decreases Erythrocyte Consumption of Nitric Oxide. Proc Natl Acad Sci (1999) 96(15):8757–61. doi:10.1073/pnas.96.15.8757
41. Nader E, Romana M, Connes P. The Red Blood Cell-Inflammation Vicious Circle in Sickle Cell Disease. Front Immunol (2020) 11:454. doi:10.3389/fimmu.2020.00454
42. Ahmed F, Mehrabadi M, Liu Z, Barabino GA, Aidun CK. Internal Viscosity-dependent Margination of Red Blood Cells in Microfluidic Channels. J Biomech Eng (2018) 140(6). doi:10.1115/1.4039897
43. Caruso C, Zhang X, Sakurai Y, Li W, Fay ME, Carden MA, et al. Stiff Erythrocyte Subpopulations Biomechanically Induce Endothelial Inflammation in Sickle Cell Disease. Blood (2019) 134:3560. doi:10.1182/blood-2019-125408
44. Abbitt KB, Nash GB. Rheological Properties of the Blood Influencing Selectin-Mediated Adhesion of Flowing Leukocytes. Am J Physiology-Heart Circulatory Physiol (2003) 285:H229–H240. doi:10.1152/ajpheart.00408.2002
45. Goldsmith HL, Spain S. Margination of Leukocytes in Blood Flow through Small Tubes. Microvasc Res (1984) 27:204–22. doi:10.1016/0026-2862(84)90054-2
46. Nobis U, Pries AR, Cokelet GR, Gaehtgens P. Radial Distribution of white Cells during Blood Flow in Small Tubes. Microvasc Res (1985) 29:295–304. doi:10.1016/0026-2862(85)90020-2
Keywords: sickle cell anemia, red blood cells, segregation, red blood cell density, microfluidics
Citation: Clavería V, Connes P, Lanotte L, Renoux C, Joly P, Fort R, Gauthier A, Wagner C and Abkarian M (2021) In Vitro Red Blood Cell Segregation in Sickle Cell Anemia. Front. Phys. 9:737739. doi: 10.3389/fphy.2021.737739
Received: 07 July 2021; Accepted: 11 November 2021;
Published: 02 December 2021.
Edited by:
Annie Viallat, UMR7325 Centre Interdisciplinaire de Nanoscience de Marseille (CINaM), FranceReviewed by:
Aurora Hernandez-Machado, University of Barcelona, SpainAndrej Vilfan, Max Planck Society (MPG), Germany
Wassim El Nemer, French Blood Establishment (EFS), France
Copyright © 2021 Clavería, Connes, Lanotte, Renoux, Joly, Fort, Gauthier, Wagner and Abkarian. This is an open-access article distributed under the terms of the Creative Commons Attribution License (CC BY). The use, distribution or reproduction in other forums is permitted, provided the original author(s) and the copyright owner(s) are credited and that the original publication in this journal is cited, in accordance with accepted academic practice. No use, distribution or reproduction is permitted which does not comply with these terms.
*Correspondence: Manouk Abkarian, bWFub3VrLmFia2FyaWFuQHVtb250cGVsbGllci5mcg==