 Jieming Chou
 Yuan Xu
 Wenjie Dong3,2
 Weixing Zhao
 Yuanmeng Li
95% of researchers rate our articles as excellent or good
Learn more about the work of our research integrity team to safeguard the quality of each article we publish.
Find out more
ORIGINAL RESEARCH article
Front. Phys. , 17 August 2021
Sec. Interdisciplinary Physics
Volume 9 - 2021 | https://doi.org/10.3389/fphy.2021.723306
This article is part of the Research Topic Impacts of Global Warming on Ecology and Meteorology and the Related Physical Mechanisms, Evaluation and Prediction View all 18 articles
Quantitatively projecting the impact of future climate change on the socio-economy and exploring its internal mechanism are of great practical significance to adapt to climate change and prevent climate risks. Based on the economy-climate (C-D-C) model, this paper introduces a yield impact of climate change (YICC) model that can quantitatively project the climate change impact. The model is based on the YICC as its core concept and uses the impact ratio of climate change (IRCC) indicator to assess the response of the economic system to climate change over a long period of time. The YICC is defined as the difference between the economic output under changing climate condition and that under assumed invariant climate condition. The IRCC not only reflects the sensitivity of economic output to climate change but also reveals the mechanism of the nonlinear interaction between climate change and non-climatic factors on the socio-economic system. Using the main grain-producing areas in China as a case study, we use the data of the ensemble average of 5 GCMs in CMIP6 to project the possible impact of climate change on grain production in the next 15–30 years under three future scenarios (SSP1-2.6, SSP2-4.5, SSP5-8.5). The results indicate that the long-term climate change in the future will have a restraining effect on production in North region and enhance production in South region. From 2021 to 2035, climate change will reduce production by 0.60–2.09% in North region, and increase production by 1.80–9.01% in South region under three future scenarios. From 2021 to 2050, compared with the climate change impact in 2021–2035, the negative impact of climate change on production in North region will weaken, and the positive impact on production in South region will enhance with the increase in emission concentration. Among them, climate change will reduce grain output in North region by 0.52–1.99%, and increase output in South region by 1.35–9.56% under the three future scenarios. The combination of economic results and climate change research is expected to provide scientific support for further revealing the economic mechanism of climate change impacts.
The impact of climate change on the social economy is an important field and a main link in research on climate change impacts. The sustainable development of human society and the economy has been severely affected by climate change, and this phenomenon will continue. From the Chinese region at the small scale to the global region at the large scale, climate not only has the characteristics of drastic seasonal and interannual changes at the short time scale [1–3] but also has obvious interdecadal changes at the long time scale [4,5]. Climate change not only indirectly affects the economic system through direct impacts on water resources, ecosystems, and land surface conditions but also increases the negative effects of meteorological disasters caused by extreme events on the economic system [6]. The risk climate change poses for the economic system is expected to increase with global warming at 1.5°C and further increase with warming at 2°C [1]. How humans respond and adapt to climate change is an issue of combining natural science with socioeconomic applications. It is necessary to link the results of climate change with economic theories to conduct multidisciplinary studies on the impact of future climate change [7,8]. Therefore, exploring a quantitative method for projecting the impact of future climate change on the economic system is of great significance to the prevention of climate change risks.
In the future, the impact of climate change on the socioeconomic system may become greater under different greenhouse gas emission scenarios [3]. At present, there are many methods used to study the economic impact of climate change in China and abroad, which mainly include non-model methods and model-based methods. Non-model methods include statistical regression [9,10], historical experience comparison [11], questionnaire survey [12], literature review [13], and meteorological output methods [14]. However, most statistical regression methods have the disadvantages of ignoring the long-term trend climatic changes and the nonlinear interaction between climate change and the economy. The other methods are subjective and uncertain. The model methods include empirical statistical models [15], natural mechanism models [16,17], and economic mechanism models, which are currently common methods for studying the impact of future climate change. Among them, the natural mechanism model based on crop models is a purely natural experimental research method, which requires a solid experimental observation basis and generally does not involve socioeconomic factors. Economic mechanism models quantitatively assess the impact of climate change on different economic systems from an economic perspective, including the Ricardian model [18–20], computable general equilibrium (CGE) model [21,22], and economy-climate (C-D-C) model [23,24]. Among them, the C-D-C model can integrate climatic and economic factors and deal with the climatic factor parameters on the average climate state, taking into account the long-term trend of climatic factors. In addition, the model is relatively simple, with convenient data acquisition and easy operation. Therefore, we select the economy-climate model to develop a model that can project the impact of future climate change on the economic system on a long-term scale.
The C-D-C model is mainly applicable for evaluating the impact of climate change on economic output by the incorporation of climatic and socioeconomic factors. Essentially, it does not focus on the natural science of climate change itself but uses climate change as an economic factor to analyze its contribution to economic development. Its effectiveness has been tested mostly on wheat, maize, and rice in China’s grain-producing areas [25,26]. The climate change impact assessment part of the model focuses on analyzing the impact of climate change on economic output based on the output elasticity of climatic factors. In recent years, studies have used the C-D-C model to analyze the effects of temperature and precipitation changes on the rice yield in different regions [27,28], initially developed the concept and method of “the yield impact of climate change” [24], and assessed the regional sensitivity of crop yields to changes in comprehensive climate factors [26]. The persistent improvement in the simulation capabilities of climatic models and the continuous emergence of future prediction data of CMIP6 have enabled the use of the C-D-C model, and prediction data have made it possible to quantitatively predict the impact of future climate change.
Based on the above, this study aims to further introduce and popularize the yield impact of the climate change (YICC) model to explore the impact of future climate change on economic output. In addition, it carries out a case study on the model in the North and South regions of China’s main grain-producing areas. In other words, this study’s objective is to derive a YICC model based on the C-D-C model, use the impact ratio of the climate change index to project the impact of future climate change on economic output, and apply it to China’s main grain-producing areas. As critical areas in China, the main grain-producing areas are a breadbasket but also areas vulnerable to climate change. Among them, the North region presents a warm, dry trend with increasing temperature and decreasing precipitation, while the South region presents a warm-humidification trend with increasing temperature and precipitation [29]. This uneven and obvious trend of climate change inevitably affects agricultural production and economic development. The goal is therefore to use the findings to inform and support policies towards preventing the risk climate change poses to crops and improving the sustainable development of the agricultural economy. The section that follows discusses the methods and case study.
The economic system is a complex system, an organic combination of the relationships among economic elements [24]. Economic output is subject to the combined influence of socio-economic and climatic factors. Climate change impacts are a complex nonlinear system that is subject to the interaction of many factors, and it is necessary to integrate economics and climatology for cross-disciplinary study [30,31]. In addition, climate change has economic characteristics. First, climate change is an exogenous factor and has external effects. As a public natural resource, climate change is regarded as a public good in the field of economics and is not controlled by any individual or state. Therefore, it has randomness and uncertainty. Climate change, characterized by rising global temperatures, is mainly caused by excessive emissions of greenhouse gases in certain countries, and its impacts not only involve the emitting regions but also spread across borders to other countries and regions [32]. Climate change has no borders. Second, climate resources are not restricted by national boundaries, so they are shared natural resources. They do not require investment or payment of any usage fees and entail no cost and profit calculations. Third, economic growth is mainly caused by external environmental factors and internal economic activities. As one of the external factors, climate change needs to be combined with economic activity factors to take effect. Evaluation of the economic impact of climate change does not focus on the natural science of climate change itself but uses climate change as an economic factor to analyze its contribution to or impact on economic development, that is, to analyze the economic impact of climate change from a socio-economic perspective [30]. Climate change has these economic characteristics that are basically consistent with economic growth. Scholars have used “climate change” as an economic input factor to construct an economy-climate (C-D-C) model to evaluate the impact of climate change on economic growth [23].
The Cobb-Douglas production function model (C-D model) is a classic mathematical model in the field of economics. It is easy to operate and widely used and has the advantages of convenient parameter retrieval in modeling [33]. The C-D-C model is based on the C-D production function model and adds climatic factors to construct an econometric model to evaluate the impact of climate change on the economic system [23]. In addition, with this study, we introduce into the model the comprehensive climate factor (CCF), a new factor constructed in previous studies, and analyze the economic impact of changes in the comprehensive climate factor on the yields of different crops in China’s main grain-producing areas over the past 35 years (1981–2015) [5]; [26]. The C-D-C model represents the functional relationship between the number of input factors and the economic output in the production process over a long period of time (more than 10 years), and its formula is shown in Eq. 1. where Y is the economic output,
A. The dimension of variables does not need to be considered in modeling, and the function formula can be logarithmically linearized into Eq. 2, which is easier to process and calculate.
B. Both short time scale meteorological factors and long time scale climatic factors can be added as input factors.
C. The comprehensive climate factor is a combination of a variety of climate factors (such as temperature, precipitation, sunshine hours), reflecting the main change trend of a variety of climatic factors, and its formula is shown in Eq. 3, where n represents the number of climate factor variables,
D. The model expresses the relationship between economic output and its influencing factors in the form of an exponential product, reflecting the nonlinear interaction between economic and climatic factors in the production process.
E. Output elasticity is an economic concept. It reveals the change rate of economic output caused by the change rate of an input factor under the condition that other input factors remain unchanged. The sensitivity to changes in the input factors can also simply distinguish the influence of climatic and economic factors on economic output. For example, the output elasticity corresponding to the climate change factor is γ, which means that under the condition that non-climatic factors remain unchanged, every 1% increase in climatic factors increases economic output by γ%.
When assessing the impact of climate change on economic output, we mainly use climatic output elasticity as the evaluation index to focus on the analysis of the impact of changes in climatic factor C, and use the output elasticity of climate change factors to reflect the contribution of climate change to economic output. The model schematic diagram is shown in Figure 1, which mainly includes three parts. The first part is the selection of indicators, including input and output factors. The input factors are composed of climatic and non-climatic factors. The second part is the construction of the model. The selected indicators are introduced into the model for calculation and simulation to obtain the output elasticity corresponding to the climatic factor. The third part is the impact assessment, which analyzes the impact of climate change on economic output by the output elasticity of the climatic factors.
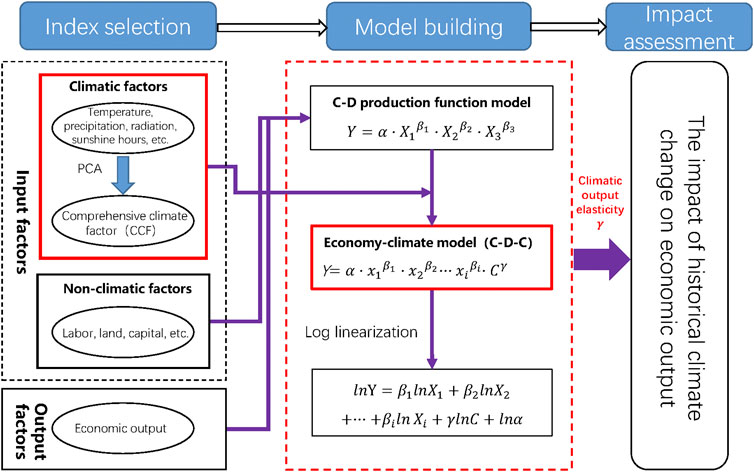
FIGURE 1. Schematic diagram of the economy-climate (C-D-C) model. Y is an economic output, xi is an economic factor (i≥3), βi is an output elasticity corresponding to the economic factor, C is a climatic factor, γ is an output elasticity corresponding to climatic factor (called “climatic output elasticity”), α represents the sum of the influence of factors other than economic and climatic factors.
From Equations 1–2, it can be seen that as long as the economic data and climate change data are obtained, the output elasticity of each input element can be calculated. Historical economic data can be obtained through the National Bureau of Statistics and the Statistical Yearbook in China. Historical and future climatic data can be obtained not only through observational data from the National Meteorological Administration in China but also through simulations using different climate models in the international CMIP6 experiment. However, due to the randomness and uncertainty of the economic development laws of the country and society, it is difficult to obtain future economic data. Therefore, the C-D-C model has been widely used to assess the impact of historical climate change on food production [26–28]. To solve the difficulty of predicting the impact of future climate change, it is necessary to further explore a new method based on the C-D-C model.
Global climate change has significant interdecadal characteristics, and there are multiple time-scale changes in China [4]. Climate has its own changing trend on the interdecadal time scale, which affects the economic system. As the output of the production system, economic output is the result of the nonlinear interaction between socio-economic factors and natural factors rather than the linear superposition of their individual effects. To distinguish the impact of climate change on economic output under nonlinear conditions and to compensate for the limitations of the C-D-C model in predicting the impact of future climate change, we introduce a method for projecting the impact of climate change—the yield impact of climate change (YICC) model.
The yield impact of climate change is different from the meteorological yield, which linearly decomposes crop yield into three parts: technical yield, meteorological yield and random yield. However, it does not consider the long-term trend of climatic factors and the changes in yield caused by factors such as crop sown area [14,34]. On decadal or even longer time scales (decades or even hundreds of years), the climate has a changing trend. Therefore, in the process of studying the impact of future climate change, long-term climate change cannot be ignored and must be considered.
The variation in economic output not only depends on the input of production factors but is also affected by many factors, such as the scientific level, technological progress, policies, and the natural environment. It is the result of the combined effects of various factors. Therefore, under the comprehensive effects of climatic and economic factors, the following method quantitatively distinguishes the effects caused by climatic factors.
After n years (the first n years,
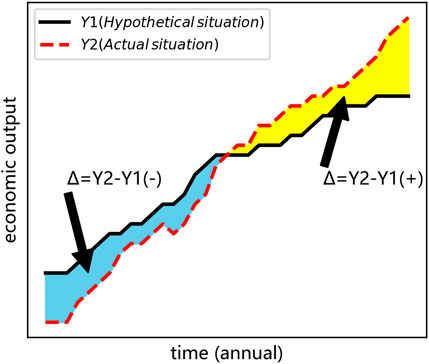
FIGURE 2. Schematic diagram of the yield impact of climate change. Y1 is the economic growth state (idealized state) when the climate does not change, and Y2 is the actual state of future economic growth. ∆ represents the impact of climate change on economic output, that is, the difference between Y2 and Y1. (−) indicates that the impact of climate change is negative, (+) indicates that the impact of climate change is positive.
Over time, climatic factors and nonclimatic factors change, so the actual economic outputs are the result of the comprehensive effect of these two changes. The C-D-C model reflects this situation. In the YICC,
A. Assume that the mean states of economic output, nonclimatic and climatic factors are
B. Assuming that the climatic state does not undergone continuous changes during the next n years (still
C. Assuming that the climatic and economic states in the next n years (n + 1, n + 2..., 2n) will undergone continuous changes, then the mean states of economic output, nonclimatic factors and climatic factors are
D. Since statistical data on the future economy are not available, the climatic output elasticity
Finally, we define the difference (∆Y) between
The yield impact of climate change (∆Y) is mainly determined by the future economic output (
The impact ratio of climate change is a benefit indicator that measures the impact of climate change on economic output and reflects the weight of the impact of climate factors on actual economic output. From an economic point of view, the greater the ratio is, the greater the proportion of the yield impact of climate change, in other words, the greater the impact of climate change on economic output. If the ratio is positive, it means that climate change has a positive effect on economic output. If the impact ratio of climate change is negative, it means that climate change has a negative impact on economic output. In addition, the forecast of the IRCC reflects that future economic output is the result of the nonlinear interaction of climatic factors and nonclimatic factors. We apply the IRCC model to the main grain-producing areas in China to project the impact of climate change on grain production in the next 15–30 years. The framework diagram of the economy-climate model is shown in Figure 3.
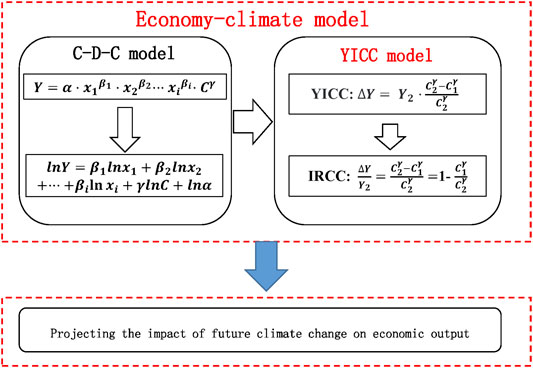
FIGURE 3. A framework diagram of the economy-climate model for predicting the yield impact of climate change. Y is an economic output, xi is an economic factor (i≥3), βi is an output elasticity corresponding to the economic factor, C is a climatic factor, γ is an output elasticity corresponding to climatic factor (called “climatic output elasticity”), α represents the sum of the influence of factors other than economic and climatic factors. ΔY/Y2 is the impact ratio of climate change (IRCC).
The main grain-producing areas are important bases for grain production and an important contribution to food security. A total of 72.2% of the country’s mean annual grain production comes from 13 main grain-producing areas in China (Figure 4), and their mean annual grain production concentration from 1981 to 2015 totaled 73.8% [29]. According to previous studies, the main grain-producing areas can be divided into the North and South regions [26]. The North region includes Heilongjiang (HeiLJ), Jilin (JiL), Liaoning (LiaoN), Hebei (HeB), Shandong (ShanD), and Henan (HeN) Provinces. The South region includes Anhui (AnH), Jiangsu (JiangS), Jiangxi (JiangX), Hubei (HuB), Hunan (HuN), Guangdong (GuangD), and Sichuan (SiC) Provinces.
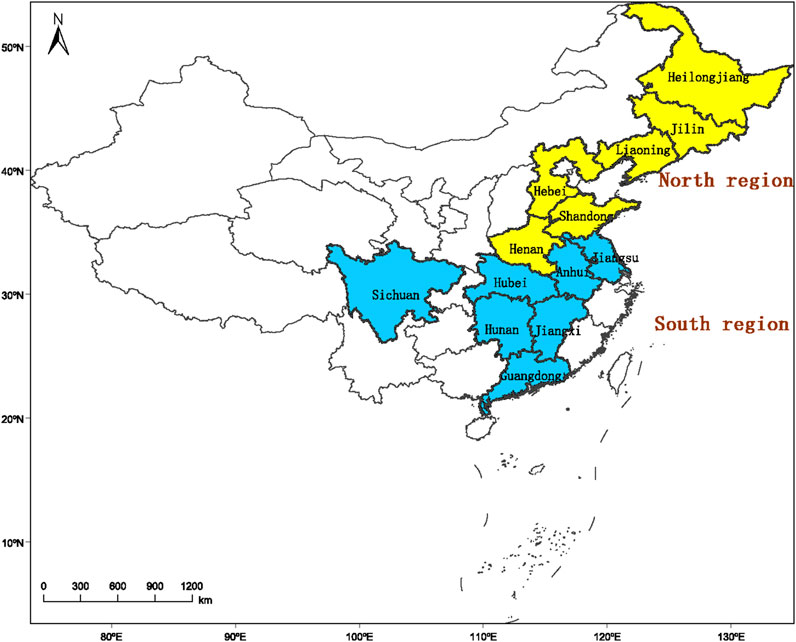
FIGURE 4. The main grain-producing areas in China. The yellow area presents the North region, and the blue area shows the South region.
The climate model data include historical data and future scenario data of average temperature (unit: K), precipitation (unit: mm), surface downward shortwave radiation flux (unit: w/m2) and CO2 concentration (unit: mol/mol), which are derived from five global climate models tested in Coupled Model Intercomparison Project Phase 6 (CMIP6) (https://esgf-node.llnl.gov/search/cmip6/). The historical period is from April to September in 1981–2014, and the future period is from April to September in 2021–2050. The basic information of the five global climate model data is shown in Table 1. The future scenario data are predicted data under three different shared socio-economic paths (SSP1-2.6, SSP2-4.5, SSP5-8.5). The SSP-RCP scenario is an SSP scenario constructed based on the RCP scenario. This comprehensive scenario can better analyze the links and impacts of climate change and the social economy [35]. Among them, SSP1-RCP2.6 (SSP1-2.6) is the scenario with the lowest greenhouse gas emissions under sustainable development conditions. SSP2-RCP4.5 (SSP2-4.5) is described as a scenario with moderate greenhouse gas emissions under moderate development conditions. SSP5-RCP8.5 (SSP5-8.5) is described as the scenario with the highest greenhouse gas emissions under conventional development conditions. Since the resolution of each model is different, we need to first interpolate the model data to a grid station with a resolution of 0.5˚ × 0.5˚ through the bilinear interpolation method. Multi-model ensemble average (MME) is the equal-weight arithmetic average of multi-model simulation results. The climatic index (C) selected in this study is the comprehensive climate factor (CCF). It is constructed by the principal component analysis method from the average temperature, precipitation, radiation flux, and CO2 concentration. The method description is shown in a previous study by Chou et al. [5].
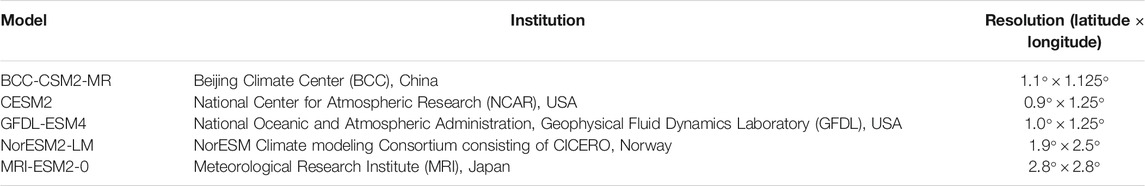
TABLE 1. Information regarding five CMIP6 climate models used in this study.
The economic indices include the number of rural employed persons (unit: 10,000 persons), sown area of grain crops (unit: 1,000 ha), total power of agricultural machinery (unit: 10,000 kW), volume of effective component of chemical fertilizer (unit: 10,000 tons) and areas covered by natural disasters (unit: 1,000 ha). The economic output index is the output of grain crops (unit: 10,000 tons). The economic data come from the National Bureau of Statistics (http://www.bjstats.gov.cn) and the “Statistical Yearbook” of the provinces from 1981 to 2015. Since economic data are statistical data and cannot be used directly, they need to be preprocessed to enhance the credibility, rationality and consistency of the variable data used in the modeling. Both climatic data and economic data were preprocessed by the administrative area weight method and the three-point moving average method. The processed data can be found in Supplementary Tables 1–4.
In the past 34 years (1981–2014), the interdecadal variation in total grain production in the North region has shown a clear increasing trend, while the interdecadal variation in production in the South region has shown a decreasing trend (Figure 5A). In particular, the total grain production in the North region has increased at a faster rate, reaching 9,669,300 tons/(10a). There have been obvious interdecadal differences in the grain production level of each province over the past 34 years (Figure 5B). In the North region, the total grain production of Heilongjiang and Henan Provinces has increased rapidly. In the South region, the production of Anhui Province has increased rapidly, but the interdecadal changes in the production of Guangdong and Sichuan Provinces have shown a downward trend.
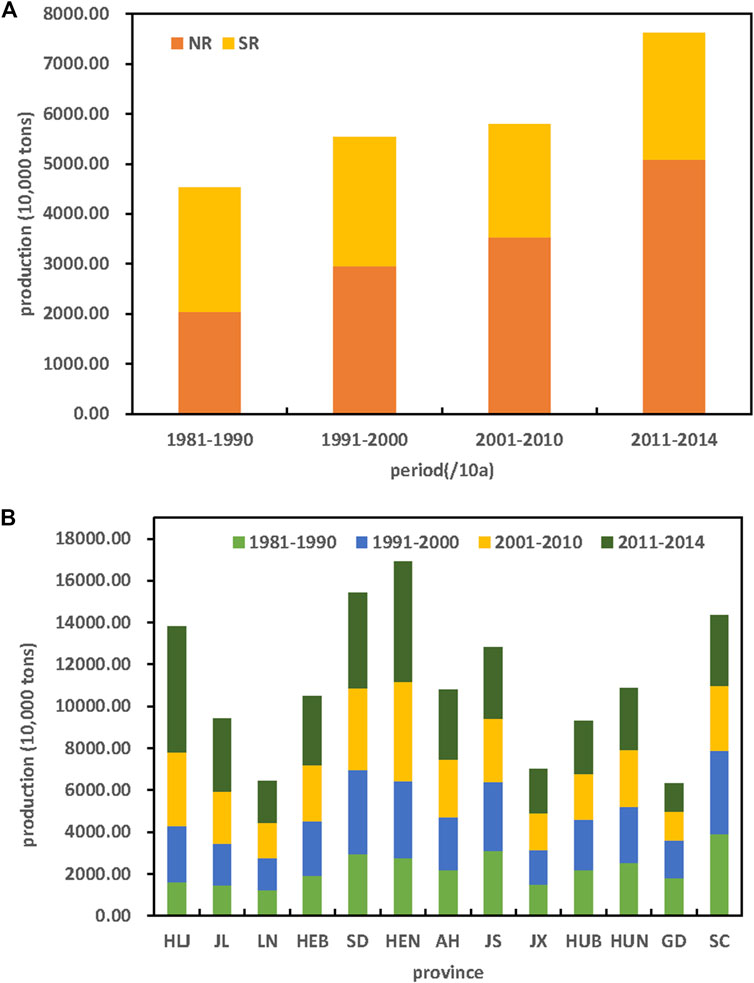
FIGURE 5. The interdecadal changes in the grain production in the China’s main grain-producing areas. (A), the interdecadal grain production changes in the North and South regions from 1981 to 2014. (B), the interdecadal changes in grain production in 13 provinces from 1981 to 2014, the first six provinces belong to the North region, and the last seven provinces belong to the South region. The North region (NR) includes Heilongjiang (HeiLJ), Jilin (JiL), Liaoning (LiaoN), Hebei (HeB), Shandong (ShanD) and Henan (HeN) Provinces. The South region (SR) includes Anhui (AnH), Jiangsu (JiangS), Jiangxi (JiangX), Hubei (HuB), Hunan (HuN), Guangdong (GuangD) and Sichuan (SiC) Provinces.
Temperature, sunshine, and water are the most direct natural conditions for crops, and they are also important natural factors that affect crop production and sustainable development. In our previous research, we have found that changes in the climate elements in various provinces show complex, varying and regional characteristics of cold-warm and dry-wet cycles [29]. Different climatic conditions and regions have various possible impacts on grain production in China during the growth season. We thus chose average temperature, precipitation, radiant flux and CO2 concentration as input factors for climate.
Driven by the complex and changeable climate system, the global climate model has become a powerful tool for studying future climate change and a vital tool for climate projection under different greenhouse gas emission scenarios [36]. With the increase in anthropogenic greenhouse gas emissions and changes in land use, the CMIP6 plan provides key data support for future climate change mechanism research and climate change mitigation and adaptation research based on various shared social and economic paths [37]. However, the climate models in the plan differ greatly in terms of mechanisms, climate forcing, model resolution, and scenario design, so they have different performances in simulating climate change. We first interpolate each model data to a grid with a resolution of 0.5˚ × 0.5˚ through the bilinear interpolation method, and then perform equal-weight arithmetic averages on the five model data. To visually observe the changing trend of future climate factors, we determine the difference between the average state of climate factors in the future time and the past time period.
The climate change in China’s main grain-producing areas in the next 15 and 30 years will be similar under three different climate scenarios. Compared with the past 34 years (1981∼2014), the climate change in the North region in the next 15 years (2021–2035) will present a trend of increasing temperature, slightly increasing precipitation and radiation flux, and a significant increase in CO2 concentration. The trend of climate change in the South region is a slight increase in temperature, a slight decrease in precipitation, and a significant increase in radiant flux and CO2 concentration (Figure 6). The temperature change in the North region is larger than that in the South region, and the radiant flux change in the South region is greater than that in the North region, mainly due to the latitude. The climate change in the next 30 years (2021∼2050) is consistent with the change trend in 2021∼2035, and climate change will be strengthened (Figure 7).
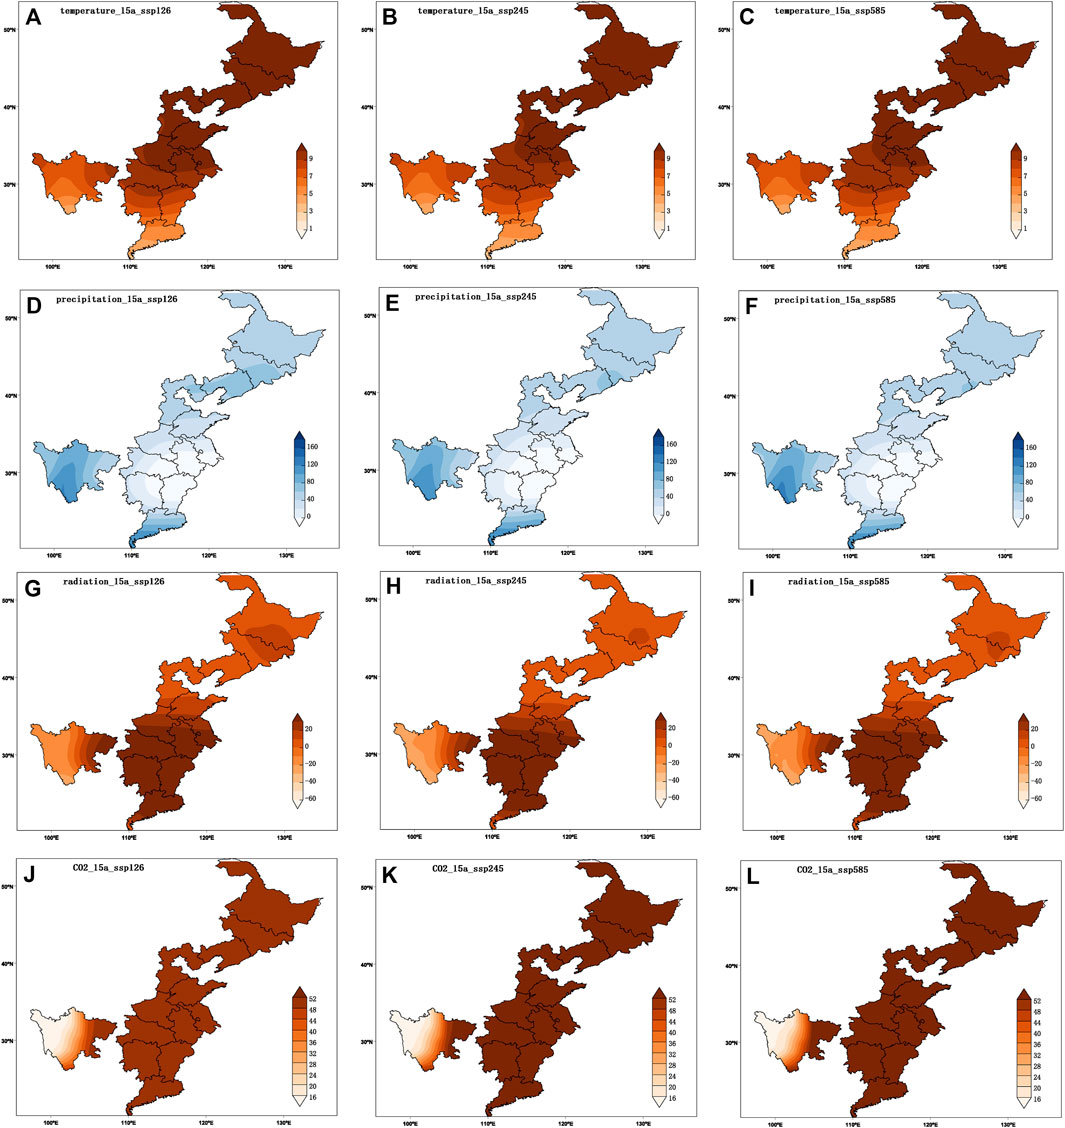
FIGURE 6. Distribution of changes in climatic factors in China’s main grain-producing areas in the next 15 years (2021–2035) under three future scenarios. (A, B,C) are the spatial distribution of mean temperature in SSP1-2.6, SSP2-4.5 and SSP5-8.5 scenarios, respectively. (D, E,F) are the spatial distribution of precipitation in SSP1-2.6, SSP2-4.5 and SSP5-8.5 scenarios, respectively. (G, H,I) are the spatial distribution of radiation in SSP1-2.6, SSP2-4.5 and SSP5-8.5 scenarios, respectively. (J, K,L) are the spatial distribution of CO2 concentration in SSP1-2.6, SSP2-4.5 and SSP5-8.5 scenarios, respectively. The value is the difference between the mean annual value from 2021 to 2035 and the mean annual value from 1981 to 2014.
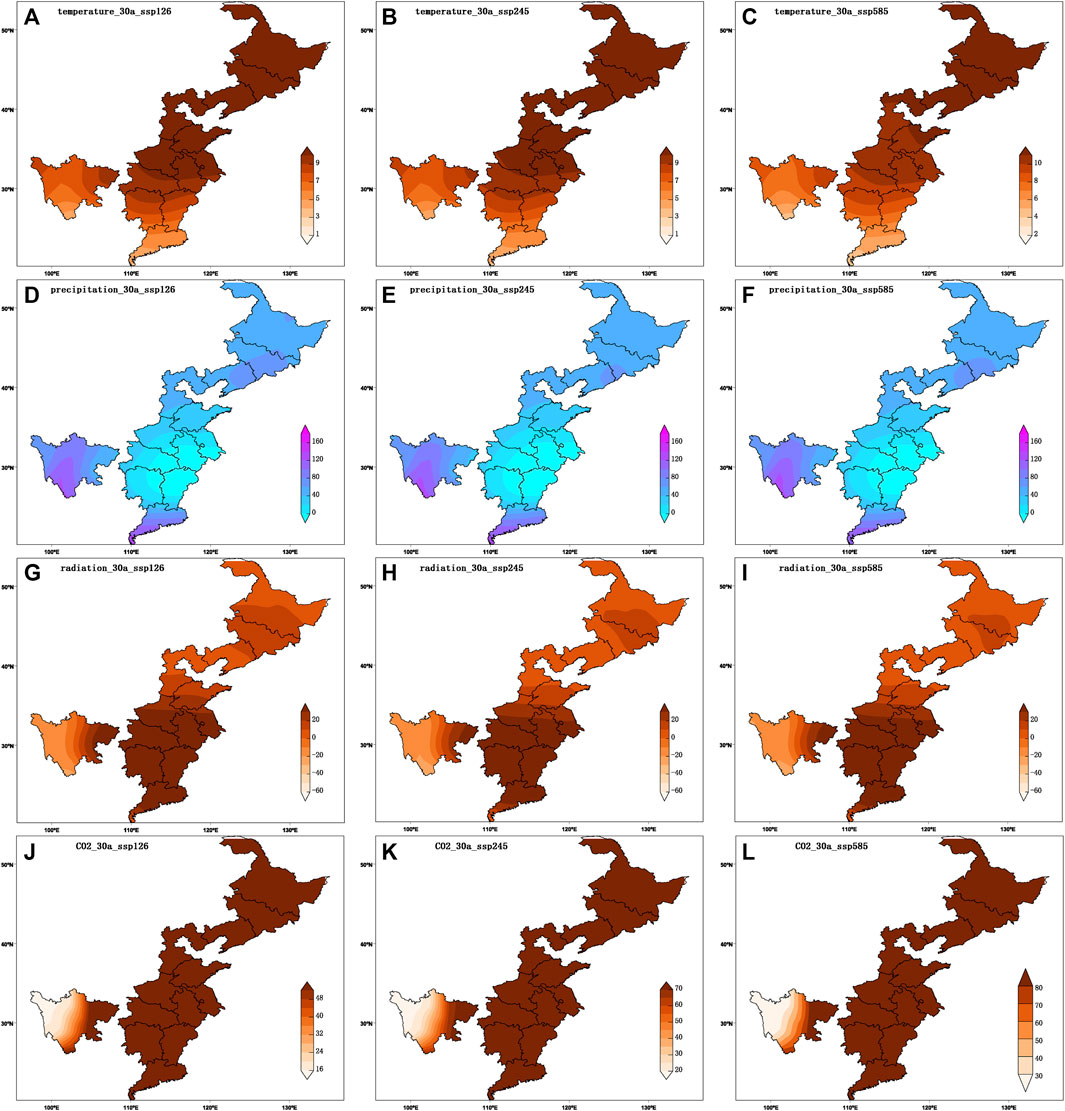
FIGURE 7. Distribution of changes in climatic factors in China’s main grain-producing areas in the next 30 years (2021–2050) under three future scenarios. (A, B,C) are the spatial distribution of mean temperature in SSP1-2.6, SSP2-4.5, and SSP5-8.5 scenarios, respectively. (D, E,F) are the spatial distribution of precipitation in SSP1-2.6, SSP2-4.5 and SSP5-8.5 scenarios, respectively. (G, H,I) are the spatial distribution of radiation in SSP1-2.6, SSP2-4.5 and SSP5-8.5 scenarios, respectively. (J, K,L) are the spatial distribution of CO2 concentration in SSP1-2.6, SSP2-4.5 and SSP5-8.5 scenarios, respectively. The value in the figure is the difference between the mean annual value from 2021 to 2050 and the mean annual value from 1981 to 2014.
In fact, the growth and development of crops is not an independent impact of a single climatic factor but is an integrated effect of multiple climatic factors. This study constructed the main climatic factors (i.e., air temperature, precipitation, radiation flux and CO2 concentration) into a Comprehensive Climate Factor (CCF) and quantitatively analyzed the impacts of integrated climate change in China’s main grain-producing areas. This is a creative research method that combines complex factors in order to study main trends. The CCF is an important evaluation indicator that integrates information from climatic factors and provides a new perspective for research on regional responses to integrated climate change.
The year 2021 is the first year of China’s “14th Five-Year Plan”, and China has entered a new stage of accelerating the development of agricultural modernization and comprehensively promoting rural revitalization. The year 2035 is the last year for China to basically realize socialist modernization, and the grain planting area will remain generally stable by 2035 [38]. The year 2050 is the last year for China to become a powerful modern socialist country. China’s social and economic development trends and patterns will inevitably undergo great changes from 2021 to 2050. Moreover, 2035 and 2050 can reflect China’s phased economic development and changes. Based on this, we use the years 1981∼2014 as the base period to predict the average change in the next 15 years (2021∼2035) and the next 30 years (2021∼2050).
First, the climatic output elasticity of the North and South regions from 1981 to 2014 is calculated. According to Eqs. 1, 2 of the C-D-C model, the comprehensive climate factor and economic factor data are introduced into the C-D-C model to obtain the output elasticity of the comprehensive climate factor. Among them, the climatic output elasticity is 0.037 in the North region and -0.211 in the South region. The climatic output elasticity of the North region passes the 1% significance level, which shows that climate change in the past 34 years has promoted the total grain production. The climate output elasticity of the South region is negative, but the negative impact of climate change on the total grain output is not significant. Under the condition that other nonclimatic factors remain unchanged, for every 10% increase in the comprehensive climate factor, the production in the North region increases by 0.37%, and the production in the South region decreases by 2.11%. The main reason may be that: environment and climate in the North region are affected by global warming, which reduces the damage caused by natural disasters (e.g., low temperature and frost damage). Moreover, agricultural production conditions have improved significantly, such as gradual improvements in agricultural production, the strengthening of agricultural infrastructure construction, increase in agricultural subsidy support policies, and continued agricultural technological development, which has increased the enthusiasm of farmers to grow food production in the North region. Based on these findings, the total grain production in the North region has increased rapidly, particularly in Northeast China. However, the increases in temperature and precipitation in the South region might increase the impact of agricultural natural disasters, such as those caused by high temperature, heat damage, and summer drought. In addition, the rapid development of industry in the South region has reduced the crop planting area, and the rural labor force has been continuously diminishing, which has accelerated the decrease in grain prodution in the South region.
Finally, the impact ratio of climate change in the next 15– years is calculated. The impact ratio of climate change reflects the weight of the impact of CCF on actual grain output. Taking the climatic output elasticity from 1981 to 2014 as the benchmark, the climatic output elasticity and the mean annual of CCF under the three future scenarios of 2021–2035 and 2021–2050 are introduced into the YICC model to obtain the IRCC, according to Eq. 8.
From 2021 to 2035, the impact ratio of climate change in the North region is negative, and decreases with the increase of emission concentration. The ratio in the South region is positive, and increases with the increase of emission concentration (Figure 8). Under the SSP1-2.6 scenario, climate change will cause a 0.60% drop in grain output in the North region and an increase of 1.80% in grain output in the South region. Under the SSP2-4.5 scenario, climate change will cause a 2.09% drop in grain output in the North region and an increase of 9.01% in the South region. Under the SSP5-8.5 scenario, climate change will cause a 1.86% drop in grain output in the North region and an increase of 7.17% in the South region. The main reason may be that temperature and CO2 concentration in the North region increase with the increase of the emission concentration, which leads to a warmer climate and is not conducive to the suitable growth of crops. The reduction in precipitation and radiation may cause damage to crops by natural disasters such as high temperature or drought, leading to a decline in grain output. The temperature in the South region may be suitable, the precipitation increases, and the radiation increases, which is conducive to the growth of crops. The future climate change in the South region will have a greater positive impact on food production than in the North region. The increase in CO2 concentration is beneficial to alleviate or offset the negative effects caused by climate warming and increase grain production.
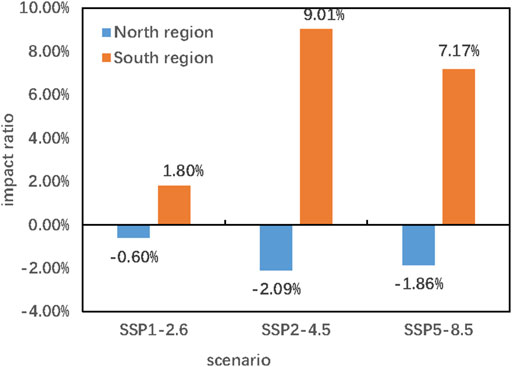
FIGURE 8. The impact ratio of climate change in the main grain-producing areas from 2021 to 2035.
The change trend of the impact ratio of climate change from 2021 to 2050 is consistent with the change region from 2021 to 2035. Compared with the impact of climate change in the next 15 years (2021–2035), the negative impact of climate change on the grain production in the North region in the next 30 years will weaken as the emission concentration increases (Figure 9). Among them, the grain output affected by climate change in the North region is reduced by 0.52% under the SSP1-2.6 scenario, 1.99% under the SSP2-4.5 scenario, and 1.76% under the SSP5-8.5 scenario. The main reason may be that the temperature and precipitation in the next 30 years will be higher than the changes in the next 15 years, which may reduce the impact of natural disasters such as low temperature and cold damage and provide sufficient water resources for crop growth. As a result, the negative impact of climate change is reduced in the North region. For the South region, climate change still has a positive impact on grain production. Compared with the impact of climate change in the next 15 years, the climate impact in the next 30 years on grain production in the South region will be strengthened under the SSP2-4.5 and SSP5-8.5 scenarios, and weakened under the SSP1-2.6 scenario.
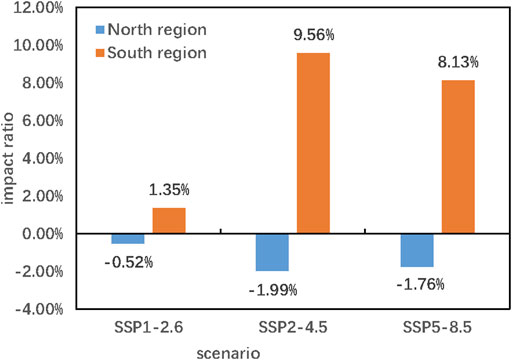
FIGURE 9. The impact ratio of climate change in the main grain-producing areas from 2021 to 2050.
1) Based on the traditional C-D-C model and the method for projecting the climate change impact, this paper introduces a comprehensive climate factor to improve the accuracy of the model and simplify the parameters. Combined with the new prediction achievements of the climate model of CMIP6, we further introduce the concept of the yield impact of climate change (YICC). The YICC represents the difference between economic output under a changing climatic state and a constant climatic state. It not only comprehensively considers the interaction between climate change and socio-economic factors but also takes into account the influence of the interdecadal climate change trend, thereby improving the accuracy of projecting the impact of future climate change.
2) To improve the impact assessment system of the economy-climate model, the yield impact of climate change (YICC) model is further introduced on the basis of the C-D-C model. The model can well project the impact of long-term climate change on economic output and reflect the sensitivity of economic output change to climate change by the impact ratio of climate change (IRCC) indicator in the model.
3) A case study of the yield impact of climate change model applied to the main grain-producing areas in China finds that the impact of climate change in the future 15– years on the grain output in the South region is beneficial under the three future scenarios, but it will have a negative impact on the grain output in the North region. From 2021 to 2035, the increase rate of grain production in the South region will range from 1.80 to 9.01% under the three future scenarios, and the rate of production reduction in the southern region will range from −2.09% to −0.60%. From 2021 to 2050, the production increase rate in the South region will be between 1.35% and 9.56%, and the production reduction rate in the North region will be between −1.99% and −0.52%. This modeling method has good prospects for application, and we will pay more attention to its application and promotion in future research.
To accurately and quantitatively project the impact of climate change on economic output in the next 15–30 years, this study combines the prediction achievements of the climatic model with econometrics and provides a new idea and method for studying the impact and adaptation of global change. It also provides a scientific basis for responding to climate change and preventing climate change risks in the socio-economic system. This study selects 5 GCMs in CMIP6, based on the shared socio-economic paths, and simulates the change range of future grain production in China and quantitatively gives the probability of increasing or decreasing grain production under the low-force scenario (SSP1-2.6), the medium-force scenario (SSP2-4.5), and the high-force scenario (SSP5-8.5). The application of the multi-model ensemble averaging method to the research of agricultural impact assessment can reduce the uncertainty of the impact of climate change on crop production. Grain production is affected by many factors, such as nature, economy and society. Among these factors, agricultural policies and government decisions play a leading role in China’s agricultural production. For example, in 1998, China began to actively promote the strategic adjustment of agricultural and rural economic structures. In 2006, China exempted agriculture from taxes and other regulatory policies. Increasing grain production has been an important policy focus. In 2012, China has introduced a food security policy of “ensuring basic self-sufficiency of grain and absolute security of staple food” and established a national strategy on food security featuring self-sufficiency based on domestic grain production, guaranteed food production capacity, moderate imports, and technological support. Socioeconomic and climate change factors jointly affect China’s grain production. Facing the changes in the spatial and temporal patterns of climate change in China’s main grain-producing areas, humans can use real-time agricultural technology, combined with meteorological monitoring and forecasting techniques to monitor the real-time dynamics of climate factors such as temperature and precipitation and to prevent possible natural disasters.
Among previous studies, Ma et al. [39] found that climate change in northeast China from 2031 to 2040 would lead to a 5.3% reduction in maize production using the integral regression method. Li et al. [40], Li et al. [41], and Sun et al. [42] using crop models, found that the average production reduction of maize, rice, and wheat in China would be 3.7, 7.49, and 5.2%, respectively, under the background of a temperature increase of 1.5°C. Although the method in this study is not as strong as the mechanism of the crop model, it uses long-term economic and climatic data to project the impact of climate change for analysis. It analyzes the relationship between climatic factors and economic output under the interaction of climate factors and economic factors. When projecting the future, it still includes the interaction between climate and economy and the long-term change trend. Therefore, the results may be more consistent with the actual situation. Of course, this method has some issues to be improved, such as the limitations of the economic-climate model itself and the uncertainty of the scenario data predicted by the climate model. The existence of these problems will inevitably lead to uncertainty in the assessment results of the impact of climate change, which needs to be further explored in future work.
The original contributions presented in the study are included in the article/Supplementary Material, further inquiries can be directed to the corresponding author.
YX and JC: Methodology, conceptualization, writing—original draft preparation, writing—review and editing. JC: validation, resources, supervision, project administration, and funding acquisition. YX and WZ: software, formal analysis. JL and YL: investigation, data curation. All authors have read and agreed to the published version of the manuscript.
This research was funded by the National Key Research and Development Program of China, grant number 2018YFC1509003; the National Natural Science Foundation of China, grant number 42075167.
The authors declare that the research was conducted in the absence of any commercial or financial relationships that could be construed as a potential conflict of interest.
All claims expressed in this article are solely those of the authors and do not necessarily represent those of their affiliated organizations, or those of the publisher, the editors and the reviewers. Any product that may be evaluated in this article, or claim that may be made by its manufacturer, is not guaranteed or endorsed by the publisher.
The Supplementary Material for this article can be found online at: https://www.frontiersin.org/articles/10.3389/fphy.2021.723306/full#supplementary-material
1.IPCC. Climate Change 2014: Synthesis Report. Contribution of Working Groups I, II and III to the Fifth Assessment Report of the Intergovernmental Panel on Climate Change. Intergovernmental Panel on Climate Change (IPCC) (2014). p. 151.
2.FAO. The Future of Food and Agriculture: Alternative Pathways to 2050. Food and Agriculture Organization of the United Nations (2018). p. 228.
3. Mbow C, Rosenzweig C, Barioni LG, Benton TG, Herrero M, Krishnapillai M, et al. Food Security in: Climate Change and Land: an IPCC Special Report on Climate Change. In: Desertification, Land Degradation, Sustainable Land Management, Food Security, and Greenhouse Gas Fluxes in Terrestrial Ecosystems. IPCC (2019).
4. Li JJ, Zhu JH, Sun ZB. Larock Indole Synthesis. Climatic Environ Res (2002) 7:209. doi:10.1007/978-3-662-04835-1_161
5. Chou J, Xu Y, Dong W, Xian T, Xu H, Wang Z. Comprehensive Climate Factor Characteristics and Quantitative Analysis of Their Impacts on Grain Yields in China's Grain-Producing Areas. Heliyon (2019) 5:e02846. doi:10.1016/j.heliyon.2019.e02846
6. Chou JM, Dong WJ, Yan XD. The Impact of Climate Change on the Socioeconomic System: A Mechanistic Analysis. Chin J Atmos Sci (2016) 40:191–200. doi:10.3878/j.issn.1006-9895.1507.15131
7. Ye DZ, Lv JH. Adaptation and Sustainable Development to Future Impacts of Global Change. Bull Chin Acad Sci (2000) 3. doi:10.16418/j.issn.1000-3045.2000.03.007
8. Fu CB, Dong WJ, Wen G, Ye DZ. Regional Response and Adaptation to Global Change. Acta Meteorologica Sinica (2003) 61:245–50.
9. Nicholls N. Increased Australian Wheat Yield Due to Recent Climate Trends. Nature (1997) 387:484–5. doi:10.1038/387484a0
10. Ray DK, West PC, Clark M, Gerber JS, Prishchepov AV, Chatterjee S. Climate Change Has Likely Already Affected Global Food Production. PLoS One (2019) 14:e0217148. doi:10.1371/journal.pone.0217148
11. Wang Z, Hua QL, Kong XD, Zhang YZ. Historical Reference of the Impact of Climate Warming on Agriculture in China. Prog Nat Sci (2005) 15:706–13. doi:10.1080/10020070512330018
12. Wang BH, Fu J, Xie YG, Feng Y. A Review on Evaluation Method of Economic Loss of Flood in the World. J Catastrophology (2007) 22:95–9.
13. Wang FT. Advances in Climate Warming Impact Research in China in Recent Ten Years. J Appl Meteorol Sci (2002) 13.
14. Fang XQ, Wang Y, Xu T, Yun YR. Contribution of Climate Warming to Rice Yield in Heilongjiang Province. Acta Geographica Sinica (2004) 59:820–8.
15. Tang XL, Jin XB, Sheng L, Zhou YK, Sun T. Research on Response of Grain Output to Climate Change Based on Wavelet Analysis:A Case Study of Tibet. Geogr Geo-information Sci (2008) 24:88–92.
16. Tao F, Hayashi Y, Zhang Z, Sakamoto T, Yokozawa M. Global Warming, rice Production, and Water Use in China: Developing a Probabilistic Assessment. Agric For Meteorology (2008) 148:94–110. doi:10.1016/j.agrformet.2007.09.012
17. Araya A, Hoogenboom G, Luedeling E, Hadgu KM, Kisekka I, Martorano LG. Assessment of maize Growth and Yield Using Crop Models under Present and Future Climate in Southwestern Ethiopia. Agric For Meteorology (2015) 214-215:252–65. doi:10.1016/j.agrformet.2015.08.259
18. Mendelsohn R, Nordhaus W, Shaw D. Climate Impacts on Aggregate Farm Value: Accounting for Adaptation. Agric For Meteorology (1996) 80:55–66. doi:10.1016/0168-1923(95)02316-x
19. Chen Y, Wu Z, Okamoto K, Han X, Ma G, Chien H, et al. The Impacts of Climate Change on Crops in China: A Ricardian Analysis. Glob Planet Change (2013) 104:61–74. doi:10.1016/j.gloplacha.2013.01.005
20. Hossain MS, Arshad M, Qian L, Zhao M, Mehmood Y, Kächele H. Economic Impact of Climate Change on Crop Farming in Bangladesh: An Application of Ricardian Method. Ecol Econ (2019) 164:106354. doi:10.1016/j.ecolecon.2019.106354
21. Kunimitsu Y. Regional Impacts of Long-Term Climate Change on Rice Production and Agricultural Income: Evidence from Computable General Equilibrium Analysis. Jpn. Agric. Res. Q. (2015) 49:173–85. doi:10.6090/jarq.49.173
22. Huang DL, Li XM, Ju SP. Climate Change Affecting Grain Production, Consumption and Economic Growth in China: Based on the Agricultural CGE Model. Chin Agric Sci Bull (2016) 32.
23. Chou JM, Ye DZ. Assessing the Effect of Climate Changes on Grains Yields with a New Economy-Climate Model. Climatic Environ Res (2006) 11:347–53.
24. Chou J, Dong W, Feng G. The Methodology of Quantitative Assess Economic Output of Climate Change. Chin Sci Bull (2011) 56:1333–5. doi:10.1007/s11434-011-4429-8
25. Chou J, Dong W, Feng G. Application of an Economy-Climate Model to Assess the Impact of Climate Change. Adv Atmos Sci (2010) 27:957–65. doi:10.1007/s00376-009-8166-8
26. Xu Y, Chou J, Yang F, Sun M, Zhao W, Li J. Assessing the Sensitivity of Main Crop Yields to Climate Change Impacts in China. Atmosphere (2021) 12:172. doi:10.3390/atmos12020172
27. Zhou SD, Zhu HG. Economic Analysis of Climate Change Impact on the Rice Yield in Southern China and its Adaptive Strategy. China Popul Resour Environ (2010) 20:152–7.
28. Lu S, Bai X, Li W, Wang N. Impacts of Climate Change on Water Resources and Grain Production. Technol Forecast Soc Change (2019) 143:76–84. doi:10.1016/j.techfore.2019.01.015
29. Chou J, Xu Y, Dong W, Xian T, Wang Z. Research on the Variation Characteristics of Climatic Elements from April to September in China's Main Grain-Producing Areas. Theor Appl Climatol (2019) 137:3197–207. doi:10.1007/s00704-019-02795-y
30. Chou JM, Feng GL, Dong WJ, Ye DZ, Chen HZ. A New Approach the Economy Evaluation of Influence on CHina Agriculture by Climate Change. Climatic Environ Res (2004) 9:361–8.
31. Zhou GS. Research Prospect on Impact of Climate Change on Agricultural Production in China. Meteorol Environ Sci (2015) 38. doi:10.3969/j.issn.1673-7148.2015.01.012
33. Xu L, Ma D. Parameter Estimation of C -- D Production Function. Science-Technology Manage (2001) 4. doi:10.16315/j.stm.2001.04.018
34. Fang SB. Exploration of Method for Discrimination between Trend Crop Yield and Climatic Fluctuant Yield. J Nat Disasters (2011) 20:13–8.
35. Cao LG, Fang YJ, Luo Y. Advances in Shared Socio-Economic Pathways for Climate Change Research and Assessment. Adv Clim Change Res (2012) 8:74–8. doi:10.3969/j.issn.1673-1719.2012.01.012
36. Yao Y, Luo Y, Huang JB. Evaluation and Projection of Temperature Extremes over China Based on 8 Modeling Data from CMIP5. Progressus Inquisitiones de Mutatione Climatis (2012) 8:250–6.
37. Zhang LX, Chen XL, Xin XG. Short Commentary on CMIP6 Scenario Model Intercomparison Project (ScenarioMIP). Progressus Inquisitiones de Mutatione Climatis (2019) 15:519–25.
38.The State Council Information Office of the People's Republic of China. "China's Food Security" White Paper. China: The State Council Information Office of the People's Republic of China (2019).
39. Ma YP, Sun LL, You-hao E, Wu W. Predicting the Impact of Climate Change in the Next 40 Years on the Yield of maize in China. Ying Yong Sheng Tai Xue Bao (2015) 26:224–32.
40. Li K, Xiong W, Pan J, Lin ED, Li YC, Han X. Trend Evaluation on Changes of Maize Yield in China under Global Warming by 1.5 and 2 °C .0 °C. Chin J Agrometeorology (2018) 39. doi:10.3969/j.issn.1000-6362.2018.12.001
41. Li M-Y, Gao X-N, Pan J, Xiong W, Guo L-P, Lin E-D, et al. Possible Trends of rice Yield in China under Global Warming by 1.5 ℃ and 2.0 ℃. J Nat Resour (2021) 36:567. doi:10.31497/zrzyxb.20210303
42. Sun R, Han X, Pan J, Xiong W, Ju H. The Impact of 1.5°C and 2.0°C Global Warming on Wheat Production in China. Progressus Inquisitiones de Mutatione Climatis (2018) 14:573–82.
43. Masson-Delmotte V, Zhai P, Pörtner H-O, Roberts D, Skea J, Shukla PR, et al. Summary for Policymakers. In: Global Warming of 1.5°C an IPCC Special Report on the Impacts of Global Warming of 1.5°C Above Pre-Industrial Levels and Related Global Greenhouse Gas Emission Pathways, in the Context of Strengthening the Global Response to the Threat of Climate Change. IPCC (2018).
Keywords: climate change, economy-climate model, mechanism, grain production, impact assessment
Citation: Chou J, Xu Y, Dong W, Zhao W, Li J and Li Y (2021) An Economy-Climate Model for Quantitatively Projecting the Impact of Future Climate Change and Its Application. Front. Phys. 9:723306. doi: 10.3389/fphy.2021.723306
Received: 10 June 2021; Accepted: 03 August 2021;
Published: 17 August 2021.
Edited by:
Gui-Quan Sun, North University of China, ChinaReviewed by:
Yinpeng Li, International Global Change Institute (IGCI), New ZealandCopyright © 2021 Chou, Xu, Dong, Zhao, Li and Li. This is an open-access article distributed under the terms of the Creative Commons Attribution License (CC BY). The use, distribution or reproduction in other forums is permitted, provided the original author(s) and the copyright owner(s) are credited and that the original publication in this journal is cited, in accordance with accepted academic practice. No use, distribution or reproduction is permitted which does not comply with these terms.
*Correspondence: Yuan Xu, eHV5dWFuMDFAbWFpbC5ibnUuZWR1LmNu
Disclaimer: All claims expressed in this article are solely those of the authors and do not necessarily represent those of their affiliated organizations, or those of the publisher, the editors and the reviewers. Any product that may be evaluated in this article or claim that may be made by its manufacturer is not guaranteed or endorsed by the publisher.
Research integrity at Frontiers
Learn more about the work of our research integrity team to safeguard the quality of each article we publish.