 Yifan Lin
 Shengfeng Wang2*
 Jinghua Xiao
- 1School of Science, Beijing University of Posts and Telecommunications, Beijing, China
- 2School of Information and Communication Engineering, Beijing University of Posts and Telecommunications, Beijing, China
- 3School of Journalism and Communication, Beijing Normal University, Beijing, China
Modern telecommunication systems produce large amounts of alarm messages, and alarm management is vital for telecommunication systems’ high-quality performance. Building functional networks by observing the pair similarity between time series is a useful way to filter and reduce alarm messages. Because of the coexistence of positive and negative correlations among telecommunication devices, most of the similarity measures have troubles in computing the complex correlations. In this paper, we propose an index of measuring how much two-alarm series deviate from the uncorrelated situation to detect the correlation of both sides. Synthetic sequences verify our method. Furthermore, we apply our method to analyze telecommunication devices’ alarm correlation in a province of China. Our index of pair similarities is capable of measuring other discrete event data.
Introduction
According to the Ministry of Industry and Information Technology of China, the total number of mobile phone users reached 1.594 billion and more than 98 percent of administrative villages had access to optical fiber and 4G in China at the end of 2020. Numerous base stations and other kinds of equipment constitute huge telecommunication networks with complicated structures. These telecommunication systems produce a large number of alarm messages every day, which pose a challenge to faults management. In the course of the managing process, various telecommunication devices may affect each other [1, 2]. To effectively manage the system, it is critical to develop strategies for correlating alarm messages by the physical connections of network elements or knowledge derived from alarm experiences.
To perform fault management under a large number of alarm messages, it is important to reduce the number of alarm messages by correlating different devices’ messages. In telecommunication networks, some expert systems are implemented to filter and correlate alarms. Italy [3], first uses expert system rules to recognize alarm correlation patterns and instantiate network fault hypotheses, and then applies a heuristic search to determine the best solution among the hypotheses. ALLINK™ Operations Coordinator from NYNEX [4] uses an expert system to filter network alarms. Most of the existing expert systems are for relating fault messages, and transferring the knowledge of human experts into an automated system. Other related methodologies were proposed. The work in [5, 6] is based on a formal language representation of the communication system. A. Bouloutas in [5] focuses on identifying errors in a known protocol: it is not an alarm correlation as such. The problem considered by A. Bouloutas and S. Calo in [6] is fault localization from alarms. It is a related although different problem. Such researches do not consider the occurring time of alarms, and assume knowledge of the network topology.
With the continuous development of telecommunication systems, telecommunication networks are becoming more complex, and features such as heterogeneous devices, network structures, and technologies are coexisting and cooperating within the system. This is a problem when domain-experts build management systems for root cause analysis or event relationship networks (ERNs). Data-driven fault management may be helpful [7]. Perng [8] utilized the event history logs in shorting the ERNs design process and perfecting the quality of ERNs. Besides constructing the ERNs, one can build device-device correlation networks from alarm logs. Particularly, telecommunication devices are deployed over large geographical area, and the device-to-device networks could be useful in understanding the performance of the whole systems. Based on the discrete alarm time of devices, device-to-device networks can be constructed by correlating alarm series to form a functional network. Functional structures are of great importance in aiding understanding of the properties of various man-made and natural networks [9, 10]. Differing from physical structures, functional structures are generally built by observing the similarity between time series. Depending on the application scenario and the type of data, there are various way of computing pair similarity. Euclidean Distance is the most basic measure, when two sequences are of equal length. To measure the similarity of unequal-length time series, Dynamic Time Warping (DTW) [11] is useful, and is used in many proposed optimizations [12–14]. If two time series have similar morphology in most time periods but only have certain differences in a very short time, Euclidean Distance and DTW cannot accurately measure the similarity between them, which can be solved by Longest Common Subsequence (LCSS) [15]. However, the measures mentioned above only focus on calculating how different the two series are, and ignore the probability of them being such different. Furthermore, due to the complexity of the system, recovering alarm messages sometimes needs to check both positively and negatively correlated devices. Most of the similarity measures may encounter troubles here.
To tackle the problem above we propose an index built on measuring to what extent the two series deviate from the corresponding shuffled series, to score the pair similarity. We then construct synthetic series to verify the method. Furthermore, we apply our method to analyze the alarm correlation of telecommunication devices in a province of China. Although our method focuses on the application of the telecommunication devices’ alarm series, it can also be applied to general discrete event data.
Methods
The Definition of the Similarity Score Between Alarm Sequences
This section defines an index to score the similarity.
Firstly, let
where
where
We define the similarity index in terms of
which is symmetric, so that
Computational Processing
Large values of D, such as in several days of data, would make the similarity computation very expensive. Therefore we separated the total time duration into several windows with equal size and computed the
Equation 2 is the probability mass function (pmf) of hypergeometric distribution. When the total seconds
where
The Verification of the Method
For verifying the validity of our method, we generated synthetic alarm series whose correlation can be set manually. Let
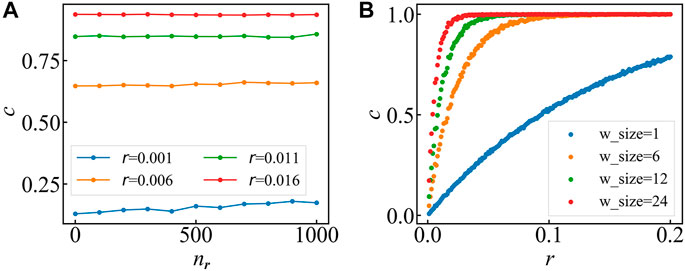
FIGURE 1. (A) Average similarity scores at different correlation level. The sequences of device A and B are generated 10 times. The results showed in this figure are the average of 10 experiments when the window size is 24. Similarity score barely changes as
We also study the influence of window size on the similarity scores. With random timestamps
Experiment
In this section, we use the method described above to analyze real data of device alarms in telecommunication networks and constructed a functional network that could help to locate faults by scoring the probability of every two devices being correlated when reporting alarm messages. Moreover, based on the location of devices, we construct a city-to-city alarm network (CCAN) and analyze its structure.
Data Description
The database is from a Chinese telecommunication company, including the alarm messages of about 500,000 telecommunication devices in a province of China from 26th August to 25th September in 2015. In the following, we anonymize the name of the province (named as G hereafter) and the related cities. Each message in the database includes device ID, alarm title, type, location, and other information. We pick out messages that recorded both device ID and location. Figure 2 shows that the alarm number distribution of 508,636 devices follow a power law distribution. To obtain the main correlation structure, we preprocess the database and take devices that documented alarm messages between 600 and 50,000 times into account. After that, 6,527 devices are considered into the following analysis.
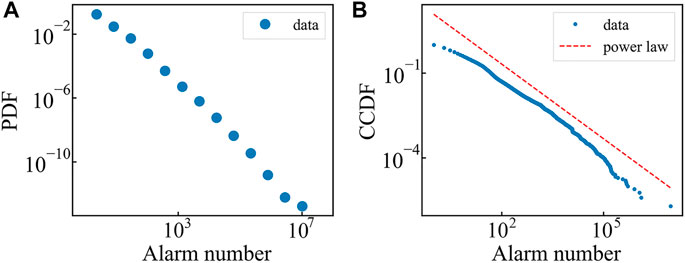
FIGURE 2. (A) Probability density function (pdf) of alarm times with log-log coordinate. (B) Complementary cumulative distribution function (ccdf) of alarm times with log-log coordinate. The data follows a straight line in log-log coordinates, which indicates that the alarm number obeys the power law distribution.
Result
Firstly, letting every device be the vertex, a fully connected network is formed. Here, an edge is equivalent to a pair of devices, and its weight equals the calculated similarity score. Then, we remove edges whose similarity scores are smaller than a threshold value, and the rest of the edges form the backbone of the alarm correlation network. Secondly, we use every device’s located city to analyze the relationship between the alarm numbers inside and outside the city and the network of cities.
After applying our method to the data, Figure 3A shows the complementary cumulative distribution function (CCDF) of the similarity scores. Each point shows the percentage of similarity scores that are more than a value. In Figure 3A, when we take 0.8 as a threshold of removing edges, there was less than 10% of the edges left in the network. In consideration of this, we use an approximation of hypergeometric distribution and the remaining term is of the same order as 0.0001, so choosing 0.999 as an upper bound for the analysis will not impact computation accuracy.
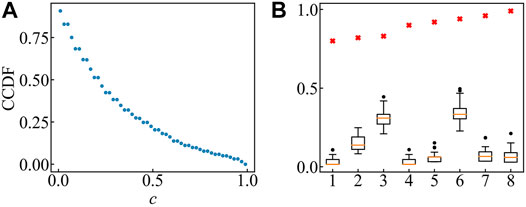
FIGURE 3. (A) Complementary cumulative distribution function (ccdf) of the similarity scores. Each point shows the percentage of scores that are more than a certain value. When using a threshold that is no less than 0.8, more than 90% of the edges will be removed. (B) Boxplot of randomly shuffled alarm sequences. For every chosen pair of devices, shuffle their sequence for 100 times and calculate the similarity scores of them. Red crosses symbolize the original similarity score. The original scores are completely separated from the shuffled sequences scores’ boxplots.
We randomly chose eight pairs of devices whose similarity scores are greater than 0.8 and shuffled their alarm times from the last 31 days to see if our index separates correlated devices from independent, uncorrelated ones. Figure 3B compares the scores of original alarm sequences with those of the shuffled sequences in 100 repetitions. The results show that the original scores are completely separated from the boxplots of the shuffled sequences scores, meaning that the device pairs left in the network are statistically correlated.
In the following, we show the devices’ alarm correlation network in G province, China. To compare the connection strength inside and outside the cities, we normalize the connection by relative connection density. For every city in G province, the relative density inside the city is defined as
where
where
where
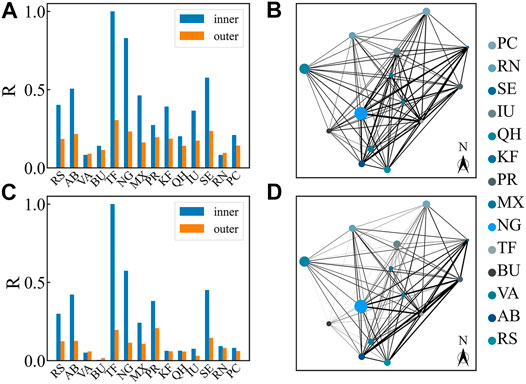
FIGURE 4. Relative connection density and intercity alarm relevance network (CCAN): (A) Percentage of relative density inside and outside cities when using threshold 0.8. The inner relative density is painted blue and the outer is painted orange. Each
Conclusion
Modern telecommunication systems produce large amounts of alarm messages. Correlating different alarm series in vital to effectively manage these alarm messages and maintain the performance of telecommunications networks. To measure the complex spatiotemporal correlation between telecommunication devices, we propose an index that uses the deviation of two alarm series from the random case to score the pair similarity in the device-to-device network. In Figure 1, synthetic series verify the validity of our index, and show that the similarity score can distinguish series pairs with different correlation levels and is robust when alarm numbers change. Moreover, the range that probability score vary with correlation level can be widened by reducing window size when calculating, as shown in Figure 1B. After verifying our method, we used it to analyze the telecommunication alarm database of devices in a Chinese province, and construct an alarm correlation network. In Figure 4, the results show that for most of the cities, the connection strength inside the cities is higher than outside. However, the connections outside cities are comparable with those inside cities. When increasing the edge removal threshold, cities’ structures start to emerge (though still weaker than the connections within cities). By analyzing the CCAN, we find that cites lying in the southeast of the province connect more strongly than elsewhere. Our similarity score measures the pair similarity by deviating from the random case and has a potential for more general applications.
Data Availability Statement
The data analyzed in this study is subject to the following licenses/restrictions: Because privacy issues are present, the data should not be shared. Requests to access these datasets should be directed to c2Z3YW5nQGJ1cHQuZWR1LmNu or bGlueWlmYW4xM0Bmb3htYWlsLmNvbQ==.
Author Contributions
All authors listed have made a substantial, direct and intellectual contribution to the work, and have approved it for publication.
Funding
This research was supported by the National Key R&D Program of China (grant No. 2020YFF0305300).
Conflict of Interest
The authors declare that the research was conducted in the absence of any commercial or financial relationships that could be construed as a potential conflict of interest.
Publisher’s Note
All claims expressed in this article are solely those of the authors and do not necessarily represent those of their affiliated organizations, or those of the publisher, the editors and the reviewers. Any product that may be evaluated in this article, or claim that may be made by its manufacturer, is not guaranteed or endorsed by the publisher.
References
1. Haes Alhelou H, Hamedani-Golshan M, Njenda T, Siano P. A Survey on Power System Blackout and Cascading Events: Research Motivations and Challenges. Energies (2019) 12(4):682. doi:10.3390/en12040682
2. Chung H-M, Li W-T, Yuen C, Chung W-H, Zhang Y, Wen C-K. Local Cyber-Physical Attack for Masking Line Outage and Topology Attack in Smart Grid. IEEE Trans Smart Grid (2019) 10(4):4577–88. doi:10.1109/TSG.2018.2865316
3. Brugnoni S, Bruno G, Manione R, Montariolo E, Sisto L. An Expert System for Real Time Fault Diagnosis of the Italian Telecommunications Network. Integrated Network Management III. In: Proceedings of the IFIP TC6/WG66 Third International Symposium on Integrated Network Management with participation of the IEEE Communications Society CNOM and with support from the Institute for Educational Services; 18-23 April; San Francisco, California, USA. AE Amsterdam, Netherlands: North-Holland Publishing Co., Div. of Elsevier Science Publishers B.V (1993). p. 617–28.
5. Bouloutas AT. Modeling Fault Management in Communication Networks [Ph.D Thesis]. Columbia: Columbia University (1990).
6. Bouloutas AT, Calo S, Finkel A. Alarm Correlation and Fault Identification in Communication Networks. IEEE Trans Commun (1994) 42(234):523–33. doi:10.1109/TCOMM.1994.577079
7. Dai X, Gao Z. From Model, Signal to Knowledge: A Data-Driven Perspective of Fault Detection and Diagnosis. IEEE Trans Ind Inf (2013) 9(4):2226–38. PubMed PMID: 13843496. doi:10.1109/TII.2013.2243743
8. Perng C-S, Thoenen D, Grabarnik G, Ma S, Hellerstein J. Data-driven Validation, Completion and Construction of Event Relationship Networks. In: Proceedings of the Ninth ACM SIGKDD International Conference on Knowledge Discovery and Data Mining; August 24 - 27; Washington, DC, USA. New York, NY, United States: Association for Computing Machinery (2003). p. 729–34. doi:10.1145/956750.956848
9. Albert R, Barabási A-L. Statistical Mechanics of Complex Networks. Rev Mod Phys (2002) 74(1):47–97. doi:10.1103/RevModPhys.74.47
10. Newman MEJ. The Structure and Function of Complex Networks. SIAM Rev (2003) 45(2):167–256. Epub May 2, 2003. doi:10.1137/S003614450342480
11.Sakoe H,, and Chiba S, editors. A Dynamic Programming Approach to Continuous Speech Recognition. Budapest, Hungary: International Congress on Acoustics (1971).
12. Sakoe H, Chiba S. Dynamic Programming Algorithm Optimization for Spoken Word Recognition. In: Waibel A, and Lee K-F, editors. Readings in Speech Recognition. San Francisco: Morgan Kaufmann (1990). p. 159–65. doi:10.1016/b978-0-08-051584-7.50016-4
13. Keogh EJ, Pazzani MJ. Derivative Dynamic Time Warping. Chicago: First SIAM international conference on data mining (2001).
14. Lahreche A, Boucheham B. A Fast and Accurate Similarity Measure for Long Time Series Classification Based on Local Extrema and Dynamic Time Warping. Expert Syst Appl (2021) 168:114374. doi:10.1016/j.eswa.2020.114374
15. Golay X, Kollias S, Stoll G, Meier D, Valavanis A, Boesiger P. A New Correlation-Based Fuzzy Logic Clustering Algorithm for FMRI. Magn Reson Med (1998) 40(2):249–60. doi:10.1002/mrm.1910400211
Keywords: telecommunication alarm, similarity measure, alarm correlation network, event relationship network, time series
Citation: Lin Y, Wang S, Wu Y and Xiao J (2021) Similarity Analysis of Alarm Sequences by a Shuffling Method. Front. Phys. 9:714910. doi: 10.3389/fphy.2021.714910
Received: 26 May 2021; Accepted: 19 July 2021;
Published: 09 September 2021.
Edited by:
Gaogao Dong, Jiangsu University, ChinaReviewed by:
Jianguo Liu, Shanghai University of Finance and Economics, ChinaXiao-Pu Han, Hangzhou Normal University, China
André L. M. Vilela, Universidade de Pernambuco, Brazil
Copyright © 2021 Lin, Wang, Wu and Xiao. This is an open-access article distributed under the terms of the Creative Commons Attribution License (CC BY). The use, distribution or reproduction in other forums is permitted, provided the original author(s) and the copyright owner(s) are credited and that the original publication in this journal is cited, in accordance with accepted academic practice. No use, distribution or reproduction is permitted which does not comply with these terms.
*Correspondence: Shengfeng Wang, c2Z3YW5nQGJ1cHQuZWR1LmNu; Jinghua Xiao, amh4aWFvQGJ1cHQuZWR1LmNu