 Rahul Kumar Gangwar
 Rui Min
 Santosh Kumar
 Xiaoli Li
- 1Center for Cognition and Neuroergonomics, State Key Laboratory of Cognitive Neuroscience and Learning, Beijing Normal University at Zhuhai, Zhuhai, China
- 2Shandong Key Laboratory of Optical Communication Science and Technology, School of Physics Science and Information Technology, Liaocheng University, Liaocheng, China
In this article, a D-shaped optical fiber refractive index (RI) sensor based on surface plasmon resonance effect is demonstrated. The gold film is placed at the flat portion of the optical fiber along with the sensing analytes of the different RIs to excite the plasmonic interactions. Sensing properties are investigated by using the finite element method. The maximum sensitivity of the proposed sensor is achieved as high as 20863.20 nm/RIU with the maximum resolution of 4.79 × 10⁻⁶ RIU and figure of merit of 308.38 RIU−1 for an analyte with RI 1.43 by optimizing the different parameters of the sensor with maximum phase matching between the core mode and surface plasmon mode. The high sensitivity of the sensor offers a promising approach for the detection of unknown RI analyte in chemical and biological fields in the near-infrared region.
Introduction
While considerable progress has been made over the last decade in the field of surface plasmon resonance (SPR)–based optical fiber refractive index (RI) sensors, the steady increase in the application of these sensors in several fields such as biological, chemical, and health monitoring etc., always sets a new limit for the research communities [1–3]. SPR is a label-free sensing technology in which surface plasmon can be excited when an incident polarized light couples with the surface plasmon wave (SPW) at the interface of the metal-dielectric surface. The wave vector of the SPW depends on the RI of the surrounding medium which leads to make SPR a very sensitive technique to detect the variations in refractive indices (RIs) that are primarily caused by the interactions or binding of the surrounding molecules to the metal surface [4–8]. In traditional SPR configuration, a total internal reflection–based theory is proposed by Kretschmann and Otto in 1968, in which the base of a coupling prism is coated with the thin metal (Au or Ag) and the incident p-polarized light wave excites the surface plasmons at the metal-dielectric interface [9, 10]. However, this configuration has many limitations and disadvantages like bulk in size, poor reliability, not suitable for remote sensing, and requires mechanical instruments which limit its uses.
To overcome these issues, SPR-based micro and nanostructured optical fiber sensors (OFSs) have drawn great attention because of their unique characteristics such as robustness, compact size, fast response, high sensitivity, online real-time monitoring, electromagnetic immunity etc. Because of these advantages, the effect to propose new kinds of SPR sensors in different areas of biosensing, chemical analysis, and environmental control has been expanded exceptionally quickly [11–15]. The first SPR-based OFS, in which a thin gold film is coated on the fiber core for the excitation of the surface plasmon, was proposed by Jorgenson in 1993, and till now, different kinds of fiber such as tapered fiber [16], multicore fiber [17], fiber grating [18], and photonic crystal fiber (PCF) have been proposed and utilized for the SPR-based sensing components. The waveguide property of an optical fiber is altered by some suitable technique to make it sensitive to the external environment (generally by removing the cladding). An alternative to removing the entire cladding of an optical fiber for a certain length, which reduces power, sustainability, and reliability, is to use a D-shaped optical fiber sensor, which is comparatively strong and durable without sacrificing the sensing properties of the device.
In all of these reported sensors, D-shaped OFS has more attractive features such as less fragile structure, easy fabrication process, high sensitivity, and easy access to the large evanescent field for efficient sensing applications [19]. In 2006, Wang et al. presented D-shaped optical fiber sensor based on the SPR effect. In this configuration, a gold film is coated on the fiber and RI sensitivity increases significantly [20]. A magnetic field sensor based on the D-shaped optical fiber Bragg grating with the sensitivity of 1.4403 pm/G was proposed by Lanza et al. in 2011 [21]. In 2015, a D-shaped PCF temperature sensor with a thin gold film coated on the cladding surface realizing a sensitivity of 11.6 nm//°C was reported by Shi et al. [22]. Nayak et al. proposed a D-shaped fiber SPR sensor, in which fiber is coated with silver followed by the graphene layer, with the maximum sensitivity of 6,800 nm/RIU in the RI from 1.33 to 1.37 [23]. Recently, Pathak et al. presented a concave-shaped OFS covered with multiple Au nanowires for RI sensing. The gold nanowires are coated on the concave-shaped channel, located at the D-shaped portion of the fiber perpendicular to the core. The maximum sensitivity of the sensor is 4,471 nm/RIU for analyte RI varying between 1.33 and 1.38 [24]. It is observed that D-shaped OFSs based on the SPR effect have the advantage of good flexibility and high sensitivity.
To improve the detection limit and sensitivity of the OFSs, an SPR-based D-shaped optical fiber RI sensor with a thin gold film coating on the flat surface of the fiber is presented. The finite element method (FEM) is used to characterize the sensing properties of the sensor. The influence of the doping concentration of the germanium (GeO2) in silica for the fiber core, thickness of the gold film, and coating distance of gold film from the fiber core have been studied. By using the wavelength interrogation method, the maximum sensitivity of 20863.20 nm/RIU with the resolution of the order of 10−6 has been achieved for the analyte 1.43 which is the highest compared to the reported works [23–28].
Materials and Methods
For a D-shaped optical fiber plasmonic sensor, observing the interaction between the evanescent waves (EWs) with surrounding medium is essential and hence it is required to investigate the structure very well. The cross-sectional view of the proposed D-shaped fiber sensor is illustrated in Figure 1. The metallic film of thickness “tg” is placed on the flat surface of the optical fiber at a distance “d” from the core of the fiber. Laser micromachine and side polishing technique can be used to fabricate this kind of structure. The polishing depth can be controlled very well [28–30].
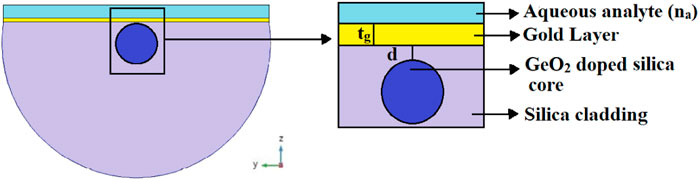
FIGURE 1. Cross-sectional view of the proposed D-shaped optical fiber RI sensor.
The fiber is a conventional single-mode fiber with a core and cladding diameter of 8.2 and 125 µm. The fiber core (with RI, nco) and cladding is made up with GeO2 doped silica and fused silica, respectively. Generally, the core of a fiber is doped with X percentage GeO2 in silica. The RI as a function of the wavelength of silica doped with X percentage of GeO2 and fused silica is calculated from the Sellmeier relation as follows [31]
In Eq. 1, λ is the wavelength and
Gold (thickness of tg) is used as a metallic film and is placed at a distance (d) from the core boundary. Drude model has been used to obtain the dielectric constant of gold as follows [23]
Here, λp = 1.6826 × 10⁻⁷ m and λc = 8.9342 × 10⁻⁶ m are the plasma wavelength and the collision wavelength of gold, respectively.
The COMSOL Multiphysics based on the FEM is an advanced simulation software and widely used for scientific calculation and research in various fields. Here, wave optics module, in the COMSOL Multiphysics, is used for analyzing the sensing properties of the proposed sensor. The whole structure is divided into a small subdomain and surrounded by the perfectly matched layer (PML) boundary which is applied for absorbing the light radiated toward the surface during the whole simulation process.
Results and Discussion
The proposed D-shaped plasmonic OFS for the RI sensing is based on the simple SPR effect. In SPR phenomena, the evanescent field of TM mode (p-polarized) wave excites the free electrons on the metal surface which produces the surface plasmon (SP) wave propagating through the metal-dielectric interface. There is a phase matched condition, at which the TM mode loses most of its energy to the SP wave, at given wavelength. This is known as resonance condition and this wavelength is called resonance wavelength. This resonance wavelength directly depends on the surrounding medium’s RI. This resonance wavelength is changed as the RI of the surrounding medium changing. Hence, by measuring this resonance wavelength, we can easily obtain the RI of the medium. Throughout the simulation process of the proposed sensor, TM mode is considered. During the simulation process, it is considered that light propagates in the z-axis and all the model investigation is executed in the XY plane. As the overlap between the electric field and the metallic film is increased, an increase in confinement loss appears. The model loss or confinement loss of the proposed sensor is obtained from the imaginary part of the effective RI [Im(neff)] of the guided mode, with the help of the following relation
where λ is the operating wavelength in microns.
Figure 2 shows the dispersion spectrum, the real part of the effective RI of the fundamental TM polarized core-guided mode (black line with square), surface plasmon mode (blue line with square), and the confinement loss (red line with square) of the core-guided mode for d = 5 nm, tg = 40 nm, and na = 1.41 of the proposed sensing device. As can be seen, at the resonance wavelength of 800 nm, the core mode and SPP mode match which excites the SPP mode. The dielectric core mode is not lossy but the SPP mode is highly lossy when they are phase matched at the resonance wavelength. The interaction of the core mode and SPP mode results a maximum power transfer from the core mode to the plasmonic mode. It leads a sharp increase in the confinement loss of the core-guided mode, which is shown in Figure 2 by the red line with square. The inset of Figure 2 shows the electric field distributions of TM polarized core mode at wavelength of 700 nm, surface plasmon polariton (SPP) mode and resonance mode at 800 nm, and core-guided mode at 860 nm, respectively. From the distribution of electric field of the resonance mode, it can be seen very clearly that most of the electric field is present at the metal/dielectric layer.
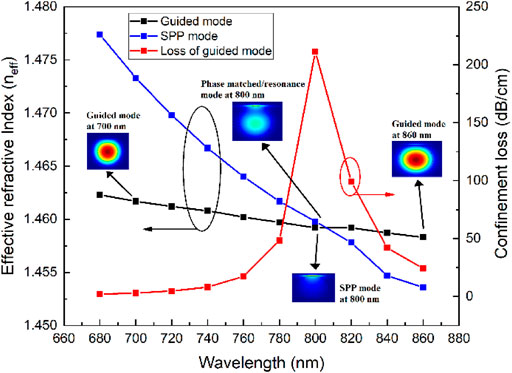
FIGURE 2. Dispersion relations of the fundamental core-guided mode (black), SPP mode (red), and confinement loss spectra (black) for d = 5 nm, tg= 40 nm, and na = 1.41 with 5% GeO2 doped silica core.
Apart from the influence of the RI of the surrounding medium, other parameters such as the thickness of gold film (tg), the distance (d) between the gold film and the core, and the doping concentration of the GeO2 in core also affect the performance of the proposed sensor. The distance of the gold film has an impact as it decides the strength of the EWs on the surface plasmon and the phase matching of the SPP with the guided mode. Figure 3 shows the variation of the resonance wavelength and corresponding confinement loss with the distance of the metallic layer from the core at a fixed gold film thickness of 40 nm and the surrounding analyte with a RI of 1.35 and 5% GeO2 doped silica core. As intended, the resonance wavelength kept constant while the maximum loss at resonance wavelength decreases continuously. The confinement loss decreases as the distance increases. At d = 0 and 5 nm, the confinement loss is 31.53 and 31.23 dB/cm while at d = 1,000 nm, it becomes 3.17 dB/cm at the wavelength of 600 nm, respectively. For the rest of the calculation, d = 5 nm has been considered as the optimized value. These depths can be experimentally achieved by the physical polishing, chemical etching, or the combination of these two techniques as previously reported [33].
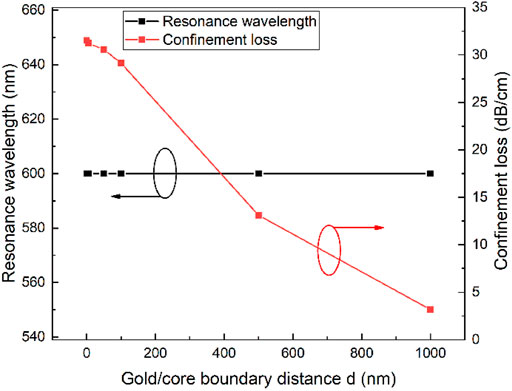
FIGURE 3. Evolution of the resonance wavelength and confinement loss with gold/core boundary distance (d), for tg = 40 nm, 5% GeO2 doping concentration and na = 1.35.
After optimizing the coating distance, the thickness of the gold film and the doping concentration of the GeO2 are also optimized. Figure 4A shows the variation of the resonance wavelength and corresponding confinement loss with gold thickness varying from 30 to 70 nm at d =5 nm, and 5% GeO2 doped silica core and na = 1.35, respectively. It is observed from the spectrum that resonance wavelength shifts toward the higher wavelength and after 50 nm it becomes constant. The corresponding value of confinement loss also first increases from 28.45 to 31.23 dB/cm for the thickness tg = 30–40 nm, and after tg = 40 nm, it starts decreasing rapidly to 4.43 dB/cm for the tg = 70 nm. The increase in metallic layer thickness is responsible for the higher damping loss which decreases the penetration of the evanescent fields toward the surrounding analyte. Here, when the thickness of the gold film is higher than the 40 nm, the higher damping loss causes the overall decrease in the confinement loss of the guided mode. Therefore, the optimized thickness of the gold layer is determined to be 40 nm for the sensor. Variation of the resonance wavelength and confinement loss with doping concentration of GeO2 for the d = 5 nm, tg = 40 nm, and na = 1.35 is shown in Figure 4B. As seen from Figure 4B, there is no variation in resonance wavelength till 12.5% of doping concentration, and at 15% doping concentration, the resonance wavelength shifts toward the shorter wavelength. While the confinement loss at corresponding resonance wavelength decreases continuously from 31.23 dB/cm to 19.55 dB/cm, the doping concentration of the GeO2 in silica increased from 5 to 15%. On considering higher model loss, the optimized value of GeO2 doping concentration is chosen to be 5%.
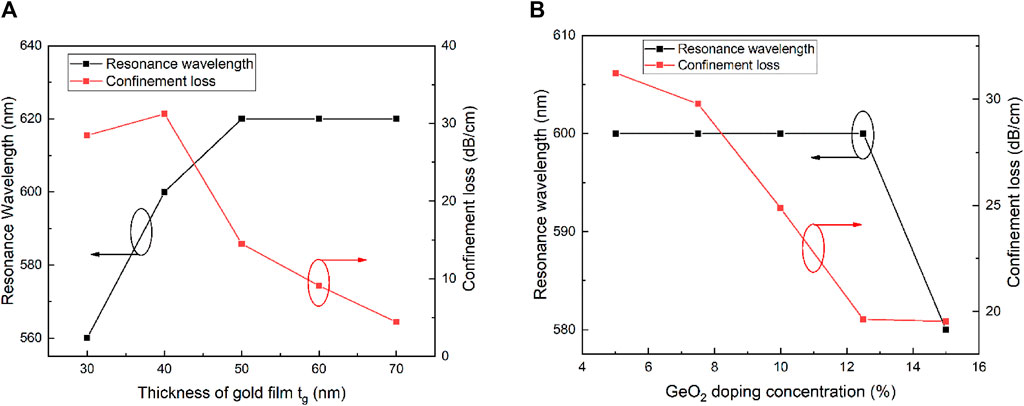
FIGURE 4. Variation of resonance wavelength and confinement loss with (A) gold thickness (B) GeO2 concentration in silica core for distance at d = 5 nm and na = 1.35.
After getting all the optimized structural parameters, the proposed sensor is tested for the sensing capabilities and the transmission spectra (logarithmic) are obtained for the broad range of the analytes with RI varying from 1.35 to 1.43 as shown in Figure 5. Transmission spectrum of the proposed sensor has been obtained by the following relation [34]
where Im (neff) is the imaginary part of the effective refractive index and L is length of the sensing fiber. For calculating the transmission spectrum, we have put L = 1 cm. Here, we can clearly observe a red-shift in the resonance wavelength with respect to the analyte’s RI, that is, as the RI of the analytes increases, the confinement loss peak is shifted toward the higher wavelength.
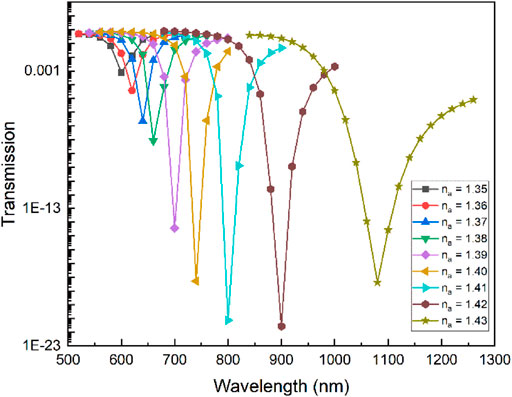
FIGURE 5. Evolution of the confinement loss as a function of wavelength for analytes with different RIs for 5% GeO2 doped silica core, d = 5 nm, and tg = 40 nm.
Figure 6 delineates the variation of the resonance wavelength and sensitivity as a function of the analyte’s RI (na). The sensitivity is obtained by the polynomial fit of the derivative of resonance wavelength with the analyte’s RI. The sensitivity of the proposed sensor is denoted by “S” and can be obtained by the following relation
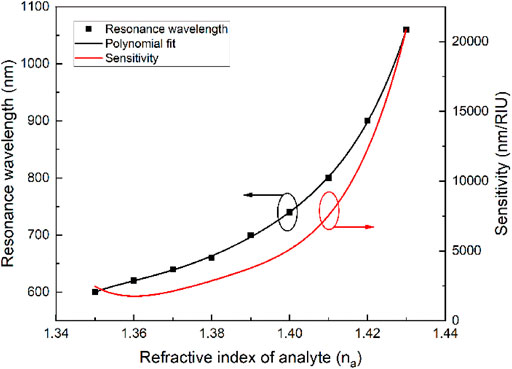
FIGURE 6. Variation of the resonance wavelength and sensitivity with the RI of the analyte (na) for d = 5 nm with tg = 40 nm and 5% GeO2 doped silica core. The lines represent a polynomial fit made to the simulated values.
As it can be seen that the sensitivity increases non-linearly from 2458.98 nm/RIU to 20863.20 nm/RIU for the analyte’s RI which ranges from na = 1.35 to na = 1.43.
Resolution is another important parameter that describes the ability of the proposed device to detect a small variation in analyte’s RI. It is obtained by the following relation
where Δλmin is the minimum spectral resolution and S is the sensitivity of the device. By choosing
For the comprehensive analysis of a SPR-based sensor, the figure of merit (FOM) is also a very important and necessary parameter. It is obtained from the following equation
where S is the sensitivity and FWHM is the resonance’s full width at half maximum. The FWHM is of interest as a larger FWHM will introduce larger uncertainty in detecting the resonance wavelength which causes a lower resolution. Figure 7 depicts the FOM and FWHM as a function of the analyte’s RI (na). The FOM is varying from the 67.53 RIU−1 to 356.83 RIU−1 while the FWHM first decreases from 36.41 to 21.99 and then increases up to 67.65 nm. This kind of behavior of the FOM is mainly the result of the non-linear behavior of the sensitivity. The FWHM of the different loss spectrum of the analyte’s RI is not constant, that is, it is low for some sets of na and high for other sets of na which also has an effect on the non-linear variation of the FOM. The increase in the analyte’s RI (na) provides the comparative lower index contrast which causes the broadening in FWHM of each loss spectrum associated with the analyte’s RI. Table 1 provides a detailed comparison of the proposed sensor with other previously reported sensors in terms of sensitivity, resolution, and FOM. From the comparison, we can conclude that the proposed D-shaped optical fiber plasmonic–based RI sensor performs with a higher sensitivity, higher FOM, better resolution, and a larger sensing range. Therefore, the presented sensor based on SPR effect shows great potential for the measurement of different liquids in different fields such as chemical, biochemical, and biosensing film.
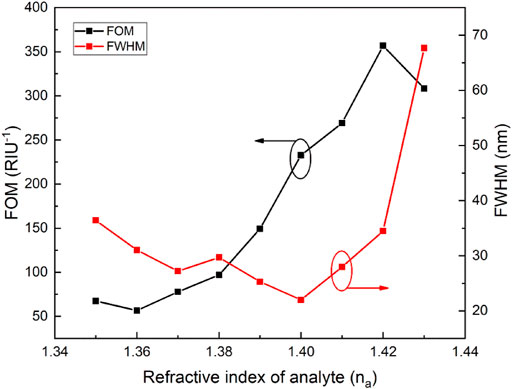
FIGURE 7. Variation of the FOM and FWHM as a function of the RI of the analyte for d = 5 nm with tg = 40 nm and 5% GeO2 doped silica core.
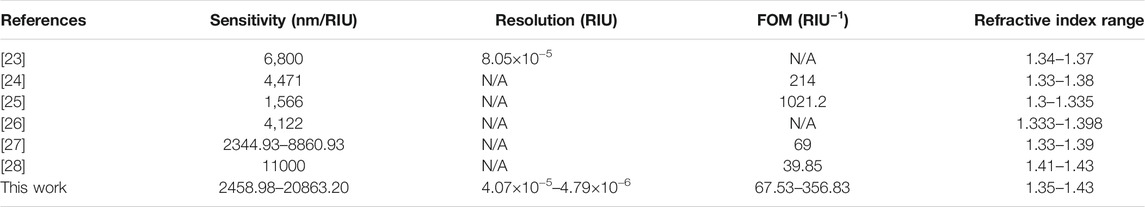
TABLE 1. D-shaped SPR-based sensor performance comparison using the wavelength interrogation method.
Conclusion
A D-shaped optical fiber RI sensor based on the SPR effect is proposed and numerically investigated by using the FEM. The structure of the proposed sensing device consists of a gold layer deposited on the flat surface of the fiber. All structural parameters of the device are optimized and their influence on the sensing characteristics of the device have been systematically analyzed. The sensing device with a gold film of 40 nm thickness deposited at a 5 nm distance from the core boundary has a very good sensitivity which varies from 2458.98 nm/RIU to 20863.20 nm/RIU for the RI ranges from 1.35 to 1.43 with a maximum resolution of 10−6 RIU. The FOM of the proposed sensor has a maximum value of 356.83 RIU−1 from 67.53 RIU−1 for the same sensing range. Due to these benefits and considering the latest microfabrication technology, the proposed sensor can be very useful for a broad range of applications such as medical diagnosis, food safety, and chemical and biochemical sensing.
Data Availability Statement
The raw data supporting the conclusions of this article will be made available by the authors, without undue reservation.
Author Contributions
RK: Methodology, Conceptualization, Formal analysis, Validation, Funding acquisition, Writing - original draft. RM: Conceptualization, Formal analysis, Validation, Funding acquisition, Supervision, Writing - review and editing. SK: Formal analysis, Validation, Writing - review and editing, XL: Validation, Writing - review and editing.
Funding
National Natural Science Foundation of China (62003046, 6211101138); Guangdong Basic and Applied Basic Research Foundation (2021A1515011997); Guangdong Recruitment Program of Foreign Experts (2020A1414010393); Special project in key field of Guangdong Provincial Department of Education (2021ZDZX1050); The Innovation Team Project of Guangdong Provincial Department of Education (2021KCXTD014); Double-Hundred Talent Plan of Shandong Province.
Conflict of Interest
The authors declare that the research was conducted in the absence of any commercial or financial relationships that could be construed as a potential conflict of interest.
Publisher’s Note
All claims expressed in this article are solely those of the authors and do not necessarily represent those of their affiliated organizations, or those of the publisher, the editors and the reviewers. Any product that may be evaluated in this article, or claim that may be made by its manufacturer, is not guaranteed or endorsed by the publisher.
References
1. Yi Z, Huang J, Cen C, Chen X, Zhou Z, Tang Y, et al. Nanoribbon-ring Cross Perfect Metamaterial Graphene Multi-Band Absorber in THz Range and the Sensing Application. Results Phys (2019) 14:102367. doi:10.1016/j.rinp.2019.102367
2. Tong H, Xu Y, Su Y, Wang X. Theoretical Study for Fabricating Elliptical Subwavelength Nanohole Arrays by Higher-Order Waveguide-Mode Interference. Results Phys (2019) 14:102460. doi:10.1016/j.rinp.2019.102460
3. Cen C, Zhang Y, Liang C, Chen X, Yi Z, Duan T, et al. Numerical Investigation of a Tunable Metamaterial Perfect Absorber Consisting of Two-Intersecting Graphene Nanoring Arrays. Phys Lett A (2019) 383:3030–5. doi:10.1016/j.physleta.2019.06.028
4. Chen H, Huang ZF, Duan ZY. SPR Biosensor and its Application Progress, Chin. J Biol Eng (2003) 23:46–9.
5. Homola J, Yee SS, Gauglitz G. Surface Plasmon Resonance Sensors: Review. Sensors Actuators B: Chem (1999) 54:3–15. doi:10.1016/s0925-4005(98)00321-9
6. Hoa XD, Kirk AG, Tabrizian M. Towards Integrated and Sensitive Surface Plasmon Resonance Biosensors: A Review of Recent Progress. Biosens Bioelectron (2007) 23:151–60. doi:10.1016/j.bios.2007.07.001
7. Cen C, Yi Z, Zhang G, Zhang Y, Liang C, Chen X, et al. Theoretical Design of a Triple-Band Perfect Metamaterial Absorber in the THz Frequency Range. Results Phys (2019) 14:102463. doi:10.1016/j.rinp.2019.102463
8. Gangwar RK, Amorim VA, Marques PVS. High Performance Titanium Oxide Coated D-Shaped Optical Fiber Plasmonic Sensor. IEEE Sensors J (2019) 19(20):9244–8. doi:10.1109/jsen.2019.2927728
9. Otto A. Excitation of Nonradiative Surface Plasma Waves in Silver by the Method of Frustrated Total Reflection. Z Physik (1968) 216:398–410. doi:10.1007/bf01391532
10. Kretschmann E, Raether H. Notizen: Radiative Decay of Non Radiative Surface Plasmons Excited by Light. Z Naturforsch A (1968) 23:2135–6. doi:10.1515/zna-1968-1247
11. Wang X, Zhu J, Tong H, Yang X, Wu X, Pang Z, et al. A Theoretical Study of a Plasmonic Sensor Comprising a Gold Nano-Disk Array on Gold Film with a SiO 2 Spacer. Chin Phys. B (2019) 28:044201. doi:10.1088/1674-1056/28/4/044201
12. Gangwar RK, Singh VK. Highly Sensitive Surface Plasmon Resonance Based D-Shaped Photonic crystal Fiber Refractive index Sensor. Plasmonics (2017) 12(5):1367–72. doi:10.1007/s11468-016-0395-y
13. Wang X, Zhu J, Wen X, Wu X, Wu Y, Su Y, et al. Wide Range Refractive index Sensor Based on a Coupled Structure of Au Nanocubes and Au Film. Opt Mater Express (2019) 9:3079–88. doi:10.1364/ome.9.003079
14. Yasli A, Ademgil H. Geometrical Comparison of Photonic crystal Fiber-Based Surface Plasmon Resonance Sensors. Opt Eng (2018) 57:030801. doi:10.1117/1.oe.57.3.030801
15. Yi Z, Liang C, Chen X, Zhou Z, Tang Y, Ye X, et al. Dual-band Plasmonic Perfect Absorber Based on Graphene Metamaterials for Refractive index Sensing Application. Micromachines (2019) 10:443. doi:10.3390/mi10070443
16. Korposh S, James S, Lee S-W, Tatam R. Tapered Optical Fibre Sensors: Current Trends and Future Perspectives. Sensors (2019) 19:2294. doi:10.3390/s19102294
17. Barrera D, Madrigal J, Delepine-Lesoille S, Sales S. Multicore Optical Fiber Shape Sensors Suitable for Use under Gamma Radiation. Opt Express (2019) 27(20):29026–33. doi:10.1364/OE.27.029026
18. Lobry M, Loyez M, Hassan EM, Chah K, DeRosa MC, Goormaghtigh E, et al. Multimodal Plasmonic Optical Fiber Grating Aptasensor. Opt Express (2020) 28(5):7539–51. doi:10.1364/OE.385747
19. Sharma AK, Jha R, Gupta BD. Fiber-optic Sensors Based on Surface Plasmon Resonance: a Comprehensive Review. IEEE Sensors J (2007) 7:1118–29. doi:10.1109/jsen.2007.897946
20. Wang S-F, Chiu M-H, Chang R-S. Numerical Simulation of a D-type Optical Fiber Sensor Based on the Kretchmann's Configuration and Heterodyne Interferometry. Sensors Actuators B: Chem (2006) 114(1):120–6. doi:10.1016/j.snb.2005.04.012
21. Lanza G, Breglio G, Giordano M, Gaddi A, Buontempo S, Cusano A. Effect of the Anisotropic Magnetostriction on Terfenol-D Based Fiber Bragg Grating Magnetic Sensors. Sensors Actuators A: Phys (2011) 172(2):420–7. doi:10.1016/j.sna.2011.10.005
22. Shi WH, You CJ, Wu J. D-shaped Photonic crystal Fiber Refractive index and Temperature Sensor Based on Surface Plasmon Resonance and Directional Coupling. wlxb (2015) 64(22):224221–1. doi:10.7498/aps.64.2242215
23. Nayak JK, Jha R. Numerical Simulation on the Performance Analysis of a Graphene-Coated Optical Fiber Plasmonic Sensor at Anti-crossing. Appl Opt (2017) 56:3510–7. doi:10.1364/ao.56.003510
24. Pathak AK, Rahman BMA, Singh VK, Kumari S. Sensitivity Enhancement of a Concave Shaped Optical Fiber Refractive Index Sensor Covered with Multiple Au Nanowires. Sensors (2019) 19:4210–112. doi:10.3390/s19194210
25. Del Villar I, Zubiate P, Zamarreño CR, Arregui FJ, Matias IR. Optimization in Nanocoated D-Shaped Optical Fiber Sensors. Opt Express (2017) 25(10):10743–56. doi:10.1364/oe.25.010743
26. Tien CL, Lin HY, Su SH. High Sensitivity Refractive Index Sensor by D‐Shaped Fibers and Titanium Dioxide Nanofilm. Adv Condens Matter Phys (2018) 6.
27. Fu H, Zhang M, Ding J, Wu J, Zhu Y, Li H, et al. A High Sensitivity D-type Surface Plasmon Resonance Optical Fiber Refractive index Sensor with Graphene Coated Silver Nano-Columns. Opt Fiber Technology (2019) 48:34–9. doi:10.1016/j.yofte.2018.12.017
28. Pathak AK, Singh VK, Ghosh S, Rahman BMA. Investigation of a SPR Based Refractive index Sensor Using a Single Mode Fiber with a Large D Shaped Microfluidic Channel. OSA Continuum (2019) 2(11):3008–18. doi:10.1364/osac.2.003008
29. Xie Q, Chen Y, Li X, Yin Z, Wang L, Geng Y, et al. Characteristics of D-Shaped Photonic crystal Fiber Surface Plasmon Resonance Sensors with Different Side-Polished Lengths. Appl Opt (2017) 56(5):1550–5. doi:10.1364/ao.56.001550
30. Del Villar I, Arregui FJ, Matias IR, Cusano A, Paladino D, Cutolo A. Fringe Generation with Non-uniformly Coated Long-Period Fiber Gratings. Opt Express (2007) 15:9326–40. doi:10.1364/oe.15.009326
31. Tien CL, Lin HY, Su SH. High Sensitivity Refractive Index Sensor by D-Shaped Fibers and Titanium Dioxide Nanofilm. Adv Condensed Matter Phys (2018) 6:2303740. doi:10.1155/2018/2303740
32. Fleming JW. Dispersion in GeO_2-SiO_2 Glasses. Appl Opt (1984) 23(24):4486–93. doi:10.1364/ao.23.004486
33. Esmaeilzadeh H, Arzi E, Légaré F, Hassani A. Controllable Hybrid Side-Polishing Method (CHPM) for Optical Fibers by Combination of Polishing and Etching. J Mod Opt (2013) 60(20):1813–20. doi:10.1080/09500340.2013.863401
Keywords: optical fiber sensor, surface plasmon resonance, gold, refractive index sensor, GeO2 doped silica, sensitivity
Citation: Gangwar RK, Min R, Kumar S and Li X (2021) GeO2 Doped Optical Fiber Plasmonic Sensor for Refractive Index Detection. Front. Phys. 9:707113. doi: 10.3389/fphy.2021.707113
Received: 09 May 2021; Accepted: 23 August 2021;
Published: 06 October 2021.
Edited by:
Venugopal Rao Soma, University of Hyderabad, IndiaCopyright © 2021 Gangwar, Min, Kumar and Li. This is an open-access article distributed under the terms of the Creative Commons Attribution License (CC BY). The use, distribution or reproduction in other forums is permitted, provided the original author(s) and the copyright owner(s) are credited and that the original publication in this journal is cited, in accordance with accepted academic practice. No use, distribution or reproduction is permitted which does not comply with these terms.
*Correspondence: Rui Min, cnVpbWluQGJudS5lZHUuY24=