 Luo Yan
 Feng Peng
 Zhao Ruge1,2
 Zhang Yi
 He Peng
94% of researchers rate our articles as excellent or good
Learn more about the work of our research integrity team to safeguard the quality of each article we publish.
Find out more
ORIGINAL RESEARCH article
Front. Phys., 02 July 2021
Sec. Medical Physics and Imaging
Volume 9 - 2021 | https://doi.org/10.3389/fphy.2021.686988
This article is part of the Research TopicEnergy-Sensitive X-Ray Computed Tomography ImagingView all 9 articles
XFCT is a novel method for the early cancer detection. Increasing concentration of contrast agents and incident X-rays’ energy were used to improve detecting accuracy, which greatly increased the prevalence of contrast-induced nephropathy. Therefore, this research explores the adaptive contrast agents and uses Geant4 to simulate the imaging conditions of Pt, Bi, Gd, Ru, and Au for searching the lowest detectable concentration based on the fast multi-pinhole collimated XFCT (fmpc-XFCT) imaging system and low incident energy. Several imaging parameters including pinhole radius (0.7, 0.8, and 1 mm) were adjusted, and the optimized EM-TV algorithm was used to reconstruct XFCT images. It is found that Bi element is superior to other metal elements in terms of the contrast-to-noise ratio (CNR) and fluorescence efficiency, and the lowest concentration that can be detected is 0.12% with optimal parameters.
X-ray fluorescence computed tomography (XFCT) is a novel method to detect early-stage cancer, combining X-ray computed tomography (X-CT) with X-ray fluorescence technology (XRF) [1–3]. For conventional X-CT imaging, the reconstructed image is the absorption coefficient of incident X-ray, which is difficult to distinguish the diseased and normal tissue for the slight difference of absorption. XFCT can be seen as a stimulated emission tomography, which can determine the spatial distribution of the contrast agents [4].
However, the development of XFCT is mainly limited by the high radiation dose and low detection sensitivity when used for an in vivo image. Increasing the concentration of contrast agent and incident X-rays’ energy was to solve this problem, which greatly increased the prevalence of contrast-induced nephropathy (CIN). CIN has become the third cause of iatrogenic kidney injury, which not only prolongs hospitalization and medical expenses but also increases the risk of death, especially for the venerable and diabetics. The preventive measures for CIN include hydration therapy, selecting hypotonic or isotonic contrast agents, reducing the dose of contrast agents, and supplying speed [5]. Therefore, the essential measure is to reduce the concentration of the contrast agents.
However, there is no specific contrast agent for XFCT, which mainly used the X-CT contrast agent like gold nanoparticles (GNPs). Liu et al., used Pt as the XFCT contrast agent and verified its feasibility by the Monte Carlo simulation [6]; Gd was commonly used as the X-CT and MRI contrast agent, and Zhang et al. used it for XFCT and figured out that the number of fluorescence photons of Gd is two times more than that of Au and imaged it at a sub-mg/mL level [7]; Li et al. proposed Ru nanoparticles as the contrast agent of XFCT, and the lowest detectable concentration is 0.2 mg/ml [8]. At the same time, they also proposed other potential fluorescent materials such as Y, Zr, Nb, Rh, and Bi [9]. The systems mentioned above are traditional scanning and rotating systems with long scanning time and high radiation dose. This manuscript explores the minimum dosage of various (Au, Gd, Pt, Bi, and Ru) contrast agents and sets the X-ray tube voltage at 62 keV to reduce the radiation dose and Compton scattering noise based on the fmpc-XFCT imaging system [10]. And we use photon counting detectors to detect the fluorescence signal due to the high energy resolution.
XFCT can be seen as a stimulated emission tomography, in which a sample is irradiated with X-rays more energetic than the K-shell or L-shell energy of the target elements of interest. This will produce fluorescent X-rays isotopically emitted from the sample, and the characteristic X-ray can be externally detected for the image reconstruction [11].
To calculate the relationship between fluorescent and incident photons, we established a fixed coordinate system x–y and a rotating coordinate system s–t (Figure 1). The relationship between s–t and x–y is as follows:
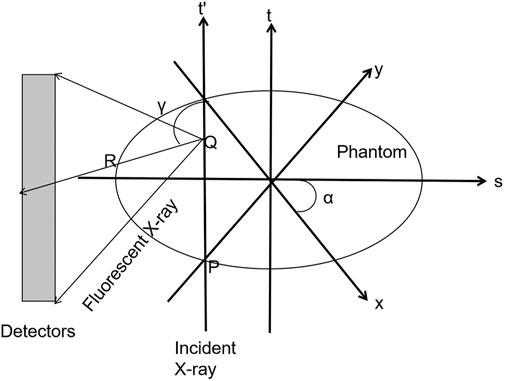
FIGURE 1. Geometry of XFCT.
The process of incident X-rays with an initial intensity of I0 is divided into three steps: the attenuation process of incident X-rays from P to Q, fluorescent photons are excited at the point Q, and fluorescent photons reach the detector after attenuation [12]. Then the flux rate, I, detected by the detector is obtained by the following equation:
where the f(α,s,t) and g(α,s,t) are shown as follows:
f(α, s, t) represents the process of incident X-ray reaching the point Q and g(α, s, t) represents the process of fluorescent X-ray radiated from the point Q reaching the detector. a and s denote the angle and the translation offset of the incident X-ray, respectively. uph is the photoelectric linear attenuation coefficient of contrast agents. ω is the angle at the point Q viewed by the detector.
In the research, we ignore the constant term and discretize the phantom into M×N pixels. Consequently, Eq. 2 can be simplified as follows:
where fij means the attenuation of the ith incident X-ray passing through the jth pixel; gij means the attenuation of the fluorescent X-ray; Lij is the intersection length of the ith X-ray and the jth pixel.
During the reconstruction process, I and H are known, and d in the equation is to be solved.
Maximum likelihood-expectation maximization (ML-EM) is an estimation method for solving unknown parameters in the likelihood function based on the maximum likelihood criterion. The maximum likelihood criterion requires, under certain test conditions, the optimal estimation value of the unknown parameter to be the sampling result reaching the maximum probability. Accordingly, the optimal estimation value could provide the likelihood function the maximum value. The iterative formula in reconstruction is as follows:
where dik means the estimated value of di pixel after the kth iteration and hij is the projection matrix, which means the weight of the ith detector from the jth pixel.
In order to further improve the quality of the reconstructed images, we adopt the optimized ML-EM algorithm proposed by Zhang et al. [13] and add the total variation term (TV) as a penalty function [14] to reduce the background noise. The optimized EM-TV algorithm is expressed as follows:
where θSCA is the scattering angle, μCO is the Compton scattering cross-section, and fKN is the Klein–Nishina formula, which can be obtained as follows:
The iterative formula in reconstruction is as follows:
where
Note that I(XRF) and I(SCA) are the fluorescent projection and scattering noise projection, respectively; djk and Sjk are the mean estimated values of concentration and noise of the jth pixel after the kth iteration; hij(XRF) and hij(SCA) are the mean fluorescent projection matrix and the scattering projection matrix, respectively.
In reality, the stability and robustness of the algorithm will decrease due to a large number of iterations. Hence, the acceleration factor is introduced to improve the convergence of the algorithm.
where α is the gradient descent relaxation factor, and ω is the gradient descent scale parameter, whose value belongs to 0–1. The large value of ω will cause the image to be too smooth, but the over smaller value will reduce the calculation speed [15]. In this study, we set ω equal to 0.2. υ as the gradient descent direction, which is approximately the partial derivative of total variation of the image:
where ε is a positive number for fidelity and preventing the denominator from being 0. Normally, ε is an empirical parameter, which is set to a very small number. Here, we set ε = 10−8.
Here, we use the contrast-to-noise ratio (CNR) [16] as an objective criterion to evaluate reconstructed images, which is defined as follows:
where ΨA is the average value of pixels in ROIs, ΨB is the average value of background pixels, and σbk is the standard deviation of the pixel values of the background area.
The experimental system is the fmpc-XFCT imaging system proposed by the authors, which is not needed to be translated and rotated, and imaged by fan beam scanning once [10]. The system settings are shown in Figure 2.
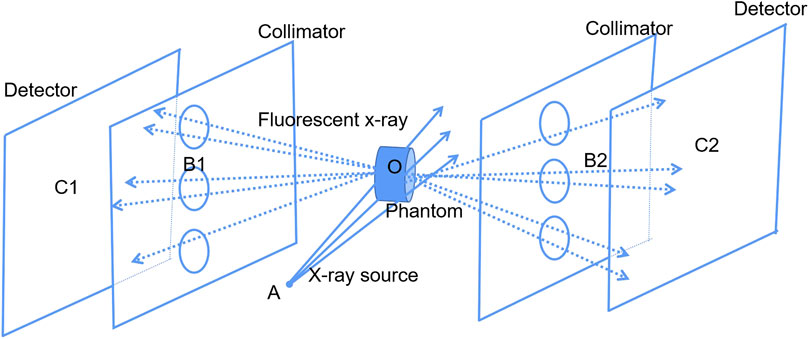
FIGURE 2. Fast multi-pinhole collimated XFCT system.
The imaging system includes an X-ray source, a phantom, two sets of multi-pinhole collimators, and two sets of detectors. Two sets of photon counting detectors are to obtain projections under double incident photons, thereby reducing the radiation dose. The distance between the X-ray source and the center of the sample is 15 cm (AO), the distance between the collimator and the sample is 5 cm (B1O and B2O), and the distance between the detector and the collimator is also 5 cm (B1C1 and B2C2). The detector consists of 55 × 185 detector crystals made of CdTe, the energy resolution is 0.5 keV, the crystal size is 0.3 mm × 0.3 mm, and the center distance of the detection crystal is 0.5 mm. The multi-pinhole collimator is made of Pb with a thickness of 5 mm. There are three pinholes with a radius of 1 mm for a set of multi-pinhole collimator. The pinhole is formed by superimposing two cones with a bottom angle of 55°. To avoid overlapping projections on the detectors, the vertical distance between the holes is 1.5 cm. The system is placed in the air.
In this study, a phantom with a radius of 2.5 cm was proposed: a small cylinder was filled with contrast agents (Pt, Bi, Gd, Ru, and Au), with a radius of 1.5 mm, a height of 5cm, and concentrations of 0.2, 0.4, 0.6, 0.8, 1.0, and 1.2%, as shown in Figure 3. It was called high-concentration phantom, abbreviated as HCP. It was used to explore the lowest concentration of the contrast agents. This experiment is based on the Rose criterion, that is, ROI can be detected when CNR ≥ 4 [17].
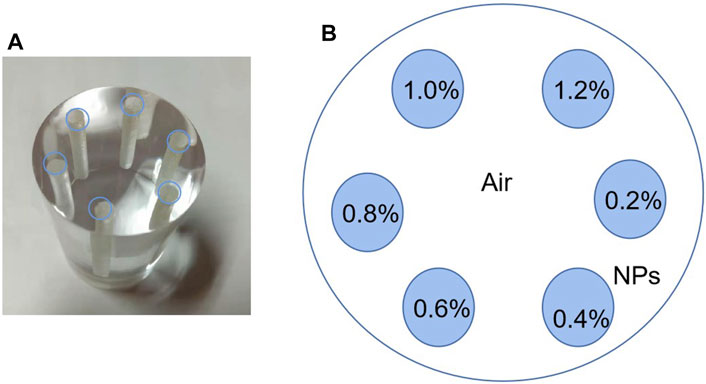
FIGURE 3. Phantom diagram: (A) physical diagram of phantom and (B) schematic diagram of concentration distribution.
In this experiment, we simulated the energy distribution of X-ray tube source in SpekCalc [18], using low-energy incident X-rays to excite the sample to reduce the radiation dose and Compton scattering (tube voltage = 62 keV).
In this experiment, the fluorescent materials were set as Pt, Bi, Gd, Ru, and Au. The projection data were obtained by Geant4 simulation, and the ML-EM algorithm was used for reconstruction. The reconstructed images are shown in Figure 4: for picture (A), the ROI brightness is poor and indicates concentration differences badly; for (B)–(D) all perform well, concentration differences are better, the ROI boundary is clear, the internal uniformity is excellent, and the distinction between each ROI is clear; and for (E), the inside of the ROI has poor uniformity and boundary clarification. For low-concentration ROI, neither can be distinguished well.
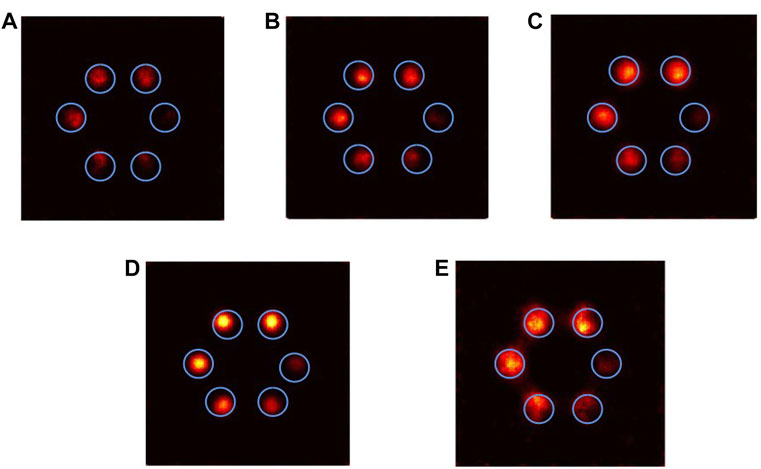
FIGURE 4. ML-EM algorithm reconstructed images of different contrast agents (iterating 10 times): (A) Pt, (B) Bi, (C) Gd, (D) Ru, and (E) Au.
Therefore, we changed ML-EM to the optimized EM-TV algorithm. The reconstructed images are shown in Figure 5. The ROIs in (A)–(E) are well dispersed, the boundaries of each ROI are clear, and the interior is uniform, and the shape is closer to phantom, which means the higher reconstructed capability. For (B) and (D), each of ROI is circular, and its reconstructed shape achieves the best. For (E), there is adhesion between the ROIs and blurred edges. From the subjective evaluation, the image quality of Bi and Ru has better performance, and the image quality of Au is the worst. CNR is used to evaluate image quality objectively, and it shows that the CNR value increases with the increase of concentration, as shown in Figure 6. For lower concentrations, Ru and Bi have a greater advantage (0.2–0.6%). Gd has a better performance for high concentrations. For each of the concentration, the CNR value of Au is the smallest, and its performance is the worst.
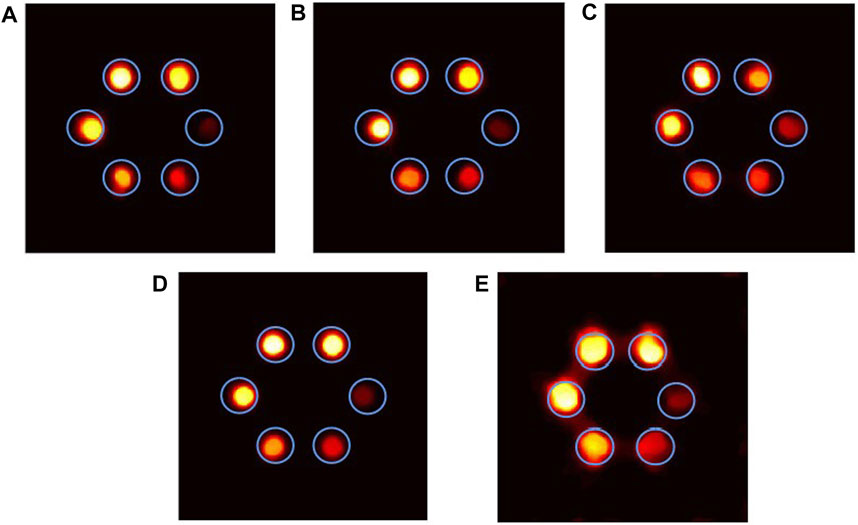
FIGURE 5. Reconstructed images of different materials by the optimized EM-TV algorithm (iterating 10 times): (A) Pt, (B) Bi, (C) Gd, (D) Ru, and (E) Au.
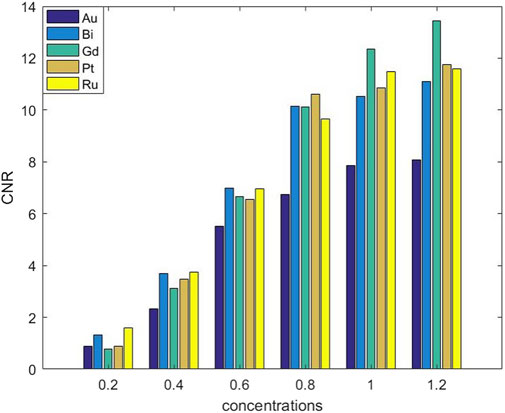
FIGURE 6. CNR of various contrast agents’ reconstructed images.
For different fluorescent materials, the fluorescence efficiency is an important factor. The average value of each ROI is to be represented by its fluorescence photons, exploring the fluorescence efficiency. We fit the variation of the ROI average value with concentration and use its slope to characterize its fluorescence efficiency. Figures 7–11 shows the fitted curves of different contrast agents. Gd has the highest fluorescence efficiency, followed by Bi, and Ru has the lowest fluorescence efficiency. Considering CNR and fluorescence efficiency, Bi as the contrast agent is optimal.
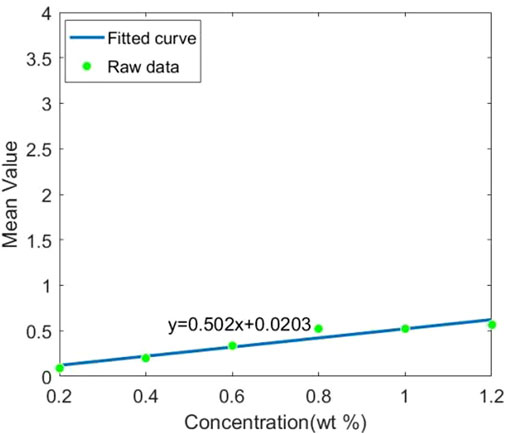
FIGURE 7. Fluorescence efficiency of Pt.
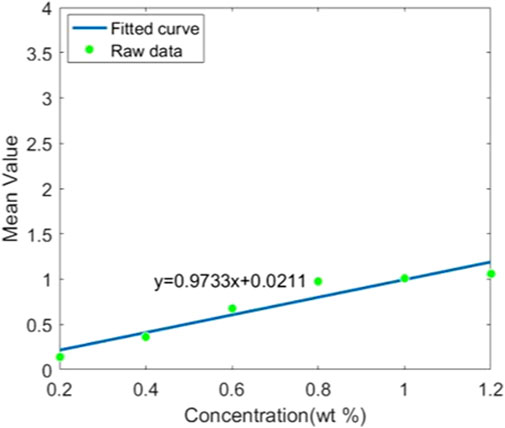
FIGURE 8. Fluorescence efficiency of Bi.
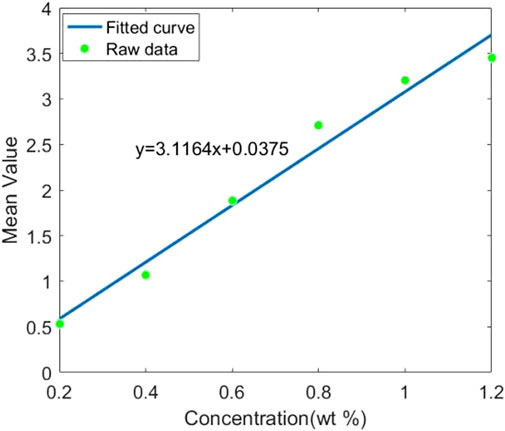
FIGURE 9. Fluorescence efficiency of Gd.
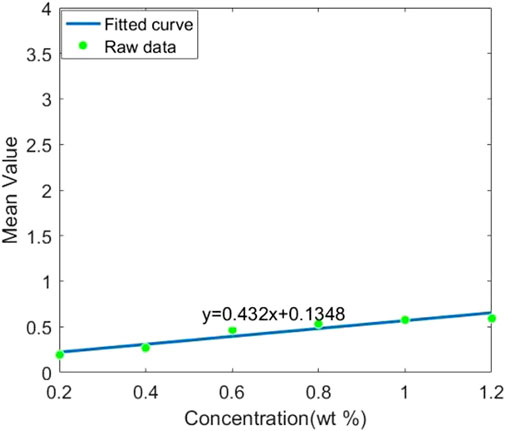
FIGURE 10. Fluorescence efficiency of Ru.
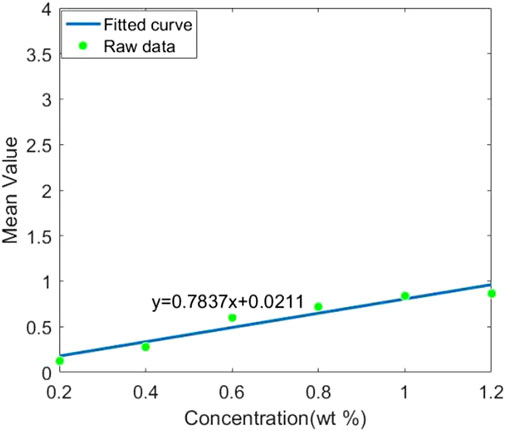
FIGURE 11. Fluorescence efficiency of Au.
The above experiments show that Bi has a good performance. In order to further explore its imaging potential, we change the concentration as shown in Figure 12 (low-concentration phantom, LCP) and adjust the collimated hole radius to 0.8 and 0.7 mm (originally 1 mm). The reconstructed images of optimized EM-TV are shown in Figures 13A–C.
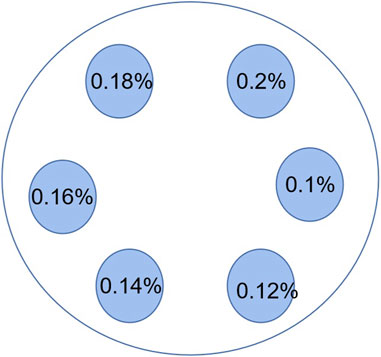
FIGURE 12. Low-concentration phantom (Phantom 2).

FIGURE 13. Reconstructed images of different collimated pinholes: (A) 0.7 mm, (B) 0.8 mm, (C) 1 mm, and (D) CNR of reconstructed images under different pinholes.
For the image with a small hole radius of 1 mm, the ROI is the brightest, which is the best image among the three apertures. It can also be concluded that the aperture with 1 mm size can get the best result in terms of CNR for detecting low concentrations, and the minimum detection limit is 0.12%; for 0.14, 0.16, and 0.2%, the aperture 0.07 mm performs best; at 0.18%, the aperture 0.08 mm performs best.
The shortcoming of this experiment is that we do not take the self-absorption effect into consideration that makes the reconstructed image distorted slightly. And for the fmpc-XFCT system, it may get the worst performance when the concentration of contrast agent reaches a relatively low level, that is, <0.1%.
We simulated Pt, Bi, Gd, Ru, and Au as the fluorescent materials of the fast XFCT imaging system. Gd has the highest fluorescence efficiency, and the quality of the reconstructed images is the best for high concentration, and the performance is poor for low concentration, so it can be used to detect the tumor shape when the concentration is high to determine the treatment plan; Pt and Ru perform well in concentration resolution, but their low fluorescence efficiency limits their detection effect; for Au as an contrast agent, its reconstructed images’ quality limits the application; and Bi performs well in image quality and fluorescence efficiency. Therefore, Bi is a highly potential fluorescent material. In addition, the solubility of the Bi mixture is small in most solvents. Therefore, after entering the human body as a drug, it is not easy to penetrate into the human tissue and most can be metabolized easily, making it suitable for in vivo imaging.
The original contributions presented in the study are included in the article/Supplementary Material; further inquiries can be directed to the corresponding authors.
The research was designed by LY, FP, and ZY, and the research funds were provided by FP, AK, ZY, and HP. The experiments were made by LY and ZR. The manuscript was written by LY and revised by FP, YS, and ZX.
This work was partially supported by the National Key R and D Program of China (2019YFC0605203), Chongqing Basic Research and Frontier Exploration Project (cstc2020jcyj-msxmX0553), the Fundamental Research Funds for the Central Universities (2020CDJ-LHZZ-075 and 2019CDYGYB019), the Scientific and Technological Research Program of Chongqing Municipal Educational Commission (No. KJQN201904007), Chongqing Postgraduate Research and Innovation Project (CYS21133 and CYB21059), and ICT NDT Engineering Research Center Fund of Chongqing University.
The authors declare that the research was conducted in the absence of any commercial or financial relationships that could be construed as a potential conflict of interest.
The authors thank Guo Jing and QI Wei, for the guidance on experimental procedures and computer configuration. And the authors thank Ma Yinjin for the help of English writing.
1. Ricketts K, Guazzoni C, Castoldi A, Royle G. A Bench-Top K X-ray Fluorescence System for Quantitative Measurement of Gold Nanoparticles for Biological Sample Diagnostics. Nucl Instr Methods Phys Res Section A: Acc Spectrometers, Detectors Associated Equipment (2016) 816:25–32. doi:10.1016/j.nima.2016.01.084
2. Li L, Zhang S, Li R. Full-field Fan-Beam X-ray Fluorescence Computed Tomography with a Conventional X-ray Tube and Photon-Counting Detectors for Fast Nanoparticle Bioimaging[J]. Opt Eng (2017) 56(4)):043106. doi:10.1117/1.oe.56.4.043106
3. Deng L, Wei B, He P, Zhang Y, Feng P. A Geant4-Based Monte Carlo Study of a Benchtop Multi-Pinhole X-ray Fluorescence Computed Tomography Imaging. Int J Nanomedicine (2018) Vol. 13:7207–16. doi:10.2147/ijn.s179875
4. Feng P, Cong W, Wei B, Wang G. Analytic Comparison between X-ray Fluorescence CT and K-Edge CT. IEEE Trans Biomed Eng (2014) 61(3):975–85. doi:10.1109/TBME.2013.2294677
5. Zhang H. Progress in Drug Prevention and Treatment of Contrast-Medium Nephropathy[J]. Mod Med J China (2019) 21(11):105–8. doi:10.3969/j.issn.1672-9463.2019.11.030
6. Liu L, Zhou X, Liu H, Ding N. Attenuation Correction of Polychromatic L-Shell X-ray Fluorescence Computed Tomography Imaging. J Nucl Sci Technol (2019) 56(5):376–84. doi:10.1080/00223131.2019.1585985
7. Zhang W, Zhang S, Gao P, Lan B, Li L, Zhang X. The Feasibility of NaGdF 4 Nanoparticles as an X‐ray Fluorescence Computed Tomography Imaging Probe for the Liver and Lungs. Med Phys (2020) 47(2):662–71. doi:10.1002/mp.13930
8. Li Y, Shaker K, Martin S, Vogt C, Hertz HM, Toprak MS. Synthesis and Cytotoxicity Studies on Ru and Rh Nanoparticles as Potential X-Ray Fluorescence Computed Tomography (XFCT). Contrast Agents[j] Nanomater (2020) 10(2). doi:10.3390/nano10020310
9. Li Y, Shaker K, Jakob CL, Vogt C, Hans MH, Muhammet MT. A Library of Potential Nanoparticle Contrast Agents for X-Ray Fluorescence Tomography Bioimaging. [J] Contrast Media Mol Imaging (2018) 2018:1–7. doi:10.1155/2018/8174820
10. Luo Y, Feng P, Guo J, Zhao R, He P, Wei B. Simulation Research of Multi-Pinhole Collimated L-Shell XFCT Imaging System. IEEE Access (2020) 8:180273–9. doi:10.1109/access.2020.3028066
11. Guo J, Peng F, Deng L. Optimization of Detection Angle for Pinhole X-ray Fluorescence Computed Tomography[J]. Acta Optica Sinica (2020) 40(1):237–45. doi:10.3788/AOS202040.0111017
12. Akiba M, Yuasa T. Reconstruction Method for Fluorescent X-ray Computed Tomography by Least-Squares Method Using Singular Value Decomposition[J]. IEEE Trans Nucl Sci (1997) 44(1):54–62. doi:10.1109/23.554824
13. Zhang S, Li L, Chen Z. Acceleration of the Scattering Noise Model Based Image Reconstruction Algorithm for XFCTIEEE Nuclear Science Symposium and Medical Imaging Conference. Manchester, United Kingdom: NSS/MIC) (2019).2019 p. 1–3.
14. Ma D, Wolf P, Clough AV, Schmidt TG. The Performance of MLEM for Dynamic Imaging from Simulated Few-View, Multi-Pinhole SPECT. IEEE Trans Nucl Sci (2013) 60(1):115–23. doi:10.1109/tns.2012.2214235
15. Xia W, Lu Z, Huang Y, Liu Y, Chen H, Zhou J. CT Reconstruction with PDF: Parameter-Dependent Framework for Data from Multiple Geometries and Dose Levels. IEEE Trans on Medical Imaging 2021 doi:10.1109/TMI.2021.3085839
16. Fayed N, Morales H, Modrego PJ, Pina MA. Contrast/Noise Ratio on Conventional MRI and Choline/Creatine Ratio on Proton MRI Spectroscopy Accurately Discriminate Low-Grade from High-Grade Cerebral Gliomas. Acad Radiol (2006) 13(6):728–37. doi:10.1016/j.acra.2006.01.047
17. Hsieh H, Hsiao L. Image Reconstructions from Limit Views and Angle Coverage Data for a Stationary Multi-Pinhole SPECT System. Tinshhua Sci Technol (2010) 15(1):44–9. doi:10.1016/s1007-0214(10)70007-9
Keywords: fmpc-XFCT system, contrast agents, CNR, fluorescence efficiency, lowest concentration
Citation: Yan L, Peng F, Ruge Z, Yi Z, Kang A, Peng H, Shenghao Y and Xiansheng Z (2021) Simulation Research of Potential Contrast Agents for X-Ray Fluorescence CT with Photon Counting Detectors. Front. Phys. 9:686988. doi: 10.3389/fphy.2021.686988
Received: 28 March 2021; Accepted: 10 June 2021;
Published: 02 July 2021.
Edited by:
Liang Li, Tsinghua University, ChinaCopyright © 2021 Yan, Peng, Ruge, Yi, Kang, Peng, Shenghao and Xiansheng. This is an open-access article distributed under the terms of the Creative Commons Attribution License (CC BY). The use, distribution or reproduction in other forums is permitted, provided the original author(s) and the copyright owner(s) are credited and that the original publication in this journal is cited, in accordance with accepted academic practice. No use, distribution or reproduction is permitted which does not comply with these terms.
*Correspondence: Feng Peng, Y29lLWZwQGNxdS5lZHUuY24=; He Peng, cGVuZ2hlQGNxdS5lZHUuY24=
Disclaimer: All claims expressed in this article are solely those of the authors and do not necessarily represent those of their affiliated organizations, or those of the publisher, the editors and the reviewers. Any product that may be evaluated in this article or claim that may be made by its manufacturer is not guaranteed or endorsed by the publisher.
Research integrity at Frontiers
Learn more about the work of our research integrity team to safeguard the quality of each article we publish.