 Mikko J. Alava1,2*
- 1Department of Applied Physics, Aalto University, Espoo, Finland
- 2NOMATEN Centre of Excellence, National Centre for Nuclear Research, Otwock-Swierk, Poland
An important question in the theory of fracture is what kind of lifetime distributions may exist for materials under load. Here, this is studied in the context of a one-dimensional fracture model with local load sharing under a constant external load, “creep.” Simulations of the system with Weibull distributed initial lifetimes for the elements show that the limiting distribution follows from extreme statistics and takes the Gumbel form eventually, with longer and longer crossovers in the system size from a Weibull-like distribution, depending on the initial Weibull exponent.
1 Introduction
The statistics of strength is a classical problem in statistical fracture mechanics and is also realized to be very closely related to concepts in statistical physics such as percolation and scaling [1–3]. The main mathematical tool of the statistics of extremes [4] may be translated into the language of renormalization: the classes of limiting distributions, their basins of attraction, and the rate of convergence with increasing sample size [5, 6]. Another example of the close relationship arises from the depinning of cracks and the finite-size corrections and scaling of the critical stress or sample strength.
In brittle fracture, simple models have brought together a comprehensive understanding of the predictions of statistical physics [7]. This concerns the role of disorder, the phase diagrams for the statistics, and the interaction of cracks with disorder. An important point is the role of loading as in tensile failure and in the propagation of cracks, the physics is different from compressive loading with the formation of shear bands, self-averaging, and changing effective elastic interactions. Similar ideas of scaling have also been applied to the question of fracture lifetimes [8–14]. In the case of brittle quasi-static failure rheology or time-dependent physics being absent by definition, one can invert the problem by simply upscaling from the representative volume—element level. Correspondingly, given the lifetime distribution with a certain local stress (history), the exercise becomes to understand how or when a bigger sample fails taking into account the interactions (load sharing) in the sample.
The goal of this note is to study a typical model of the time-dependence of fracture. We start from an initially Weibull-like microscopic failure time distribution and evolve it using local load sharing (“growth of microcracks”). The setup is that of creep under a constant load applied to the system. The main features of this model are the quasi-brittle behavior of the elements—constant load-carrying capacity—until failure and the lack of plasticity or the irrelevance of strain as a quantity. Also, it assumes Markovian local behavior: each element has a remaining lifetime, which depends on the local stress level, and when local stress enhancements lead to an elevated stress, the local lifetime is consequently shortened. This means that the original sample-dependent element lifetime distribution changes with element failures due to the local stress enhancements. The process is qualitatively similar to what happens in lattice models of brittle failure with quenched thresholds, in that the series of element failures is dictated by the disorder and the buildup of stresses.
The next section explains the model used. Section 3 outlines the results, and Section 4 finishes with a brief discussion.
2 Model
We resort to a variant of 1D fiber bundle models with local load sharing [15]. The main point of the dynamics is a local lifetime rescaling rule which is defined by an exponent ρ [16–23]. In concrete terms, this means that when one re-evaluates the remaining lifetime
and this in particular applies at each fiber break; one sees that for those fibers where the load sharing brings no increment in the local stress, the remaining lifetime stays the same. This amounts to a Markovian dynamics in that the past history of loading is reflected only in the current remaining fiber lifetime. To recapitulate, the rule accounts for the lifetimes for the remaining lifetimes, and after each break, the load of the broken fiber is equally divided to the nearest intact neighbors and their lifetimes are recomputed. Then, the smallest lifetime of the remaining ones is identified, and the current value sample lifetime evolves to that. In the end, there will be a runaway effect when a catastrophic crack is nucleated and starts to grow, which is illustrated in Figure 1.
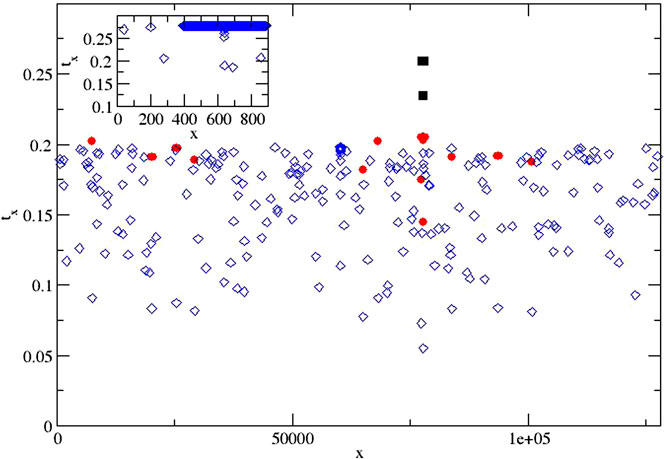
FIGURE 1. Activity plots of failure: three cases of activity plots, failed element location per time step, for large systems (
For the initial fiber lifetime distribution, we use for the same purpose a Weibullian distribution characterized by the same exponent ρ. Time-dependent fiber bundle models of this type—and more complicated lattice models—have been studied to a great detail. The main features of these are the potential role of 2- or 3-dimensional geometry (“damage clusters”) compared to 1 dimension—which we neglect—and the change in the fracture characteristics with the ρ-exponent. Obviously, a higher value of ρ makes the expected behavior more brittle-like, whereas the opposite limit of ρ being small exhibits in analogy to the example of the static slow fracture case features of percolation and extensive damage, and the limiting statistics of lifetimes becomes Gaussian.
3 Results
The basic behavior behind the lifetime statistics is depicted in Figure 1, where we show how ρ influences the localization of damage. The figure depicts the failure time for each fiber, so there are 1,000 (inset) and 128,000 symbols for the failure time vs. location. For very brittle systems that fail at one point, the symbols are very clustered and difficult to tell apart. For small N and large ρ, the initial damage is able to localize the development of a crack that will span the system. The opposite case then clearly shows that the initial failures are not determining the failure location or time: the system can tolerate some damage. The figure also shows clearly how the finite size, N, influences the damage and lifetime. Localization is inhibited for smaller ρ for N large.
Plotting the averaged lifetimes for various N and ρ leads to the results shown in Figure 2. We see that a semilogarithmic plot fits the three cases so that the smallest ρ = 4 follows best this kind of scaling, instead of a Weibullian
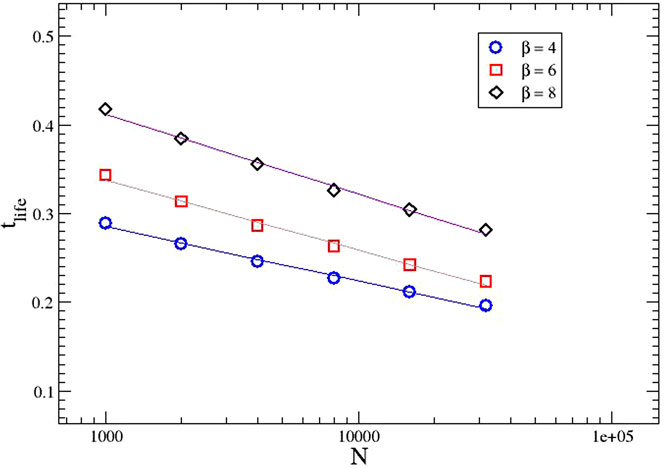
FIGURE 2. Lifetime size effects: average lifetime
To this end, it is instructive to consider in detail the relation of the weakest element and the smallest element lifetime
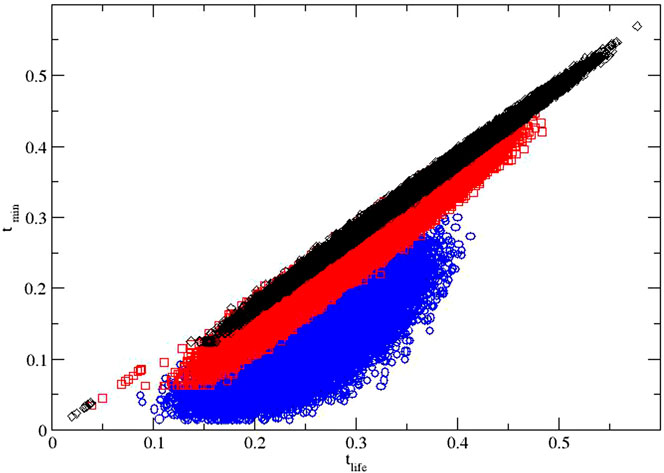
FIGURE 3. Correlations of failure times: the statistics of actual lifetimes vs. the first failure times (
A further step is to fit a slope to each different data set (N) separately. Values of (close to) unity imply such linear proportionality between
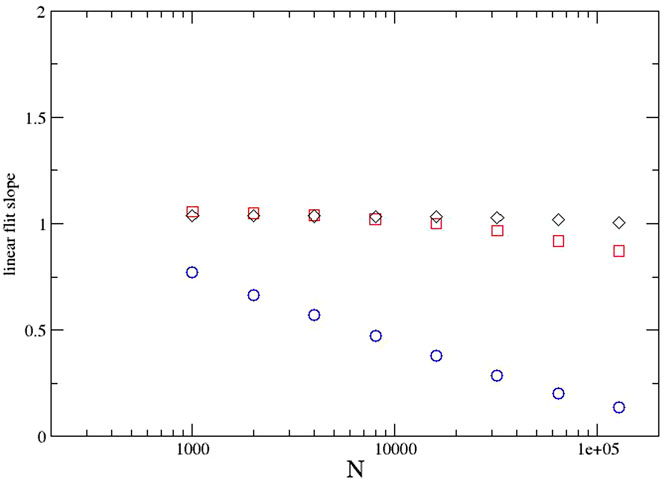
FIGURE 4. Evolution from the Weibull distribution: the slope of
We finally consider in detail a Gumbel-like plot of ρ = 4 data. Figure 5 shows the data in the way that illustrates potentially the double exponential (Gumbel) nature of the cumulative distribution
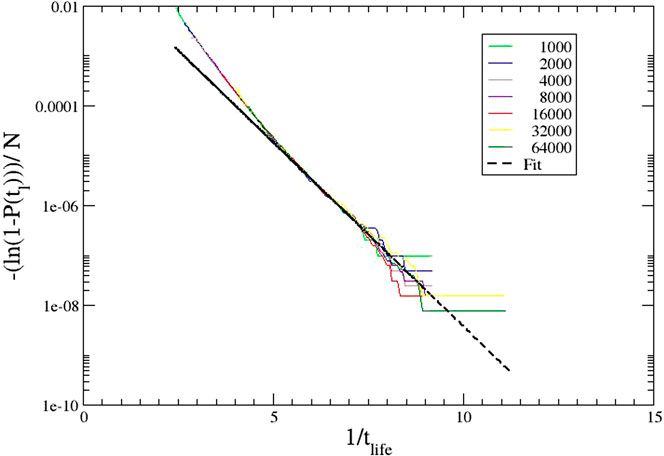
FIGURE 5. Gumbel-like behavior: the cumulative lifetime distributions
4 Conclusions
Here, we have studied the possibility of obtaining the Gumbel distribution as the limiting behavior for a fiber bundle model of time-dependent failure, where the microscopic distribution for elements follows the Weibull distribution. The answer is yes, and that is due to the impact of microcrack formation and damage tolerance. For stronger disorder, the “samples” split into sub-volumes where the growth of microcracks determines the local strength in a way that makes the Weibull distribution irrelevant, at least in the limit of large system size.
In this limit, we get the typical logarithmic behavior of the Gumbel class in regard to the scaling (decrease) of the lifetime with system size. The shape of the distribution reflects the one-dimensional nature of the model. It would be interesting to look at the limit p→1, the limit of extensive damage.
Data Availability Statement
The raw data supporting the conclusion of this article will be made available by the authors, without undue reservation.
Author Contributions
The author confirms being the sole contributor of this work and has approved it for publication.
Funding
We acknowledge the financial support from the Academy of Finland through the project FLUFRA (No. 317464) and from the European Union Horizon 2020 research and innovation programme under grant agreement No. 857470 and from European Regional Development Fund via Foundation for Polish Science International Research Agenda PLUS programme Grant No. MAB PLUS/2018/8.
Conflict of Interest
The author declares that the research was conducted in the absence of any commercial or financial relationships that could be construed as a potential conflict of interest.
Acknowledgments
We acknowledge the computational resources provided by the Aalto University School of Science “Science-IT” project.
References
2. Duxbury PM, Leath PL, Beale PD. Breakdown Properties of Quenched Random Systems: The Random-Fuse Network. Phys Rev B (1987) 36:367–80. doi:10.1103/physrevb.36.367
3. Alava MJ, Nukala PKVV, Zapperi S. Statistical Models of Fracture. Adv Phys (2006) 55:349–476. doi:10.1080/00018730300741518
5. Manzato C, Shekhawat A, Nukala P, Alava M, Sethna J, Zapperi S. Phys Rev Lett (2012) 108:065504. doi:10.1103/physrevlett.108.065504
6. Bertalan Z, Shekhawat A, Sethna JP, Zapperi S. Phys Rev Appl (2014) 2:034008. doi:10.1103/physrevapplied.2.034008
7. Alava MJ, Nukala PKVV, Zapperi S. Size Effects in Statistical Fracture. J Phys D: Appl Phys (2009) 42:214012. doi:10.1088/0022-3727/42/21/214012
8. Voight B. A Relation to Describe Rate-dependent Material Failure. Science (1989) 243:200–3. doi:10.1126/science.243.4888.200
9. Leocmach M, Perge C, Divoux T, Manneville S. Creep and Fracture of a Protein Gel under Stress. Phys Rev Lett (2014) 113:038303. doi:10.1103/PhysRevLett.113.038303
10. Guarino A, Ciliberto S, Garcimartın A, Zei M, Scorretti R. Failure Time and Critical Behaviour of Fracture Precursors in Heterogeneous Materials. Eur Phys J B (2002) 26:141–51. doi:10.1140/epjb/e20020075
11. Mahesh S, Phoenix SL. Lifetime Distributions for Unidirectional Fibrous Composites under Creep-Rupture Loading. Int J Fracture (2004) 127:303–60. doi:10.1023/b:frac.0000037675.72446.7c
12. Bazant ZP, Le JL, Bazant MZ. Scaling of Strength and Lifetime Probability Distributions of Quasibrittle Structures Based on Atomistic Fracture Mechanics. Proc Natl Acad Sci U S A (2009) 106:11484–9. doi:10.1073/pnas.0904797106
13. Mattsson A, Uesaka T. Time-dependent Statistical Failure of Fiber Networks. Phys Rev E Stat Nonlin Soft Matter Phys (2015) 92:042158. doi:10.1103/PhysRevE.92.042158
14. Santucci S, Vanel L, Ciliberto S. Subcritical Statistics in Rupture of Fibrous Materials: Experiments and Model. Phys Rev Lett (2004) 93:095505. doi:10.1103/PhysRevLett.93.095505
15. Pradhan S, Hansen A, Chakrabarti BK. Failure Processes in Elastic Fiber Bundles. Rev Mod Phys (2010) 82:499–555. doi:10.1103/revmodphys.82.499
16. Coleman BD. Application of the Theory of Absolute Reaction Rates to the Creep Failure of Polymeric Filaments. J Polym Sci (1956) 20:447–55. doi:10.1002/pol.1956.120209604
17. Coleman BD. Time Dependence of Mechanical Breakdown in Bundles of Fibers. I. Constant Total Load. J Appl Phys (1957) 28:1058–64. doi:10.1063/1.1722907
18. Coleman BD. Statistics and Time Dependence of Mechanical Breakdown in Fibers. J Appl Phys (1958) 29:968–83. doi:10.1063/1.1723343
20. Phoenix SL, Tierney L-J. A Statistical Model for the Time Dependent Failure of Unidirectional Composite Materials under Local Elastic Load-Sharing Among Fibers. Eng Fracture Mech (1983) 18:193–215. doi:10.1016/0013-7944(83)90107-8
21. Harlow DG, Phoenix SL. The Chain-Of-Bundles Probability Model for the Strength of Fibrous Materials I: Analysis and Conjectures. J Compos Mater (1978) 12:195–214. doi:10.1177/002199837801200207
22. Wu BQ, Leath PL. Failure Probabilities and Tough-Brittle Crossover of Heterogeneous Materials with Continuous Disorder. Phys Rev B (1999) 59:4002–10. doi:10.1103/physrevb.59.4002
Keywords: fracture, fiber bundle, strength distribution, extreme value statistical distributions, time-dependent failure
Citation: Alava MJ (2021) Crossover of Failure Time Distributions in a Model of Time-Dependent Fracture. Front. Phys. 9:686195. doi: 10.3389/fphy.2021.686195
Received: 26 March 2021; Accepted: 19 May 2021;
Published: 28 June 2021.
Edited by:
Ferenc Kun, University of Debrecen, HungaryReviewed by:
Alex Hansen, Norwegian University of Science and Technology, NorwayBikas K. Chakrabarti, Saha Institute of Nuclear Physics (SINP), India
Copyright © 2021 Alava. This is an open-access article distributed under the terms of the Creative Commons Attribution License (CC BY). The use, distribution or reproduction in other forums is permitted, provided the original author(s) and the copyright owner(s) are credited and that the original publication in this journal is cited, in accordance with accepted academic practice. No use, distribution or reproduction is permitted which does not comply with these terms.
*Correspondence: Mikko J. Alava, bWlra28uYWxhdmFAbmNiai5nb3YucGw=