- 1Physique et Mécanique des Milieux Hétérogènes, PMMH UMR 7636 CNRS, ESPCI Paris, PSL Research University, Université de Paris, Sorbonne Université, Paris, France
- 2Sibley School of Mechanical and Aerospace Engineering, Cornell University, Ithaca, NY, United States
- 3Laboratoire de Physique de L’Ecole Normale Supérieure, UMR 8550 CNRS, PSL Research University, Université de Paris, Sorbonne Université, Paris, France
Turbulent flows over wavy surfaces give rise to the formation of ripples, dunes and other natural bedforms. To predict how much sediment these flows transport, research has focused mainly on basal shear stress, which peaks upstream of the highest topography, and has largely ignored the corresponding pressure variations. In this article, we reanalyze old literature data, as well as more recent wind tunnel results, to shed a new light on pressure induced by a turbulent flow on a sinusoidal surface. While the Bernoulli effect increases the velocity above crests and reduces it in troughs, pressure exhibits variations that lag behind the topography. We extract the in-phase and in-quadrature components from streamwise pressure profiles and compare them to hydrodynamic predictions calibrated on shear stress data.
1 Introduction
Most natural flows occur on evolving topography. The resulting hydrodynamic variations are described by a linear theory that Jackson and Hunt [1] developed for wind profiles over low hills. Their work inspired analyses of laminar [2–6] and turbulent [7–18] flows on shallow bedforms, as recently reviewed by Finnigan et al. [19]. Flow modulation associated with fluid-structure interactions also drives the dynamics of wind-driven wave generation at a liquid surface [20, 21], or on compliant thin sheets [22–24], leading to the flag instability when a free end is allowed to flap [25].
Most studies of fluid motion on wavy surfaces have focused on basal shear stress, which drives sediment transport [26]. As Charru et al [27] reviewed, coupling the latter to the Jackson and Hunt theory or its variants [10, 13] explains the formation of erodible objects like sand ripples and dunes, which owe their initial growth to a basal shear stress peaking upstream of the highest elevation.
However, basal pressure is also affected by evolving topography. In porous sand beds, streamwise pressure variations produce an internal flow that drives humidity and microscopic particles below the surface [28]. With strong enough winds, the resulting pore pressure can also relieve part of the bed weight, thereby facilitating the onset of its erosion [29]. At much larger scale, topography-induced pressure variations are important to atmospheric science, especially mountain meteorology [30, 31].
Relatively few experiments conducted in air [29, 32–39], water or other liquids [40–48] flowing over wavy surfaces staged harmonic bedforms with low enough ratio of amplitude ζ and wavelength λ to avoid flow detachment. This has made it difficult to compare data with linear theories predicated on small
When fluid flowing on a flat surface reaches an ascending bedform, the narrowing of streamlines raises speed and decreases static pressure, as predicted by energy conservation in the Bernoulli equation. To leading order, this effect is captured by dimensionless coefficients
Our objective is to review articles reporting pressure measurements on wavy surfaces subject to a turbulent flow. As we will discuss, existing data [29, 36, 37, 47, 56] suggest that the anomalous transition in shear stress may also arise in the pressure response. However, we recognize that the corresponding experiments, which were not designed to address this question, do not support a definitive conclusion. In the context of the anomalous transition, a crucial shortcoming of these experiments is their determination of
2 Turbulent Flow Over A Wavy Bed
Because our main objective is to reanalyze existing data for turbulent flows over wavy beds, this section does not repeat our own derivations of the underlying theory, but rather provides a summary of key quantities and concepts. To account for the hydrodynamic anomaly, the framework of Fourrière, et al. [9, 10] was recently extended, as detailed in [27, 51]. We examine a turbulent fluid flow along the x direction, unbounded vertically and driven by a shear stress
where
In this framework, hydrodynamics is described by Reynolds-averaged Navier-Stokes equations governing the mean velocity field
where
In Eq. 2,
Charru, et al. [27] calibrated this additional equation with
Here,
Similarly, we write the basal pressure response
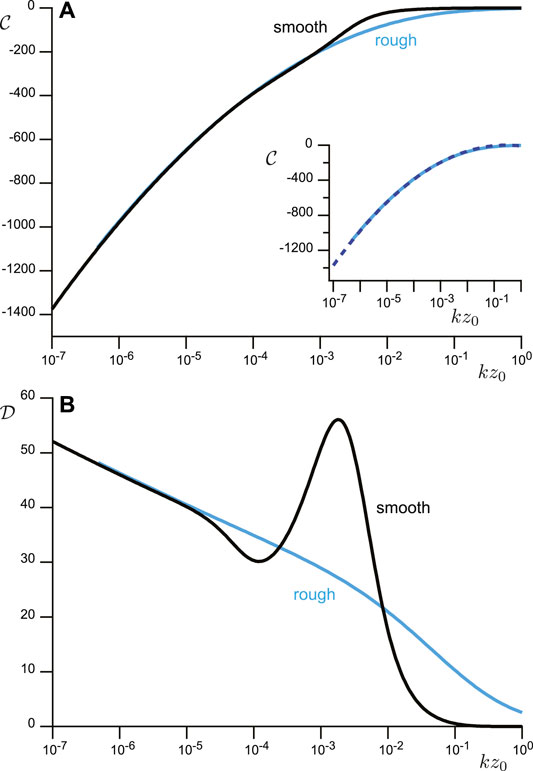
Figure 1 shows how

FIGURE 1. Basal pressure coefficients in terms of the rescaled wavenumber
3 Pressure Measurements Over Wavy Surfaces
In this section, we compare theoretical predictions to available experimental data. We first outline how to fit the recorded pressure profiles. Then, for each set, we discuss how this procedure yields
3.1 Fitting Procedure
Because the theory is built on a linear analysis of hydrodynamic equations, we restrict attention to data sets with a harmonic pressure response to topographical variations at low
but we infer

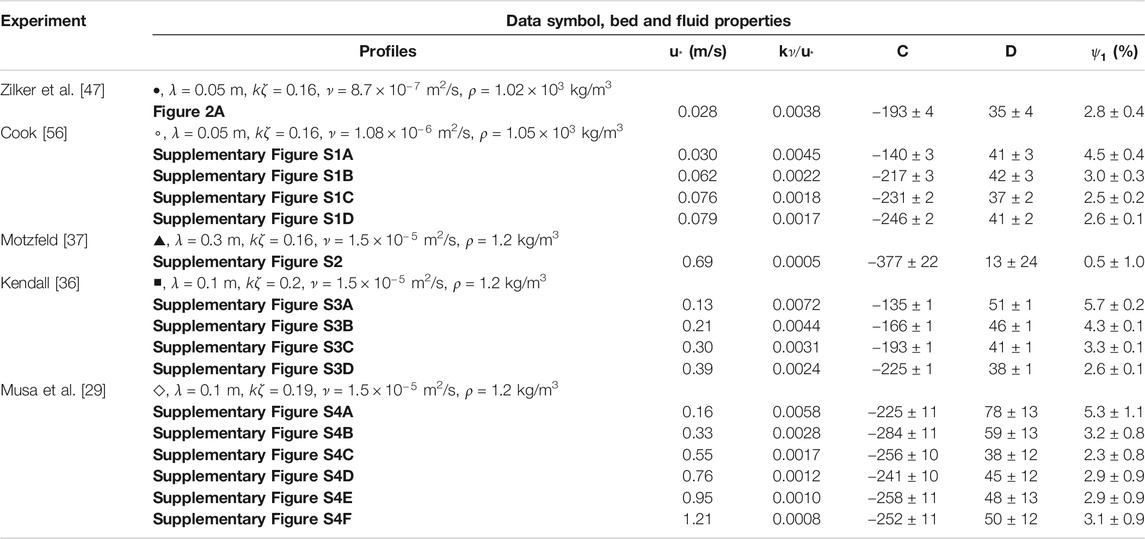
TABLE 1. Experimental conditions and values of

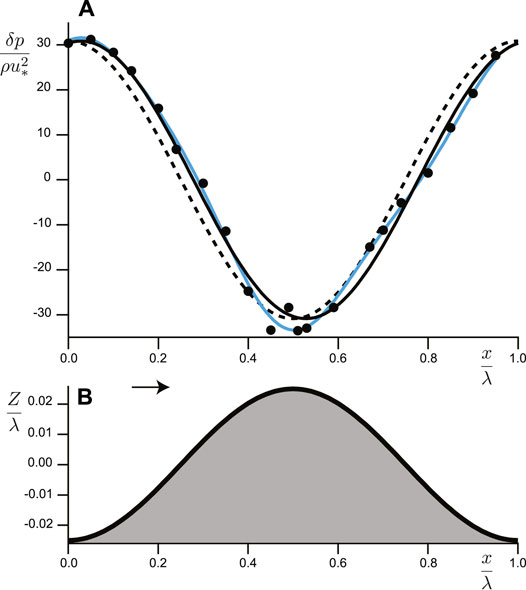
FIGURE 2. Pressure measurements from [47]. Table 1 lists experimental conditions, and
For the data sets under consideration, the second and third terms have amplitudes
Uncertainties in
3.2 Zilker et al. and Cook
We first review experiments reported in [47], which were used to compare predictions for basal shear stress and related behavior of
As Figure 2 shows for
3.3 Motzfeld and Kendall
We analyzed experiments performed in wind tunnels over smooth solid sinusoidal waves. The oldest work is Motzfeld’s [37], who staged four different bed profiles carved in plaster and varnished. To stay within reach of the linear assumption, we only exploited his data for the smallest amplitude (his ‘model I’ with
The other wind tunnel data are Kendall’s [36], who studied turbulent flows over mobile and immobile waves on a rubber surface. We only considered his immobile sinusoidal bed (
Motzfeld [37] and Kendall [36] both inferred shear velocity from logarithmic fits of vertical velocity profiles. However, Kendall fitted
3.4 Musa et al
Musa et al. [29] also acquired data on sinusoidal, smooth, rigid walls in the wind tunnel (

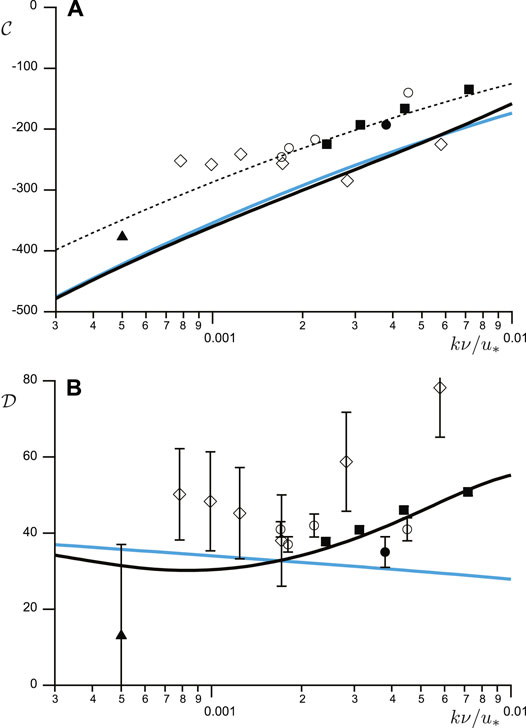
FIGURE 3. Pressure coefficients
4 Discussion and Concluding Remarks
Table 1 summarizes conditions of all available experiments on smooth walls with nearly harmonic response, and the resulting
Figure 3 shows corresponding variations with the rescaled wavenumber
At first glance, Figure 3 suggests that
Overall,
A second issue is non-linear effects. Weakly non-linear developments [9, 62] and measurements [10] suggest that
These observations call for more measurements, particularly in the range
Finally, DNS or LES simulations would also constitute another source of data, since runs could be performed with strictly imposed values of
The evolution of pressure on geophysical bedforms such as sand ripples creates an internal seepage flow that brings nutrients to the liveforms they shelter [68], and it provides a mechanism for the accumulation of moisture or dust within them [28]. The phase lag that is proportional to
We thank F. Charru, O. Durán and A. Fourrière for fruitful discussions. This research was supported in part by the National Science Foundation under Grant No. NSF PHY-1748958, since it was initiated at KITP (Santa Barbara, United States) during the conference on Particle-Laden Flows in Nature (16–22 December, 2013), as part of the program “Fluid-mediated particle transport in geophysical flows.” This work has benefited from the financial support of the Agence Nationale de la Recherche, grant “Zephyr” No. ERCS07 18. MYL’s contribution was made possible by the support of NPRP grant 6–059-2-023 from the Qatar National Research Fund.
Data Availability Statement
Publicly available datasets were analyzed in this study. This data can be found here: The data are available in the cited references.
Author Contributions
All authors contributed equally to this work.
Conflict of Interest
The authors declare that the research was conducted in the absence of any commercial or financial relationships that could be construed as a potential conflict of interest.
Supplementary Material
The Supplementary Material for this article can be found online at: https://www.frontiersin.org/articles/10.3389/fphy.2021.682564/full#supplementary-material
References
1. Jackson PS, Hunt JCR. Turbulent Wind Flow over a Low Hill. Q.J R Met. Soc. (1975) 101:929–55. doi:10.1002/qj.49710143015
2. Benjamin TB. Shearing Flow over a Wavy Boundary. J Fluid Mech (1959) 6:161–205. doi:10.1017/s0022112059000568
3. Bordner GL. Nonlinear Analysis of Laminar Boundary Layer Flow over a Periodic Wavy Surface. Phys Fluids (1978) 21:1471–64. doi:10.1063/1.862409
4. Buckles J, Hanratty TJ, Adrian RJ. Turbulent Flow over Large-Amplitude Wavy Surfaces. J Fluid Mech (1984) 140:27–44. doi:10.1017/s0022112084000495
5. Caponi EA, Fornberg B, Khight DD, McLean JW, Saffman PG, Yuen HC. Calculations of Laminar Viscous Flow over a Moving Wavy Surface. J Fluid Mech (1982) 124:247–62. doi:10.1017/s0022112082002535
6. Lagrée P-Y. A Triple Deck Model of Ripple Formation and Evolution. Phys Fluids (2003) 15:2355–68. doi:10.1063/1.1588305
7. Belcher SE, Hunt JCR. Turbulent Flow over Hills and Waves. Annu Rev Fluid Mech (1998) 30:507–38. doi:10.1146/annurev.fluid.30.1.507
8. Britter RE, Hunt JCR, Richards KJ. Air Flow over a Two-Dimensional Hill: Studies of Velocity Speed-Up, Roughness Effects and Turbulence. Q.J.R Meteorol Soc (1981) 107:91–110. doi:10.1002/qj.49710745106
9. Fourrière A. Morphodynamique des rivières, sélection de largeur, rides et dunes (River morphodynamics : Width selection, ripples and dunes). Ph.D. thesis: Université Paris Diderot (2009). Available from: https://pastel.archives-ouvertes.fr/pastel-00005562 (Accessed March 2, 2009).
10. Fourrière A, Claudin P, Andreotti B. Bedforms in a Turbulent Stream: Formation of Ripples by Primary Linear Instability and of Dunes by Nonlinear Pattern Coarsening. J Fluid Mech (2010) 649:287–328. doi:10.1017/s0022112009993466
11. Hunt JCR, Leibovich S, Richards KJ. Turbulent Shear Flows over Low Hills. Q.J R Met. Soc. (1988) 114:1435–70. doi:10.1002/qj.49711448405
12. Kobayashi N, Madsen OS. Turbulent Flows over a Wavy Bed. J Geophys Res (1985) 90:7323–31. doi:10.1029/jc090ic04p07323
13. Kroy K, Sauermann G, Herrmann HJ. Minimal Model for Aeolian Sand Dunes. Phys Rev E (2002) 66:031302. doi:10.1103/physreve.66.031302
14. Luchini P, Charru F. Quasilaminar Regime in the Linear Response of a Turbulent Flow to Wall Waviness. Phys Rev Fluids (2017) 2(R):012601. doi:10.1103/physrevfluids.2.012601
15. Sykes RI. An Asymptotic Theory of Incompressible Turbulent Boundarylayer Flow over a Small Hump. J Fluid Mech (1980) 101:647–70. doi:10.1017/s002211208000184x
16. Taylor PA. Some Numerical Studies of Surface Boundary-Layer Flow above Gentle Topography. Boundary-layer Meteorol (1977) 11:439–65. doi:10.1007/bf02185870
17. Taylor PA. Numerical Studies of Neutrally Stratified Planetary Boundary-Layer Flow above Gentle Topography. Boundary-layer Meteorol (1977) 12:37–60. doi:10.1007/bf00116397
18. Taylor PA, Mason PJ, Bradley EF. Boundary-layer Flow over Low Hills. Boundary-layer Meteorol (1987) 39:107–32. doi:10.1007/bf00121870
19. Finnigan J, Ayotte K, Harman I, Katul G, Oldroyd H, Patton E, et al. Boundary-layer Flow over Complex Topography. Boundary-layer Meteorol (2020) 177:247–313. doi:10.1007/s10546-020-00564-3
20. Paquier A, Moisy F, Rabaud M. Viscosity Effects in Wind Wave Generation. Phys Rev Fluids (2016) 1:083901. doi:10.1103/physrevfluids.1.083901
21. Sullivan PP, McWilliams JC. Dynamics of Winds and Currents Coupled to Surface Waves. Annu Rev Fluid Mech (2010) 42:19–42. doi:10.1146/annurev-fluid-121108-145541
22. Hansen RJ, Hunston DL, Ni CC, Reischman MM. An Experimental Study of Flow-Generated Waves on a Flexible Surface. J Sound Vibration (1980) 68:317–34. doi:10.1016/0022-460x(80)90389-2
23. Jia P, Andreotti B, Claudin P. Paper Waves in the Wind. Phys Fluids (2015) 27:104101. doi:10.1063/1.4931777
24. Zhang C, Wang J, Blake W, Katz J. Deformation of a Compliant Wall in a Turbulent Channel Flow. J Fluid Mech (2017) 823:345–90. doi:10.1017/jfm.2017.299
25. Shelley MJ, Zhang J. Flapping and Bending Bodies Interacting with Fluid Flows. Annu Rev Fluid Mech (2011) 43:449–65. doi:10.1146/annurev-fluid-121108-145456
26. Shields A. Anwendung der Aehnlichkeitsmechanik und der Turbulenzforschung auf die Geschiebebewegung (Application of similarity principles and turbulence research to bedload motion). Berlin: Mitteilungen der Preußischen Versuchsanstalt für Wasserbau (1936) 26. p. 1–26.
27. Charru F, Andreotti B, Claudin P. Sand Ripples and Dunes. Annu Rev Fluid Mech (2013) 45:469–93. doi:10.1146/annurev-fluid-011212-140806
28. Louge MY, Valance A, Mint Babah H, Moreau-Trouvé J-C, Ould el-Moctar A, Dupont P, et al. Seepage-induced Penetration of Water Vapor and Dust beneath Ripples and Dunes. J Geophys Res (2010) 115:F02002. doi:10.1029/2009jf001385
29. Musa RA, Takarrouht S, Louge MY, Xu J, Berberich ME. Pore Pressure in a Wind-Swept Rippled Bed below the Suspension Threshold. J Geophys Res (2014) 119:2475–590. doi:10.1002/2014jf003293
30. Smith RB. The Influence of Mountains on the Atmosphere. Adv Geophys (1979) 21:87–230. doi:10.1016/s0065-2687(08)60262-9
31. Whiteman CD. Mountain Meteorology. Oxford University Press (2000). doi:10.1093/oso/9780195132717.003.0015
32. Claudin P, Wiggs GFS, Andreotti B. Field Evidence for the Upwind Velocity Shift at the Crest of Low Dunes. Boundary-layer Meteorol (2013) 148:195–206. doi:10.1007/s10546-013-9804-3
33. Finnigan JJ, Raupach MR, Bradley EF, Aldis GK. A Wind Tunnel Study of Turbulent Flow over a Two-Dimensional Ridge. Boundary-layer Meteorol (1990) 50:277–317. doi:10.1007/bf00120527
34. Gong W, Ibbetson A. A Wind Tunnel Study of Turbulent Flow over Model Hills. Boundary-layer Meteorol (1989) 49:113–48. doi:10.1007/bf00116408
35. Gong W, Taylor PA, Dörnbrack A. Turbulent Boundary-Layer Flow over Fixed Aerodynamically Rough Two-Dimensional Sinusoidal Waves. J Fluid Mech (1996) 312:1–37. doi:10.1017/s0022112096001905
36. Kendall JM. The Turbulent Boundary Layer over a Wall with Progressive Surface Waves. J Fluid Mech (1970) 41:259–81. doi:10.1017/s0022112070000617
37. Motzfeld H. Die Turbulente Strömung an Welligen Wänden. Z Angew Math Mech (1937) 17:193–212. doi:10.1002/zamm.19370170402
38. Weng WS, Hunt JCR, Carruthers DJ, Warren A, Wiggs GFS, Livingstone I, et al. Air Flow and Sand Transport over Sand-Dunes. Acta Mechanica (1991) 2:1–22. doi:10.1007/978-3-7091-6703-8_1
39. Lü P, Narteau C, Dong Z, Claudin P, Rodriguez S, An Z, et al. Direct Validation of Dune Instability Theory. Proc Natl Acad Sci USA (2021) 118:e2024105118. doi:10.1073/pnas.2024105118
40. Abrams J, Hanratty TJ. Relaxation Effects Observed for Turbulent Flow over a Wavy Surface. J Fluid Mech (1985) 151:443–55. doi:10.1017/s0022112085001045
41. Haward SJ, Shen AQ, Page J, Zaki TA. Poisseuille Flow over a Wavy Surface. Phys Rev Fluids (2017) 12:124102. doi:10.1103/PhysRevFluids.2.124102
42. Nakagawa S, Hanratty TJ. Particle Image Velocimetry Measurements of Flow over a Wavy Wall. Phys Fluids (2001) 13:3504–7. doi:10.1063/1.1399291
43. Nelson JM, McLean SR, Wolfe SR. Mean Flow and Turbulence Fields over Two-Dimensional Bed Forms. Water Resour Res (1993) 29:3935–53. doi:10.1029/93wr01932
44. Poggi D, Katul GG, Albertson JD, Ridolfi L. An Experimental Investigation of Turbulent Flows over a Hilly Surface. Phys Fluids (2007) 19:036601. doi:10.1063/1.2565528
45. Venditti JG. Turbulent Flow and Drag over Fixed Two- and Three-Dimensional Dunes. J Geophys Res (2007) 112:F04008. doi:10.1029/2006jf000650
46. Wiberg PL, Nelson JM. Unidirectional Flow over Asymmetric and Symmetric Ripples. J Geophys Res (1992) 97:12745–61. doi:10.1029/92jc01228
47. Zilker DP, Cook GW, Hanratty TJ. Influence of the Amplitude of a Solid Wavy Wall on a Turbulent Flow. Part 1. Non-separated Flows. J Fluid Mech (1977) 82:29–51. doi:10.1017/s0022112077000524
48. Zilker DP, Hanratty TJ. Influence of the Amplitude of a Solid Wavy Wall on a Turbulent Flow. Part 2. Separated Flows. J Fluid Mech (1979) 90:257–71. doi:10.1017/s0022112079002196
49. Hanratty TJ. Stability of Surfaces that Are Dissolving or Being Formed by Convective Diffusion. Annu Rev Fluid Mech (1981) 13:231–52. doi:10.1146/annurev.fl.13.010181.001311
50. Meakin P, Jamtveit B. Geological Pattern Formation by Growth and Dissolution in Aqueous Systems. Proc R Soc A (2010) 466:659–94. doi:10.1098/rspa.2009.0189
51. Claudin P, Durán O, Andreotti B. Dissolution Instability and Roughening Transition. J Fluid Mech (2017) 832:R2. doi:10.1017/jfm.2017.711
52. Bordiec M, Carpy S, Bourgeois O, Herny C, Massé M, Perret L, et al. Sublimation Waves: Geomorphic Markers of Interactions between Icy Planetary Surfaces and Winds. Earth-Science Rev (2020) 211:103350. doi:10.1016/j.earscirev.2020.103350
53. Bintanja R, Reijmer CH, Hulscher SJMH. Detailed Observations of the Rippled Surface of Antarctic Blue-Ice Areas. J Glaciol (2001) 47:387–96. doi:10.3189/172756501781832106
54. Thomas RM. Size of Scallops and Ripples Formed by Flowing Water. Nature (1979) 277:281–3. doi:10.1038/277281a0
55. Durán O, Andreotti B, Claudin P, Winter C. A Unified Model of Ripples and Dunes in Water and Planetary Environments. Nat Geosci (2019) 12:345–50. doi:10.1038/s41561-019-0336-4
56. Cook GW. Turbulent Flow over Solid Wavy Surfaces. PhD thesis. Urbana-Champaign, IL: University of Illinois at Urbana-Champaign (1970).
57. Pope SB. Turbulent Flows. Cambridge, United Kingdom: Cambridge Univ. Press (2000). doi:10.1017/cbo9780511840531
58. van Driest ER. On Turbulent Flow Near a Wall. J Aeronaut Sci (1956) 23:1007–11. doi:10.2514/8.3713
59. Flack KA, Schultz MP. Review of Hydraulic Roughness Scales in the Fully Rough Regime. J Fluid Eng (2010) 132:041203. doi:10.1115/1.4001492
60. Schultz MP, Flack KA. Turbulent Boundary Layers on a Systematically Varied Rough Wall. Phys Fluids (2009) 21:015104. doi:10.1063/1.3059630
61. Frederick KA, Hanratty TJ. Velocity Measurements for a Turbulent Nonseparated Flow over Solid Waves. Experiments in Fluids (1988) 6:477–86. doi:10.1007/bf00196509
62. Andreotti B, Fourrière A, Ould-Kaddour F, Murray B, Claudin P. Giant Aeolian Dune Size Determined by the Average Depth of the Atmospheric Boundary Layer. Nature (2009) 457:1120–3. doi:10.1038/nature07787
63. de Angelis V, Lombardi P, Banerjee S. Direct Numerical Simulation of Turbulent Flow over a Wavy Wall. Phys Fluids (1997) 9:2429–42. doi:10.1063/1.869363
64. Henn DS, Sykes RI. Large-eddy Simulation of Flow over Wavy Surfaces. J Fluid Mech (1999) 383:75–112. doi:10.1017/s0022112098003723
65. Maaß C, Schumann U, Voke PR, Kleiser L, Chollet JP. Numerical Simulation of Turbulent Flow over a Wavy Boundary. Direct and Large Eddy Simulation. Dordrecht, The Netherlands: Kluwer (1994). p. 287–97.
66. Maaß C, Schumann U. Direct Numerical Simulation of Separated Turbulent Flow over a Wavy Boundary, editor EH Hirschel (1996). p. 227–41. doi:10.1007/978-3-322-89849-4_17
67. Salvetti MV, Damiani R, Beux F. Three-dimensional Coarse Large-Eddy Simulations of the Flow above Two-Dimensional Sinusoidal Waves. Int J Numer Meth Fluids (2001) 35:617–42. doi:10.1002/1097-0363(20010330)35:6<617::aid-fld104>3.0.co;2-m
68. Meysman FJR, Galaktionov OS, Cook PLM, Janssen F, Huettel M, Middelburg JJ. Quantifying Biologically and Physically Induced Flow and Tracer Dynamics in Permeable Sediments. Biogeosciences (2007) 4:627–46. doi:10.5194/bg-4-627-2007
69. Louge MY, Valance A, Ould el-Moctar A, Xu J, Hay AG, Richer R. Temperature and Humidity within a Mobile Barchan Sand Dune, Implications for Microbial Survival. J Geophys Res (2013) 118:627–46. doi:10.1002/2013jf002839
70. Tournat V, Zaitsev V, Gusev V, Nazarov V, Béquin P, Castagnède B. Probing Weak Forces in Granular Media through Nonlinear Dynamic Dilatancy: Clapping Contacts and Polarization Anisotropy. Phys Rev Lett (2004) 92:085502. doi:10.1103/physrevlett.92.085502
72. Claudin P, Jarry H, Vignoles G, Plapp M, Andreotti B. Physical Processes Causing the Formation of Penitentes. Phys Rev E (2015) 92:033015. doi:10.1103/physreve.92.033015
71. Andreotti B, Forterre Y, Pouliquen O. Granular Media, between Fluid and Solid. Cambridge University Press (2013). doi:10.1017/cbo9781139541008
Keywords: pressure modulation, bedforms, sinusoidal topography, linear response, laminar-turbulent transition
Citation: Claudin P, Louge M and Andreotti B (2021) Basal Pressure Variations Induced by a Turbulent Flow Over a Wavy Surface. Front. Phys. 9:682564. doi: 10.3389/fphy.2021.682564
Received: 18 March 2021; Accepted: 30 April 2021;
Published: 14 May 2021.
Edited by:
Hezi Yizhaq, Ben-Gurion University of the Negev, IsraelCopyright © 2021 Claudin, Louge and Andreotti. This is an open-access article distributed under the terms of the Creative Commons Attribution License (CC BY). The use, distribution or reproduction in other forums is permitted, provided the original author(s) and the copyright owner(s) are credited and that the original publication in this journal is cited, in accordance with accepted academic practice. No use, distribution or reproduction is permitted which does not comply with these terms.
*Correspondence: Philippe Claudin, cGhpbGlwcGUuY2xhdWRpbkBlc3BjaS5mcg==
 Philippe Claudin
 Michel Louge
 Bruno Andreotti3