
94% of researchers rate our articles as excellent or good
Learn more about the work of our research integrity team to safeguard the quality of each article we publish.
Find out more
ORIGINAL RESEARCH article
Front. Phys., 27 October 2021
Sec. Social Physics
Volume 9 - 2021 | https://doi.org/10.3389/fphy.2021.681788
This article is part of the Research TopicThe paradigm of complexity and the real data of Socio-EconomyView all 5 articles
To meet the increasing demand for food around the world, pesticides are widely used and will continue to be widely used in agricultural production to reduce yield losses and maintain product quality. International pesticide trade serves to reallocate the distribution of pesticides around the world. We investigate the statistical properties of the international trade networks of five categories of pesticides from the view angle of temporal directed and weighted networks. We observed an overall increasing trend in network size, network density, average in- and out-degrees, average in- and out-strengths, temporal similarity, and link reciprocity, indicating that the rising globalization of pesticides trade is driving the networks denser. However, the distributions of link weights remain unchanged along time for the five categories of pesticides. In addition, all the networks are disassortatively mixed because large importers or exporters are more likely to trade with small exporters or importers. We also observed positive correlations between in-degree and out-degree, in-strength and out-strength, link reciprocity and in-degree, out-degree, in-strength, and out-strength, while node’s local clustering coefficient is negatively related to in-degree, out-degree, in-strength, and out-strength. We show that some structural and dynamic properties of the international pesticide trade networks are different from those of the international trade networks, highlighting the presence of idiosyncratic features of different goods and products in the international trade.
The past decades after the World War II have witnessed a marked growth in food production and the total population of the world, together with a dramatic decrease in the proportion of the world’s people that are hungry, and the global demand for food will continuously increase in the coming decades [1, 2]. Seeds, fertilizers, and pesticides, as major agricultural inputs, will continue to play a central role in raising agricultural yields and product quality to meet the challenge of feeding billions of people. Pesticides are widely used in agricultural production around the world to reduce yield losses and maintain product quality by controlling pests, weeds, and other plant pathogens, which has long raised serious concerns about risks to human health and the environment [3–8]. Nevertheless, the current need to increase food production to feed a rapidly growing population puts pressure on the intensive use of pesticides and thus drives the international trade of pesticides.
International pesticide trade serves to reallocate the distribution of pesticides around the world and forms complex networks. Indeed, the structure and dynamics of the international trade networks as a whole have been extensively studied [9–19], and researchers have proposed dynamic models to understand the formation of the international trade networks [20, 21], such as the fitness model [22], the gravity model [23, 24], and the enhanced gravity model [25]. There are also studies on the international trade networks of agricultural goods and products. For instance, Gephart and Pace investigated the structure and evolution of the global seafood trade network [26], and Qiang et al studied the evolution of the global agricultural trade network of eight groups of agricultural products [27], and Dupas, Halloy, and Chatzimpiros focused on the dynamics and invariant sub-network structures in the world cereals trade [28]. Furthermore, Wu and Guclu developed a social network model of the global trade of maize to analyze the network patterns and to determine the vulnerable exporters in food security [29], Gephart et al. investigated the vulnerability to shocks in the global seafood trade network [30], and Distefano et al. unveiled shock transmission in the international food trade network [31]. The international trade of food goods and products are associated with a virtual transfer of water resources from production to consumption regions through a network of trade, and the international virtual water networks have also been studied extensively [32–40].
However, the international trade networks of agricultural inputs (seeds, fertilizers, and pesticides) are rarely studied. In this work, we investigate the structure and evolution of the international pesticide trade networks (iPTNs) from the view angle of temporal directed and weighted networks. We take into consideration the directions and weights of the links, which are crucial traits of the iPTNs. Specifically, we investigate the evolution of total trade value, network size, network density, overall in- and out-degrees of nodes, overall in- and out-strengths of nodes, four measures of assortativity, network structure stability, reciprocity, and clustering coefficient, as well as the relationships between some pairs of these network metrics. We find that, although most of the structural properties of the international pesticide trade networks are qualitatively similar to those of the whole international trade network, there are also qualitative and quantitative differences, indicating the presence of idiosyncratic features of different goods and products in the international trade. It is thus necessary to explore such disaggregated networks to uncover idiosyncratic properties and dynamics of the international trade networks of specific goods and products.
The remainder of study is organized as follows. Section 2 describes the data sets used in our analysis and the construction of the international pesticide trade networks. Section 3 presents the evolution of total trade value, network size, and network density. Section 4 studies the properties of node degrees, link weights, and node strengths. Section 5 investigates the structural patterns of the iPTNs by looking into the similarity of temporal directed networks, the mixing patterns, the reciprocity, and the clustering coefficients. We conclude in Section 6.
The data sets analyzed in this work were retrieved from the UN Comtrade database1. The goods about pesticides are under Heading 3808, which contains insecticides, rodenticides, fungicides, herbicides, anti-sprouting products, plant growth regulators, disinfectants, and the like, being put up in forms or packings for retail sale or as preparations or articles. We do not consider the goods with the HS codes being 380852, 380859, 380861, 380862, and 380869 since they have a rather short history. We analyze five categories of pesticides including insecticides (380891), fungicides (380892), herbicides (380893), disinfectants (380894), and rodenticides and other similar products (380899). The data sets available span from 2007 to 2018. Since the data for the year 2019 are incomplete, we use the data from 2007 to 2018.
Since the trade quantities or net weights of some trades are missing in the UN Comtrade database and are not comparable, we use trade values (US$) of the goods in our investigation. If the trade value of pesticide goods (with HS Code code) exported from economy i to economy j in year t is
where code ∈ {380891, 380892, 380893, 380894, 380899} is the HS codes of the pesticide under investigation and
Figure 1 illustrates the international pesticide trade networks for the five goods with codes 380891, 380892, 380893, 380894, and 380899 from top to bottom. For each good, we plot the links with high (98–100%), medium (49–51%), and low (0–2%) trade values of 2% and compare the two networks in 2007 and in 2018. It is observed that the network for each good shows persistence and structural changes.
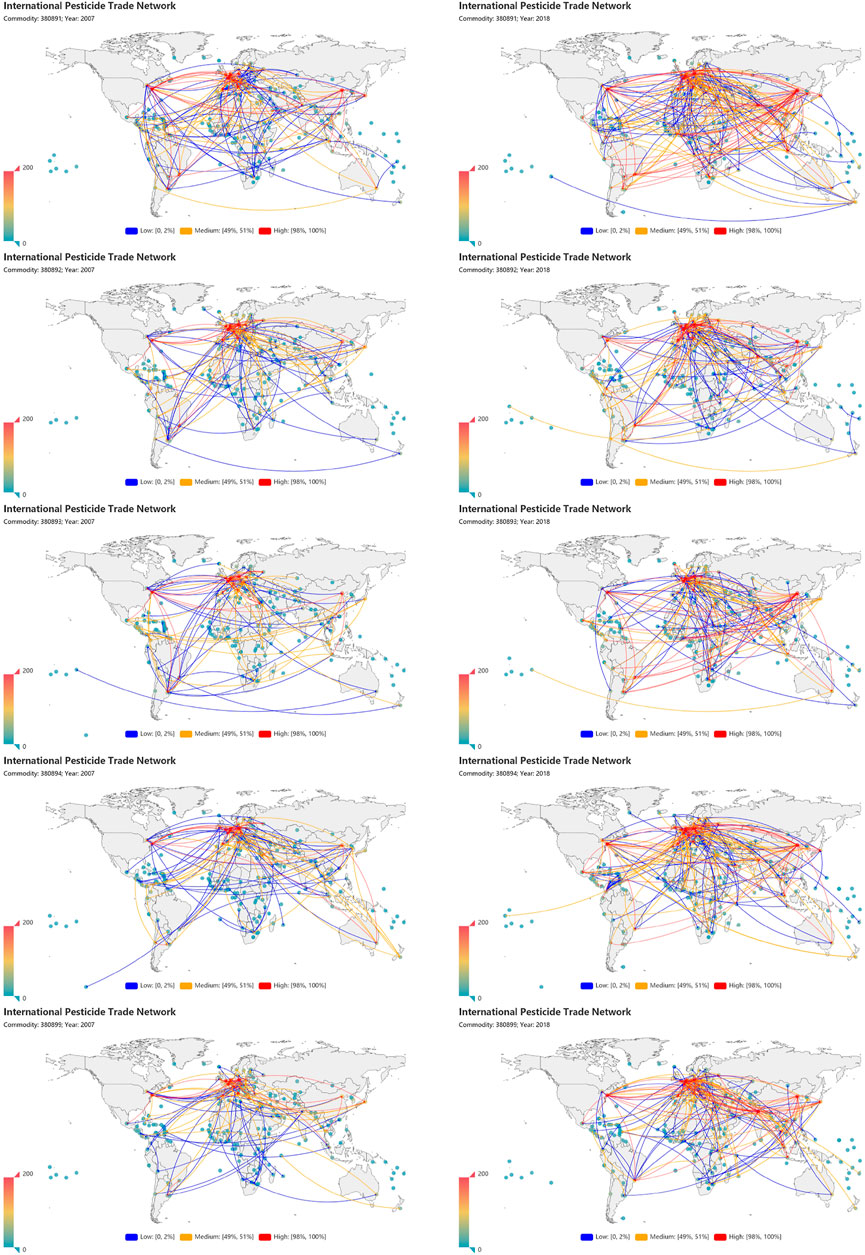
FIGURE 1. International pesticide trade networks. The left and right columns correspond to 2007 and 2018. The rows from top to bottom show the goods with codes 380891 (insecticides), 380892 (fungicides), 380893 (herbicides), 380894 (disinfectants), and 380899 (rodenticides and other similar products). In each map, we show the links with high, medium, and low trade values of 2%.
The size of a network is usually quantified by the number of nodes in the network,
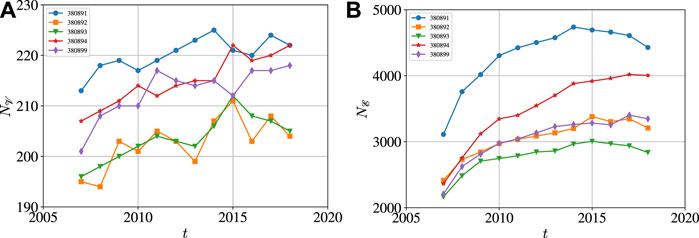
FIGURE 2. Evolution of network size and number of links of the five international pesticide trade networks with the codes being 380891 (insecticides), 380892 (fungicides), 380893 (herbicides), 380894 (disinfectants), and 380899 (rodenticides and other similar products) from 2007 to 2018. The network size is quantified by the number of nodes
In Figure 3, we also investigate the numbers of exporting and importing economies of the five international pesticide trade networks from 2007 to 2018, denoted by
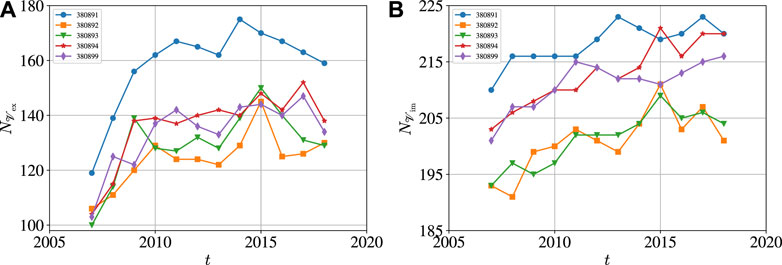
FIGURE 3. Numbers of exporting and importing economies of the five international pesticide trade networks from 2007 to 2018. (A)
Hence, there are much more importing economies than exporting economies. On average, the numbers of importing and exporting economies increased along time, but the increasing speed slowed down especially for exporting economies.
The total trade value of a given goods code is
which is a value less than the actual value since we do not consider the trade data whose importing or exporting economies are not labeled in the UN Comtrade database. Figure 4A presents the evolution of the international trade values W(t) of the five pesticides from 2007 to 2018. We find that the W(t) curves show an overall rising trend and experienced a fall after rise in 2015. In each year, herbicides (380893) have the largest international trade value, while disinfectants (380894) and rodenticides (380899) have the much lower international trade values.
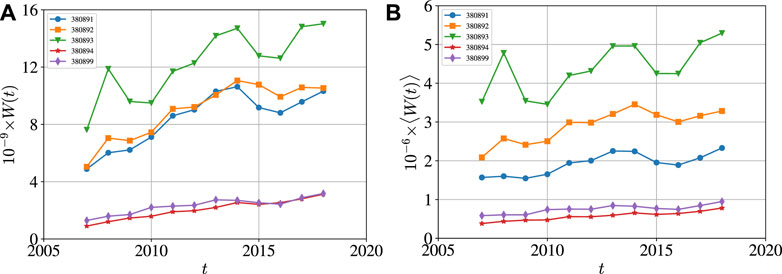
FIGURE 4. (A) Evolution of the total international trade values W(t) (Billion US$) of the five categories of pesticides from 2007 to 2018. (B) Evolution of the average international trade values
The average international trade value of a given goods code with respect to the number of links is calculated as follows:
which is illustrated in Figure 4B. The average international trade value for each pesticide category also shows a rising trend, with a local drop since 2015.
The density of a directed network is the ratio of the number of existing links to the number of links of the complete directed network
where the complete directed network has
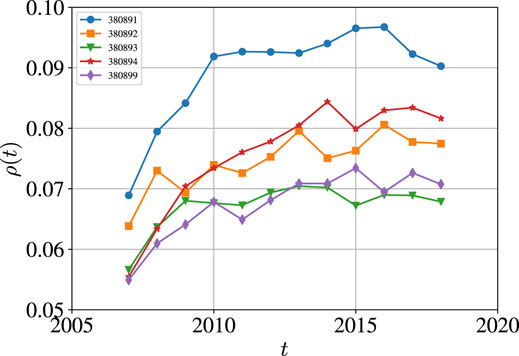
FIGURE 5. Evolution of the network density of the five pesticide goods with the codes being 380891 (insecticides), 380892 (fungicides), 380893 (herbicides), 380894 (disinfectants), and 380899 (rodenticides and other similar products) from 2007 to 2018.
In this section, we investigate the features of nodes and links, including node in-degree and out-degree, link strength or link weight, and node in-strength and out-strength.
The in-degree of node
where we pose 00 = 0. Similarly, the out-degree of node
The average in-degree of nodes (
The average out-degree of nodes (
Since
we have
and
In Figures 6A–E, we plot in loglog scales the in-degree
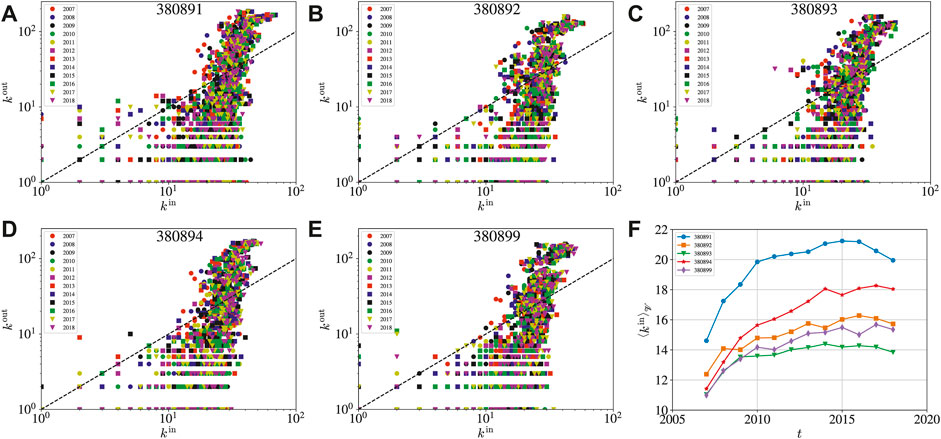
FIGURE 6. (A–E) Relationship between the in-degree
In Figure 6F, we digest the evolution of the average in-degree
In order to obtain the empirical distribution density f (w) of link weights w, we use logarithmic binning. Equivalently, we determine the empirical distribution g (log 10w) of log 10w through linear binning. The two distributions are related as follows [41].
It follows that
Hence, we first obtain the distribution density g (ln w) of ln w. We show in Figure 7 the distributions of link weights for the five pesticide goods. The most intriguing feature is that, for each pesticide goods, the 12 empirical distributions for the 12 years collapse on the same curve. The distributions for the insecticides (380891) networks in Figure 7A, the fungicides (380892) networks in Figure 7B, and the herbicides (380893) networks in Figure 7C exhibit a power-law scaling when the weights are not large, followed by a faster decay when the weights become larger. There is also a bimodal pattern for the fungicides (380892) networks in Figure 7B and the herbicides (380893) networks in Figure 7C, reminiscent of the bimodal distribution of some social networks [42–44]. The distributions for the disinfectants (380894) networks in Figure 7D and the rodenticides (380899) networks in Figure 7E do not show an evident power law. These distributions also exhibit differences from that for the international trade network [45].
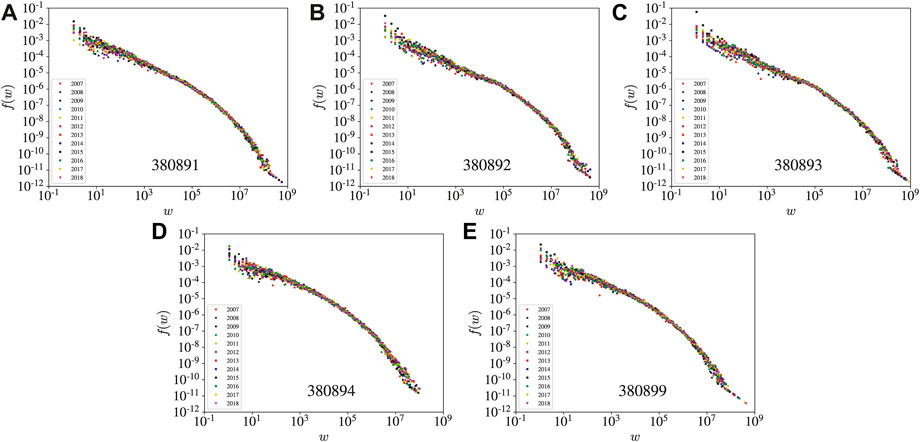
FIGURE 7. Empirical distributions of link weights for the five pesticides trade networks: (A) 380891 for insecticides (A), 380892 for fungicides (B), 380893 for herbicides (C), 380894 for disinfectants (D), and 380899 for rodenticides and other similar products (E). In each plot, there are 13 distributions corresponding to the 13 years.
The total import value of an economy
where we note that wjj = 0. Similarly, the export value of an economy
The average in-strength of nodes (
where the last equality is obtained according to Eq. 3. Similarly, the average out-strength of nodes is expressed as follows:
Therefore, we have
and
In Figures 8A–E, we plot in loglog scales the in-strength
with αs ≈ 2.5. An economy i has more exports than imports if
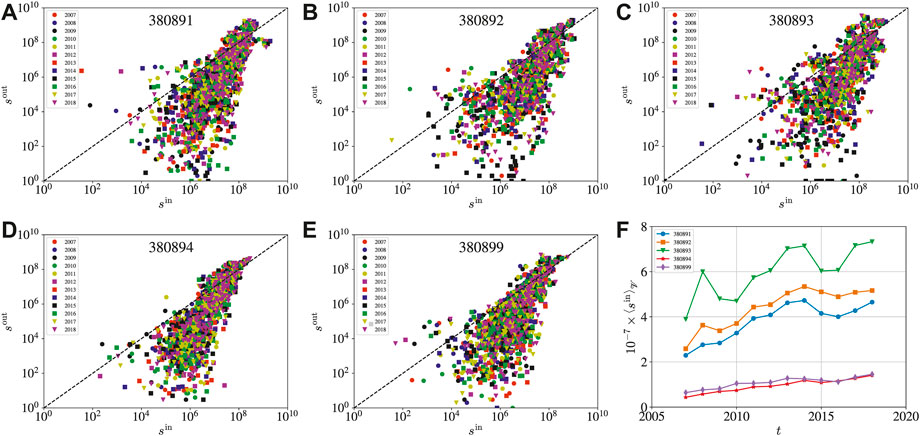
FIGURE 8. (A–E) Relationship between the in-strength
In order to compare the structural stability of two successive networks at t and t + 1, we calculate the similarity coefficient of temporal networks. Let
where
Figure 9A shows the evolution of the temporal similarity coefficient S (t) between two successive networks of the five pesticide goods from 2007 to 2018. We find that the temporal similarity increased first and reached a relatively stable level. The fungicides (380892) trade networks have the highest temporal similarity. Intuitively, we conjecture that links with large weights are more temporally stable. We calculate the similarity coefficients of sub-networks containing small links with the weights less than the 20% percentile, medium links with the weights between the 40 and 60% percentiles, and large links with the weights greater than the 80% percentile. The results are shown in Figures 9B–D, respectively, which verify that the large international trade relationships are more stable than the small international trade relationships.
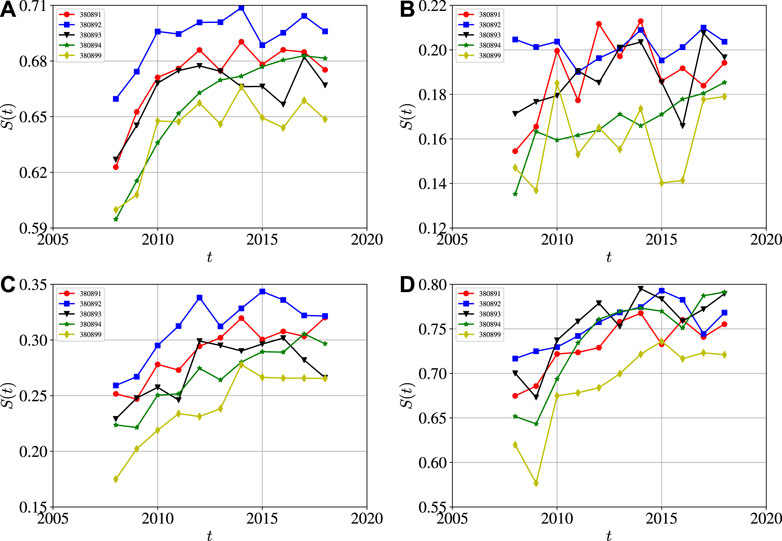
FIGURE 9. Evolution of the temporal similarity coefficient S(t) between two successive networks of the five pesticide goods with the codes being 380891 (insecticides), 380892 (fungicides), 380893 (herbicides), 380894 (disinfectants), and 380899 (rodenticides and other similar products) from 2007 to 2018. (A) All links. (B) Small links with the weights less than the 20% percentile. (C) Medium links with the weights between the 40 and 60% percentiles. (D) Large links with the weights greater than the 80% percentile.
Mixing patterns of links in undirected networks have been introduced and widely studied to quantify the correlation relationship (assortative or disassortative) between node degrees [49, 50], which can be extended to direct networks [51]. From the perspective of trade relationship from exporting economy i to importing economy j, described by link eij, the exporting economy i has an in-degree
with the variance being
The mean in-degree of importing economies is
with the variance being
The mean out-degree of exporting economies is
with the variance being
and the mean out-degree of importing economies is
with the variance being
Figure 10 shows the yearly evolution of the average in-degree and out-degree of the exporting and importing economies over all the links. Comparing Figure 10A and Figure 10D, we find that
which can be proved. For each exporting economy i, it has
where
where
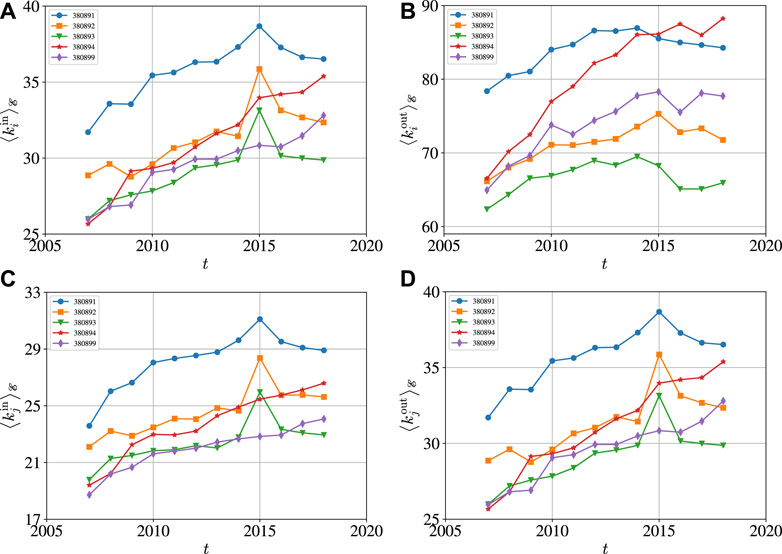
FIGURE 10. Yearly evolution of the average in-degree and out-degree of the exporting and importing economies over all the links. The five codes are 380891 (insecticides), 380892 (fungicides), 380893 (herbicides), 380894 (disinfectants), and 380899 (rodenticides and other similar products). (A) Average in-degree of exporting nodes. (B) Average out-degree of exporting nodes. (C) Average in-degree of importing nodes. (D) Average out-degree of importing nodes.
One can define the set of assortativity measures using the Pearson correlation [51]. Specifically, the degree assortative coefficient rin,in(t) between the in-degree of exporting economies and the in-degree of importing economies is
The degree assortative coefficient rin,out (t) between the in-degree of exporting economies and the out-degree of importing economies is
The degree assortative coefficient rout,in (t) between the out-degree of exporting economies and the in-degree of importing economies is
and the degree assortative coefficient rout,out (t) between the out-degree of exporting economies and the out-degree of importing economies is
Figure 11 illustrates the evolution of the degree assortative coefficients of the five international pesticide trade networks from 2007 to 2018. It is found that all the correlation coefficients are negative, showing that the networks are disassortatively mixed. In disassortative international pesticide trade networks, high-degree nodes tend to connect to low-degree nodes, which limit the effects of node failure and relieve the propagation of shocks because important nodes (with many links) are isolated from each other [52]. On average, the degree assortative coefficient rout,in (t) between the out-degree of exporting economies and the in-degree of importing economies is the most negative. We also find that the four-degree assortative coefficients seem more negative in the years 2007 and 2015, compared to the coefficients in other years. We note that the international trade network is also disassortative and the assortativity coefficient (about −0.4) is smaller [14], where the link directions are not considered.
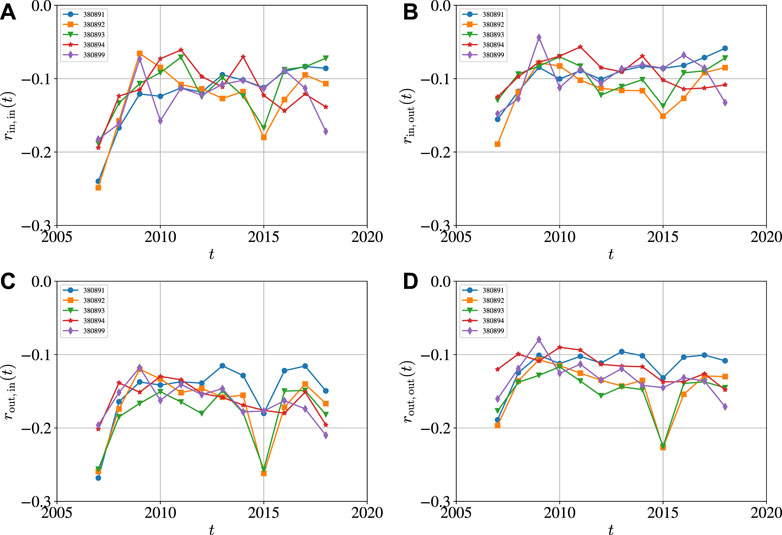
FIGURE 11. Evolution of degree assortative coefficients of the five international pesticide trade networks with the codes being 380891 (insecticides), 380892 (fungicides), 380893 (herbicides), 380894 (disinfectants), and 380899 (rodenticides and other similar products) from 2007 to 2018. (A) The degree assortative coefficient rin,in (t) between the in-degree of exporting economies and the in-degree of importing economies. (B) The degree assortative coefficient rin,out (t) between the in-degree of exporting economies and the out-degree of importing economies. (C) The degree assortative coefficient rout,in (t) between the out-degree of exporting economies and the in-degree of importing economies. (D) The degree assortative coefficient rout,out (t) between the out-degree of exporting economies and the out-degree of importing economies.
The reciprocity of a directed network is defined as the ratio of the number of bilateral links (i.e., links pointing in both directions) to the total number of links in the network [9, 22], that is,
where
is the reciprocal degree of node i so that
The reciprocity coefficient is also known as the percentage of bilateral links [14].
Figure 12 shows the evolution of overall reciprocity of the five international pesticide trade networks from 2007 to 2018. It is found that the overall reciprocity coefficients are all greater than 0.32. It is found that the overall reciprocity was stable before 2014 and increased slightly afterward. In addition, the overall reciprocity coefficients are abnormally greater than its neighbor years, especially for pesticide goods 380891, 380892, and 380893. The reciprocity coefficients of the pesticides networks are much smaller than those of the international trade networks (around 0.9) [14], which are natural since the international trade networks contain many more goods and thus more reciprocal links.
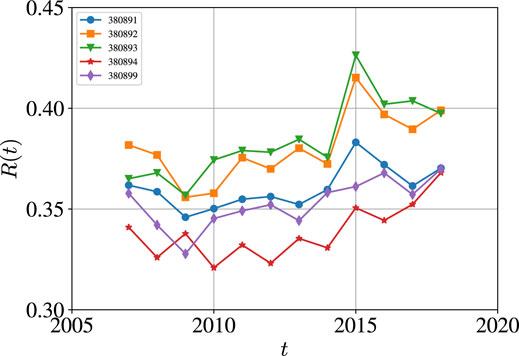
FIGURE 12. Evolution of overall reciprocity of the five international pesticide trade networks from 2007 to 2018. The five codes are 380891 (insecticides), 380892 (fungicides), 380893 (herbicides), 380894 (disinfectants), and 380899 (rodenticides and other similar products).
The reciprocity of a single node i is defined similarly, and it is the ratio of the number of links in both directions to the total number of links attached to node i:
We calculate the reciprocity coefficients Ri of economies in each network and compare them with the in-degree
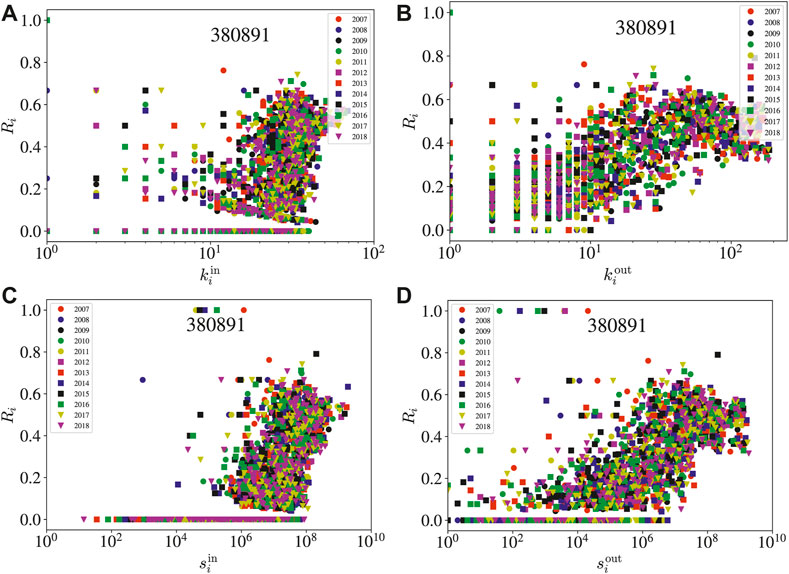
FIGURE 13. Scatter plots of the reciprocity coefficients of economies in the insecticides (380891) network with respect to the corresponding node attributes. (A) Reciprocity coefficient Ri versus in-degree
For unweighted graphs, the clustering of a node i is the fraction of possible triangles through that node that exist,
where Ti is the number of triangles through node u and ki is the degree of i. For weighted networks, there are several ways to define the clustering coefficient [53, 54]. For directed graphs, the clustering is similarly defined as the fraction of all possible directed triangles or geometric average of the subgraph link weights for unweighted and weighted directed network, respectively [45]:
where Ti is the number of directed triangles through node i,
Figure 14 shows the evolution of the overall clustering coefficients of the five international pesticide trade networks from 2007 to 2018. For the insecticides (380891) network and the rodenticides (380899) network, the overall clustering coefficient C(t) curves exhibit a U-shape. For the disinfectants (380894) network, the C(t) curve has an increasing trend. For the rest two networks, the C(t) curves fluctuate stably, and the curve for the fungicides (380892) network has an evident local maximum at the year 2015. It is not surprising that the international trade networks have higher clustering coefficients close to 0.82 [14].
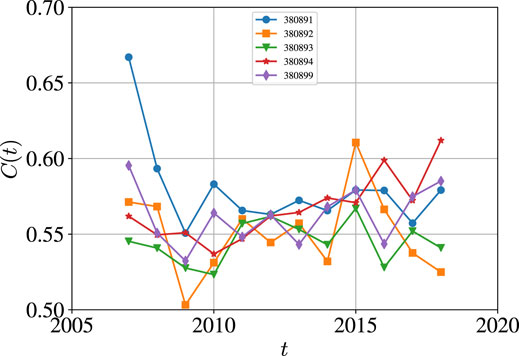
FIGURE 14. Evolution of overall clustering coefficients of the five international pesticide trade networks from 2007 to 2018. The five codes are 380891 (insecticides), 380892 (fungicides), 380893 (herbicides), 380894 (disinfectants), and 380899 (rodenticides and other similar products).
We show the scatter plots of the clustering coefficients ci of nodes in the insecticides (380891) network with respect to the in-degree
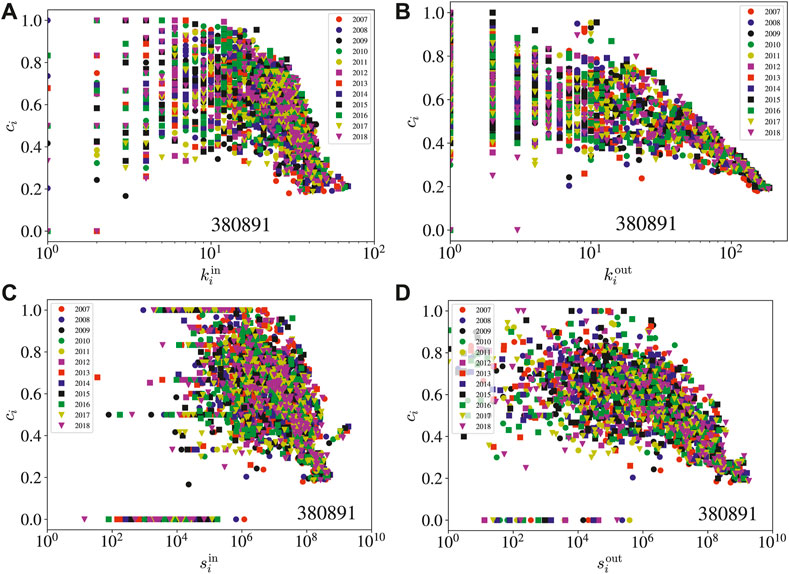
FIGURE 15. Scatter plots of the clustering coefficients of economies in the insecticides (380891) network with respect to the corresponding node attributes. (A) Clustering coefficient ci versus in-degree
We also show the scatter plots of the clustering coefficients ci of nodes in the insecticide (380891) network with respect to the in-strength
In this study, we have investigated the structure and evolution of the international trade networks of five categories of pesticides including insecticides (380891), fungicides (380892), herbicides (380893), disinfectants (380894), and rodenticides and other similar products (380899) retrieved from the UN Comtrade database. The yearly sampled data sets cover the time period from 2007 to 2018. Specifically, we have explored the global properties including total trade value, network size, and network density, the first-order properties of nodes and links including node degrees, link weights and node strengths, and the structural patterns including temporal similarity, mixing patterns, reciprocity, and the clustering coefficients. Our analyses were carried out from the perspective of temporal weighted and directed network. In particular, taking link directions into consideration allows us to better understand the structure and behavior of international pesticide trade. Certainly, other topics about complex networks like node centrality, group formation, community detection, and link prediction may be useful for future research on the temporal international pesticide trade networks [55–60].
We observed an overall increasing trend in almost all global network metrics quantifying the growth and densification of networks, including network size, network density, average in- and out-degrees, average in- and out-strengths, temporal similarity, and link reciprocity. It means that the international pesticide trade networks are becoming more connected. These findings show the continuous integration and globalization of international pesticide trade. However, we also observed that the trend of integration and globalization of international pesticide trade have slowed down in the last decade. Interestingly, we found that the distributions of link weights remain unchanged along time for the five categories of pesticides.
From the directed network perspective, we found that all the networks are disassortatively mixed. It means that large importers or exporters are more likely to trade with small exporters or importers, while the probability of trades between large importers or exporters and between small importers or exporters is relatively low. We also observed positive correlations between in-degree and out-degree, between in-strength and out-strength, between link reciprocity and in-degree, out-degree, and in-strength and out-strength. In contrast, node’s local clustering coefficient is negatively related to in-degree, out-degree, in-strength, and out-strength. It suggests that exporting economies usually produce only some pesticides with an excess volume of production due to their comparative advantages of technology or labor and need to import other pesticides.
Our preliminary analysis shows that, although most of the structural properties of the international pesticide trade networks are qualitatively similar to those of the whole international trade network, we uncovered qualitative and quantitative differences. The quantitative differences mainly come from the fact that the international pesticides networks are only part of the whole international trade network. However, the qualitative differences show the presence of idiosyncratic features of different goods and products in the international trade. Exploration of such disaggregated networks will uncover idiosyncratic properties and dynamics of the international trade networks of specific goods and products.
Publicly available datasets were analyzed in this study. This data can be found here: https://comtrade.un.org/data.
W-JX and W-XZ conceived the research. J-AL analyzed the data and prepared the figures. J-AL and W-XZ analyzed the results and wrote the paper. All authors discussed and reviewed the manuscript.
This work was partly supported by the National Natural Science Foundation of China (72171083), the Shanghai Outstanding Academic Leaders Plan, and the Fundamental Research Funds for the Central Universities.
The authors declare that the research was conducted in the absence of any commercial or financial relationships that could be construed as a potential conflict of interest.
All claims expressed in this article are solely those of the authors and do not necessarily represent those of their affiliated organizations, or those of the publisher, the editors and the reviewers. Any product that may be evaluated in this article, or claim that may be made by its manufacturer, is not guaranteed or endorsed by the publisher.
1https://comtrade.un.org/data/
1. Godfray HCJ, Beddington JR, Crute IR, Haddad L, Lawrence D, Muir JF, et al. Food Security: the challenge of Feeding 9 Billion People. Science (2010) 327:812–8. doi:10.1126/science.1185383
2. Tilman D, Balzer C, Hill J, Befort BL. Global Food Demand and the Sustainable Intensification of Agriculture. Proc Natl Acad Sci U S A (2011) 108:20260–4. doi:10.1073/pnas.1116437108
3. Brethour C, Weersink A. An Economic Evaluation of the Environmental Benefits from Pesticide Reduction. Agric Econ (2001) 25:219–26. doi:10.1111/j.1574-0862.2001.tb00202.x
4. Carvalho FP. Agriculture, Pesticides, Food Security and Food Safety. Environ Sci Pol (2006) 9:685–92. doi:10.1016/j.envsci.2006.08.002
5. Cooper J, Dobson H. The Benefits of Pesticides to Mankind and the Environment. Crop Prot (2007) 26:1337–48. doi:10.1016/j.cropro.2007.03.022
6. Damalas CA, Eleftherohorinos IG. Pesticide Exposure, Safety Issues, and Risk Assessment Indicators. Int J Environ Res Public Health (2011) 8:1402–19. doi:10.3390/ijerph8051402
7. Drogue S, DeMaria F. Pesticide Residues and Trade, the Apple of Discord?Food Policy (2012) 37:641–9. doi:10.1016/j.foodpol.2012.06.007
8. Carvalho FP. Pesticides, Environment, and Food Safety. Food Energy Secur (2017) 6:48–60. doi:10.1002/fes3.108
9. Serrano MA, Boguñá M. Topology of the World Trade Web. Phys Rev E (2003) 68:015101. doi:10.1103/PhysRevE.68.015101
10. Garlaschelli D, Loffredo MI. Structure and Evolution of the World Trade Network. Physica A (2005) 355:138–44. doi:10.1016/j.physa.2005.02.075
11. Garlaschelli D, Di Matteo T, Aste T, Caldarelli G, Loffredo MI. Interplay between Topology and Dynamics in the World Trade Web. Eur Phys J B (2007) 57:159–64. doi:10.1140/epjb/e2007-00131-6
12. Fagiolo G, Reyes J, Schiavo S. On the Topological Properties of the World Trade Web: A Weighted Network Analysis. Physica A 387 (2008) 3868–73. doi:10.1016/j.physa.2008.01.050
13. Fagiolo G, Reyes J, Schiavo S. World-trade Web: Topological Properties, Dynamics, and Evolution. Phys Rev E (2009) 79:036115. doi:10.1103/PhysRevE.79.036115
14. Fagiolo G, Reyes J, Schiavo S. The Evolution of the World Trade Web: A Weighted-Network Analysis. J Evol Econ (2010) 20:479–514. doi:10.1007/s00191-009-0160-x
15. Squartini T, Fagiolo G, Garlaschelli D. Randomizing World Trade. I. A Binary Network Analysis. Phys Rev E (2011) 84:046117. doi:10.1103/PhysRevE.84.046117
16. Squartini T, Fagiolo G, Garlaschelli D. Randomizing World Trade. II. A Weighted Network Analysis. Phys Rev E (2011) 84:046118. doi:10.1103/PhysRevE.84.046118
17. Karpiarz M, Fronczak P, Fronczak A. International Trade Network: Fractal Properties and Globalization Puzzle. Phys Rev Lett (2014) 113. doi:10.1103/PhysRevLett.113.248701
18. Torreggiani S, Mangioni G, Puma MJ, Fagiolo G. Identifying the Community Structure of the Food-Trade International Multi-Network. Environ Res Lett (2018) 13:054026. doi:10.1088/1748-9326/aabf23
19. Campi M, Duenas M, Fagiolo G. How Do Countries Specialize in Agricultural Production? a Complex Network Analysis of the Global Agricultural Product Space. Environ Res Lett (2020) 15:124006. doi:10.1088/1748-9326/abc2f6
20. Bhattacharya K, Mukherjee G, Saramäki J, Kaski K, Manna SS. The International Trade Network: Weighted Network Analysis and Modelling. J Stat Mech (2008) P02002. doi:10.1088/1742-5468/2008/02/P02002
21. Mastrandrea R, Squartini T, Fagiolo G, Garlaschelli D. Reconstructing the World Trade Multiplex: the Role of Intensive and Extensive Biases. Phys Rev E (2014) 90:062804. doi:10.1103/PhysRevE.90.062804
22. Garlaschelli D, Loffredo M. Patterns of Link Reciprocity in Directed Networks. Phys Rev Lett (2004) 93:268701. doi:10.1103/PhysRevLett.93.268701
23. Fagiolo G. The International-Trade Network: Gravity Equations and Topological Properties. J Econ Interact Coord (2010) 5:1–25. doi:10.1007/s11403-010-0061-y
24. Duenas M, Fagiolo G. Modeling the International-Trade Network: a Gravity Approach. J Econ Interact Coord (2013) 8:155–78. doi:10.1007/s11403-013-0108-y
25. Almog A, Bird R, Garlaschelli D. Enhanced Gravity Model of Trade: Reconciling Macroeconomic and Network Models. Front Phys (2019) 7:55. doi:10.3389/fphy.2019.00055
26. Gephart JA, Pace ML. Structure and Evolution of the Global Seafood Trade Network. Environ Res Lett (2015) 10:125014. doi:10.1088/1748-9326/10/12/125014
27. Qiang W, Niu S, Wang X, Zhang C, Liu A, Cheng S. Evolution of the Global Agricultural Trade Network and Policy Implications for China. Sustainability (2020) 12:192. doi:10.3390/su12010192
28. Dupas MC, Halloy J, Chatzimpiros P. Time Dynamics and Invariant Subnetwork Structures in the World Cereals Trade Network. PLoS One (2019) 14:e0216318. doi:10.1371/journal.pone.0216318
29. Wu F, Guclu H. Global maize Trade and Food Security: Implications from a Social Network Model. Risk Anal (2013) 33:2168–78. doi:10.1111/risa.12064
30. Gephart JA, Rovenskaya E, Dieckmann U, Pace ML, Braennstroem A. Vulnerability to Shocks in the Global Seafood Trade Network. Environ Res Lett (2016) 11:035008. doi:10.1088/1748-9326/11/3/035008
31. Distefano T, Laio F, Ridolfi L, Schiavo S. Shock Transmission in the International Food Trade Network. PLoS One (2018) 13:e0200639. doi:10.1371/journal.pone.0200639
32. Moederl M, Sitzenfrei R, Fetz T, Fleischhacker E, Rauch W. Systematic Generation of Virtual Networks for Water Supply. Water Resour Res (2011) 47:W02502. doi:10.1029/2009WR008951
33. Suweis S, Konar M, Dalin C, Hanasaki N, Rinaldo A, Rodriguez-Iturbe I. Structure and Controls of the Global Virtual Water Trade Network. Geophys Res Lett (2011) 38:L10403. doi:10.1029/2011GL046837
34. Dalin C, Konar M, Hanasaki N, Rinaldo A, Rodriguez-Iturbe I. Evolution of the Global Virtual Water Trade Network. Proc Natl Acad Sci U S A (2012) 109:5989–94. doi:10.1073/pnas.1203176109
35. Carr JA, D’Odorico P, Laio F, Ridolfi L. On the Temporal Variability of the Virtual Water Network. Geophys Res Lett (2012) 39:L06404. doi:10.1029/2012GL051247
36. Konar M, Dalin C, Hanasaki N, Rinaldo A, Rodriguez-Iturbe I. Temporal Dynamics of Blue and green Virtual Water Trade Networks. Water Resour Res (2012) 48:W07509. doi:10.1029/2012WR011959
37. Dermody BJ, van Beek RPH, Meeks E, Goldewijk KK, Scheidel W, van der Velde Y, et al. A Virtual Water Network of the Roman World. Hydrol Earth Syst Sci (2014) 18:5025–40. doi:10.5194/hess-18-5025-2014
38. Tuninetti M, Tamea S, Laio F, Ridolfi L. To Trade or Not to Trade: Link Prediction in the Virtual Water Network. Adv Water Resour (2017) 110:528–37. doi:10.1016/j.advwatres.2016.08.013
39. Garcia S, Mejia A. Characterizing and Modeling Subnational Virtual Water Networks of US Agricultural and Industrial Commodity Flows. Adv Water Resour (2019) 130:314–24. doi:10.1016/j.advwatres.2019.06.013
40. Levine B, Nozick L, Jones D. Estimating an Origin-Destination Table for US Imports of Waterborne Containerized Freight. Transp Res E-logist Transp Rev (2009) 45:611–26. doi:10.1016/j.tre.2008.11.001
41. Press W, Teukolsky S, Vetterling W, Flannery B. Numerical Recipes in FORTRAN: The Art of Scientific Computing. Cambridge: Cambridge University Press (1996).
42. Wu Y, Zhou CS, Xiao JH, Kurths J, Schellnhuber HJ. Evidence for a Bimodal Distribution in Human Communication. Proc Natl Acad Sci U S A (2010) 107:18803–8. doi:10.1073/pnas.1013140107
43. Jiang ZQ, Xie WJ, Li MX, Podobnik B, Zhou WX, Stanley HE. Calling Patterns in Human Communication Dynamics. Proc Natl Acad Sci U.S.A (2013) 110:1600–5. doi:10.1073/pnas.1220433110
44. Li MX, Xiao QL, Wang Y, Zhou WX. Statistical Properties of the Mutual Transfer Network Among Global Football Clubs. Int J Mod Phys B (2018) 32:1850320. doi:10.1142/S0217979218503204
45. Fagiolo G. Clustering in Complex Directed Networks. Phys Rev E (2007) 76:026107. doi:10.1103/PhysRevE.76.026107
46. Tang J, Scellato S, Musolesi M, Mascolo C, Latora V. Small-world Behavior in Time-Varying Graphs. Phys Rev E (2010) 81:055101. doi:10.1103/PhysRevE.81.055101
47. Buettner K, Salau J, Krieter J. Adaption of the Temporal Correlation Coefficient Calculation for Temporal Networks (Applied to a Real-World Pig Trade Network). SpringerPlus (2016) 5:165. doi:10.1186/s40064-016-1811-7
48. Buettner K, Salau J, Krieter J. Temporal Correlation Coefficient for Directed Networks. SpringerPlus (2016) 5:1198. doi:10.1186/s40064-016-2875-0
49. Newman M. Assortative Mixing in Networks. Phys Rev Lett (2002) 89:208701. doi:10.1103/PhysRevLett.89.208701
50. Newman M. Mixing Patterns in Networks. Phys Rev E (2003) 67:026126. doi:10.1103/PhysRevE.67.026126
51. Foster JG, Foster DV, Grassberger P, Paczuski M. Edge Direction and the Structure of Networks. Proc Natl Acad Sci U S A (2010) 107:10815–20. doi:10.1073/pnas.0912671107
52. Maslov S, Sneppen K. Specificity and Stability in Topology of Protein Networks. Science (2002) 296:910–3. doi:10.1126/science.1065103
53. Onnela JP, Saramäki J, Kertész J, Kaski K. Intensity and Coherence of Motifs in Weighted Complex Networks. Phys Rev E (2005) 71:065103. doi:10.1103/PhysRevE.71.065103
54. Saramäki J, Kivela M, Onnela JP, Kaski K, Kertész J. Generalizations of the Clustering Coefficient to Weighted Complex Networks. Phys Rev E (2007) 75:027105. doi:10.1103/PhysRevE.75.027105
55. Bellingeri M, Bevacqua D, Scotognella F, Alfieri R, Cassi D. A Comparative Analysis of Link Removal Strategies in Real Complex Weighted Networks. Sci Rep (2020) 10:3911. doi:10.1038/s41598-020-60298-7
56. Wang W, Jiang J, An B, Jiang Y, Chen B. Toward Efficient Team Formation for Crowdsourcing in Noncooperative Social Networks. IEEE T Cybern (2017) 47:4208–22. doi:10.1109/TCYB.2016.2602498
57. Jiang J, An B, Jiang Y, Zhang C, Bu Z, Cao J. Group-oriented Task Allocation for Crowdsourcing in Social Networks. IEEE Trans Syst Man Cybern -Syst (2021) 51:4417–32. doi:10.1109/TSMC.2019.2933327
58. Bu Z, Li HJ, Zhang C, Cao J, Li A, Shi Y. Graph K-Means Based on Leader Identification, Dynamic Game, and Opinion Dynamics. IEEE Trans Knowl Data Eng (2020) 32:1348–61. doi:10.1109/TKDE.2019.2903712
59. Bu Z, Wang Y, Li HJ, Jiang J, Wu Z, Cao J. Link Prediction in Temporal Networks: Integrating Survival Analysis and Game Theory. Inf Sci (2019) 498:41–61. doi:10.1016/j.ins.2019.05.050
Keywords: econophysics, directed networks, weighted networks, network metrics, international pesticide trade networks
Citation: Li J-A, Xie W-J and Zhou W-X (2021) Structure and Evolution of the International Pesticide Trade Networks. Front. Phys. 9:681788. doi: 10.3389/fphy.2021.681788
Received: 17 March 2021; Accepted: 21 September 2021;
Published: 27 October 2021.
Edited by:
Emmanuel E. Haven, Memorial University of Newfoundland, CanadaReviewed by:
Jie Cao, Nanjing University of Finance and Economics, ChinaCopyright © 2021 Li, Xie and Zhou. This is an open-access article distributed under the terms of the Creative Commons Attribution License (CC BY). The use, distribution or reproduction in other forums is permitted, provided the original author(s) and the copyright owner(s) are credited and that the original publication in this journal is cited, in accordance with accepted academic practice. No use, distribution or reproduction is permitted which does not comply with these terms.
*Correspondence: Wen-Jie Xie, d2p4aWVAZWN1c3QuZWR1LmNu
Disclaimer: All claims expressed in this article are solely those of the authors and do not necessarily represent those of their affiliated organizations, or those of the publisher, the editors and the reviewers. Any product that may be evaluated in this article or claim that may be made by its manufacturer is not guaranteed or endorsed by the publisher.
Research integrity at Frontiers

Learn more about the work of our research integrity team to safeguard the quality of each article we publish.