 Zhang Zhaobo
 Liu Sheng
 Wei Yibo
 Li Hongnan1
94% of researchers rate our articles as excellent or good
Learn more about the work of our research integrity team to safeguard the quality of each article we publish.
Find out more
ORIGINAL RESEARCH article
Front. Phys. , 17 June 2021
Sec. Interdisciplinary Physics
Volume 9 - 2021 | https://doi.org/10.3389/fphy.2021.678263
This article is part of the Research Topic Advanced Sensing, Materials and Intelligent Algorithms for Multi-Domain Structural Health Monitoring View all 23 articles
Accurate measurement of the stain variation and effective distinguishment of the temperature-induced stress from the load-induced stress have been major objectives for strain sensors in crane monitoring. In this paper, a fiber Bragg grating (FBG) strain sensor with low temperature-sensitivity, packaged by two gripper tubes and stainless-steel tubes, is presented and applied in a bridge crane health monitoring project. Calibration experiments and reliability tests are conducted to evaluate the stain transferring characteristics of the sensors in a laboratory environment. The results show that the temperature coefficient of the sensor decreases from 10.5 pm/°C to 1.5 pm/°C and the strain coefficient increases from 1.2 pm/με to 4.8pm/με. On the other hand, the on-site tests show that these FBG strain sensors have the advantage of precision, reliability, and applicability. Meanwhile, the low temperature-sensitivity nature of the sensors is verified by the test results, which shows its promising potential in the health monitoring for a bridge crane.
Health monitoring for steel structures has been widely used in practical engineering. The bridge crane, suffering from the corrosive salt-spray environment as it works in port, is subjected to the coupling action of wind load and working load during its service period. The steel structure, which is the primary bearing component of a crane, may have cracksand deformations [1, 2]under long-term loads, which endanger the structure’s serviceability and strength.
Tochaei et al. [3] established a health monitoring system for the steel structure of the Manhattan Bridge to estimation fatigue life and reliability, and achieved good results. Hence, a viable real-time health monitoring system for cranes is in need.
With the development of information technology, researchers realized that monitoring various parameters of the crane can provide layers of protection in construction safety [4]. Among them, strain is one of the most significant parameters that can reflect the mechanical characteristics of metal structure [5]. Naturally, strain sensing has gradually become more and more critical in the field of real-time monitoring of the crane. A load moment indicator (LMI) is a system that aids the crane operator by sensing (directly or indirectly) the overturning moment on the crane (load multiplied by radius). Xu et al. [6] collected the structure stress by resistance strain gauges and established a complete monitoring system. Lalik et al. [7] calculated stresses in the base of the mast crane by surveying the inclination of the tower mast and jib by using a tacheometer to measure the coordinates of two prisms placed on the construction crane. However, for a crane designed to serve in a salt spray environment for more than 10 years, the aforementioned methods struggle to meet the requirements.
The fiber Bragg Grating (FBG) sensor has excellent anti-electromagnetic interference capability, corrosion-resistant, high precision, ease of installation, and durability [8–10]. The fiber Bragg grating sensor, which can monitor the structure’s internal response and mechanical properties, is an ideal choice for the crane monitoring system. However, the fiber Bragg Grating sensors are cross-sensitive to strain and temperature; it is difficult to distinguish the strain-induced wavelength variation and the temperature-induced one. In practical application, the thermal effect could easily overwhelm the strain effect, especially in environments with large temperature fluctuation. The effect of temperature has to be reduced or even eliminated [11–13].
In this paper, an FBG strain sensor with low temperature-sensitivity packaged by two gripper tubes and stainless-steel tubes is presented and applied in a bridge crane monitoring project. The objectives of this study are the following.
• To present the design theory of the sensor, including an introduction of the sensing principle of the fiber Bragg grating packaging mechanism. A theoretical derivation is presented for sensors with and without reverse-expanding packaging to unravel the advantage of the new design. Also, the temperature-sensitivity and reliability tests are conducted to compare these two types of FBG sensors.
• To investigate the structural health of the bridge crane, comparing the measured data of the FBG sensors and actual movement of the crane. The strain variation during a long-term monitoring project is presented to analyze the crane’s horizontal balance, maximum stress, residual stress, and its mechanical response to temperature fluctuation, predicting the crane’s safety.
The internal structure of the fiber Bragg grating strain sensor with low temperature- sensitivity is presented in Figure 1. The strain sensor consists of a fiber Bragg grating, gripper tube, and a layer of thermal shrinkage material.
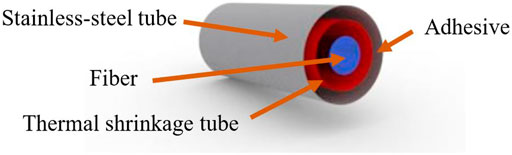
FIGURE 1. FBG strain sensor with low temperature-sensitivity.
The capillary stainless-steel tube is adopted as the gripper tube for the demands of corrosion resistance. To realize the low temperature-sensitivity property of the sensor, a thermal shrinkage material is used as a tube-insert to balance the effect of thermal expansion. As the wavelength of FBG changes due to thermal expansion, the correctly tuned thermal shrinkage material will counter such an effect. Considering both the variation of strain and temperature, the wavelength shift of the sensor is written as
Where
The third term, representing the wavelength variation contributed by the sensors’ own thermal fluctuation, can be further expanded as
Where
The first term,
Where
A schematic diagram of the FBG strain sensor is presented in Figure 2. The fiber in both sides of the FBG is packaged with epoxy resin in the tube insert, which is screwed on the mounting supports.
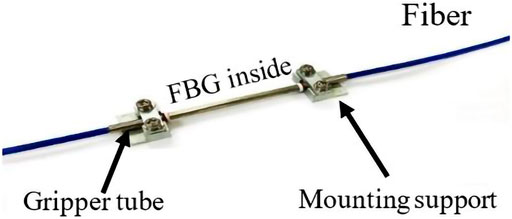
FIGURE 2. A schematic diagram of an Fiber Bragg Grating (FBG) strain sensor packaged by gripper tube.
The stress transferring loss between the epoxy resin and fiber can be neglected due to the adhesive thickness being less than the optical fiber’s diameter [14]. The fiber area is not in contact with the epoxy resin due to the FBG is installed on the surface of the structure by two mounting supports [15]; therefore, the FBG strain sensor eliminates the multi-peaks of reflective light from the nonuniform bonding distribution of the epoxy resin [15], the deformation and strain of the gripper tube and FBG and are written as
Where
It is seen from Eq. 8 that the strain ratio is 0.0084 [16]; due to the fiber’s strain being far less than the gripper tube’s strain and the fiber radius being far less than the gripper tube radius. It means that the strain of fiber is negligible compared to the strain of the gripper tube. Considering the low temperature-sensitivity nature of the sensor, the relation between the shift of the central wavelength of FBG and the strain of the sensor can be written as
Where the temperature influence can be ignored so that
Basic performance tests are needed to ensure sensors’ stability and efficiency before used in practical projects. In this section, the strain measurement accuracy, reliability, and low temperature-sensitivity of sensors are tested in the laboratory.
Accurate measurement of strain variation is the primary function of strain sensors. To investigate the strain sensor’s precision with low temperature-sensitivity, a calibration test of the FBG strain sensor was conducted by a universal testing machine. The steel plate was loaded continuously from 0 kN to 24 kN, and the data of the sensor was recorded once every 2 kN. To ensure the repeatability and consistency of the sensor, all measurements were taken several times.
The calibration tests results are plotted in Figure 3, showing the relation between the Bragg wavelength shift of the FBG sensor and the strain value. As the load increases, the wavelengths of the sensor increase, and the coefficient of linear association reached 0.9998. The results prove that the FBG strain sensor works well on the steel structure, such as cranes.
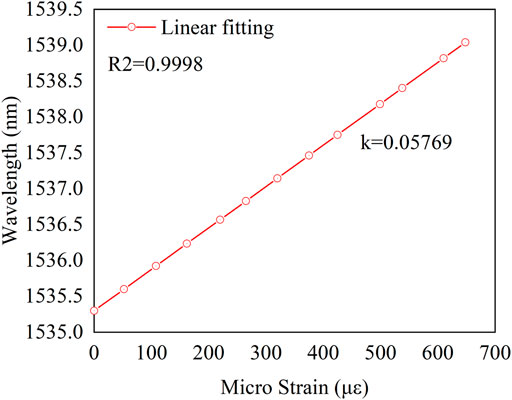
FIGURE 3. Results of Fiber Bragg Grating (FBG) strain sensor calibration test.
Reliability is another necessity of a sensor, especially in long-term structures monitoring, such as cranes with 10 years of service life. A total of 90,000 cyclic loads were performed on the sensor, which is mounted on the surface of a uniform strength beam by adhesive to record the central wavelengths of the FBG sensor.
The reliability test result is plotted in Figure 4, showing that the wavelength measurement result is consistent during the cyclic loads. The maximum wavelength variation amplitude in each cycle is stable at about 1.8 nm, and the reading returns to its original level at the end of each cycle. The results prove that the FBG strain sensors are indeed reliable.
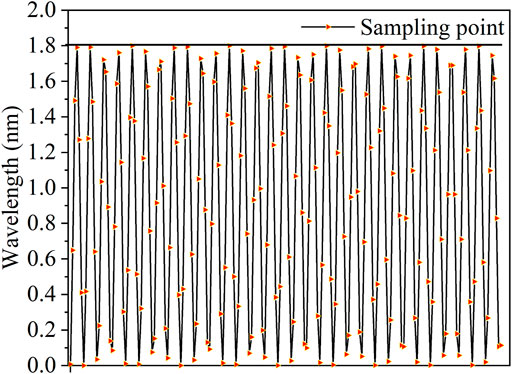
FIGURE 4. Results of the reliability tests.
Effective distinguishment of the temperature-induced stress from load-induced stress has been a major challenge for strain sensors. To test the sensor’s low temperature-sensitivity property, an experiment is conducted using a water bath method. The whole set-up was placed in a constant temperature tank to control and simulate the actual thermal fluctuation of the application more effectively.
The temperature varied from 20 to 70°C, and a mercury thermometer was used as a standard temperature gauge, which has a precision of 0.05°C. Firstly, the sensor was fixed on the clamping support, which is welded on a 10 mm thick steel plate. Then, the relation between the sensor wavelength and the tank’s temperature was recorded to investigate the sensor's temperature sensitivity.
The low temperature-sensitivity test data is plotted in Figure 5, showing that when the temperature changes from 20 to 70°C, the sensor’s maximum wavelength variation with the reverse-expansion packaging is only 0.004 nm. With the same conditions, the bare grating’s maximum wavelength variation is 0.3654 nm, which is 91 times more than the sensor with low temperature-sensitivity.
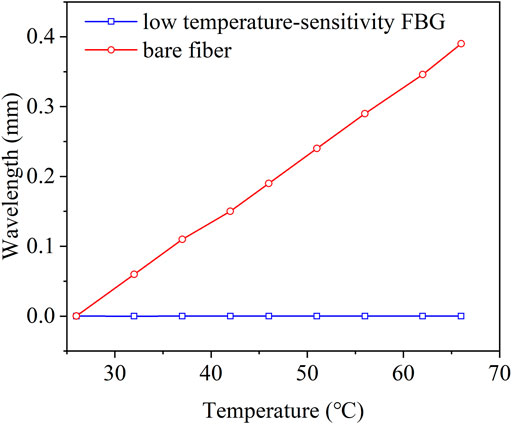
FIGURE 5. Results of the low temperature sensitivity tests.
Strain monitoring is one of the essential items in structural health monitoring. The mechanical conditions of the structure, such as cracks, can be reflected in strain response. An effective real-time and long-term monitoring of the strain provides the necessary information needed to evaluate the structure’s health; furthermore, understanding this information realizes the safety control of the structure.
Figure 6 shows that the bridge crane’s integral structure is symmetrical along the girder’s middle line. The weight-bearing area is composed of four rods, which are connected by steel connecting plates. The clamp moves on the girder and works on loading and unloading goods. If the force on the left and right rods are unbalanced during the crane operation, the girder will produce shear deformation that would cause the girder to overturn. Besides, as a complex region of stress, the connecting plates could lose their mechanical properties due to fatigue damage of steel structure. To sum up, the structure will deform under the action of load, which will induce the variation of the stress of the rods and connecting plates on the bridge crane. Therefore, according to the monitoring requirements, the strain of the bridge crane’s key components, such as the rods and the connecting plates, should be monitored primarily.
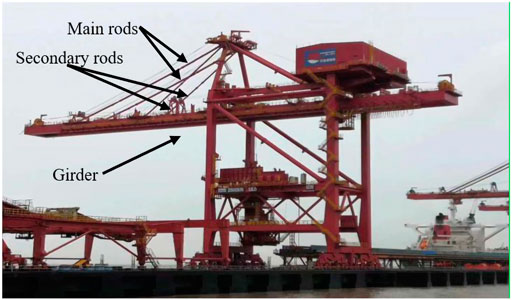
FIGURE 6. Integral structure of the bridge crane.
Since the rods are two-force bars and both ends are connected by hinge joints, forces should stretch all rod parts with the same magnitude, and the direction is axial, without bending moment and shear force (ignoring the effect of dead weight). Thus, the sensors installed on any location would have the same reading. In consideration of installation and maintenance, the sensors are installed at the lower end of the rods. The sensor layout scheme is shown in Figure 7. Four measuring points are arranged overall, one for each rod of the crane. The rod is made of H-shaped steel, the lateral stiffness is relatively large, and there is a certain stress transfer loss caused by welding. Therefore, it meets the monitoring requirements by installing one sensor in the web of each rod.
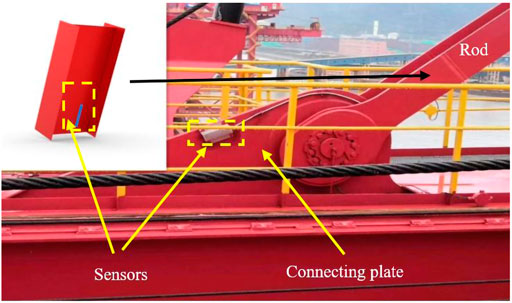
FIGURE 7. Sensor layout scheme.
As the linkage member between the rods and the girder, the direction of the resultant force at the connecting plate varies from time to time during crane operation. As a complex region of stress, the direction of the resultant force is difficult to calculate and measure; the meaningfulness of monitoring can be guaranteed only when the sensor is installed along the direction of the rod. One sensor is installed on each connecting plate in the same direction as the rod to ensure the crane’s dynamic balance and avoid the girder overturning caused by the fatigue damage of a connecting plate. A total of four sensors are installed on the part of connecting plates.
The crane was subjected to a loading task of 50 tons to observe the accuracy of the sensors installed on the rod. In this working condition, the girder of the crane was to keep flat, and the grab moved along the girder from the initial position to the bottom of the secondary rod and the front-end of the girder. Then, the grab backed to the initial position. The sensor recorded the whole process to verify the sensors’ accuracy and real-time performance by comparing the test data with the actual testing process.
Stage 1 described the grab’s motion from the initial position to the front-end of the girder. According to the influence line theory of structural mechanics, the force of the secondary rod should increase as the distance from the grab to the secondary rod decreases. The force of the secondary rod reached its maximum when the grab was right below the secondary rod. Then as the grab moved away from the secondary rod towards the main rod, the force of the secondary rod tended to decline, and the force of the main rod continued to rise until it reached its maximum, which meant that the grab reached the location of the main rod. The stress variation of the main rod and the secondary rod in Figure 8 describes the whole process; it is seen that when the grab was moved to the bottom of the secondary rod, the maximum stress of the secondary rod is 22.9 MPa, when the grab was moved to the bottom of the main rod, the maximum stress of the main rod is 44.2 MPa.
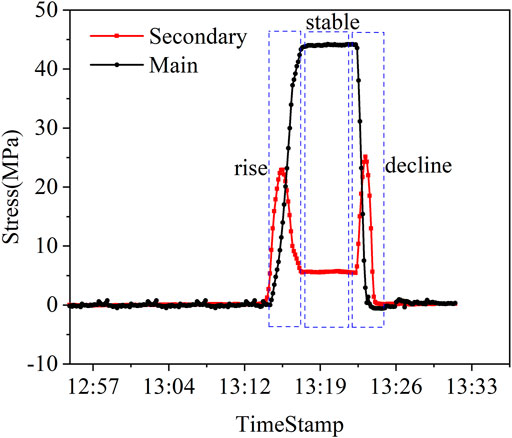
FIGURE 8. The stress course of rods during the accuracy test.
During stage 2, the system stayed still; thus, there was no change in stress shown in the monitoring. Stage 3 described the grab’s motion back to the initial position. As shown in Figure 8, as the grab moved to its initial position, the rods’ stress course was the opposite of the first stage. Noticeably, the stress curve of the main rod and the secondary rod both declined to the initial value gradually.
The test results show that the measured data of the sensor accurately describe the whole process. Moreover, there was no residual stress afterward, which means the loading procedure was within the structure’s elastic range and safety requirements.
The environmental thermal-fluctuation causes expansion of the crane’s girder, which will pull the rods generating tension thus strain. This alternating thermal field would produce fatigue damage on the structure during its long service life. It is challenging to monitor the real tension of rods induced by this thermal-mechanical effect of girder since regular sensors are cross-sensitive to strain and temperature. For this purpose, the test was done when the crane was in a horizontal and extended state with no load from May 1st to May 5th.
The sensor with low temperature-sensitivity monitored the rod’s mechanical response to the temperature fluctuation. It can be seen from Figure 9 that the maximum stress was about 5 MPa on a rainy day with low temperature-fluctuation, and it was about 15 MPa on a sunny day with high temperature-fluctuation. The FBG with the reverse-expansion packaging indeed reflected the predicted behavior of the stress. The main rod suffers more from the alternating temperature, as it is attached at the girder’s rear end. Also, the greater the difference in temperature, the bigger the variation in stress.
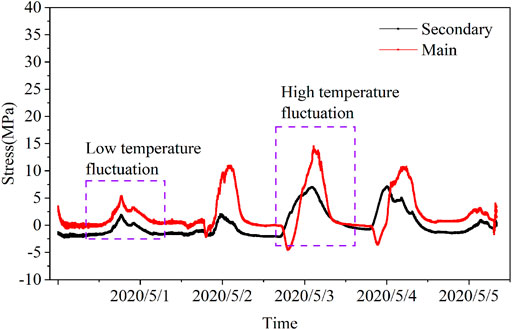
FIGURE 9. The stress course of rods in different temperature.
The magnitude of this thermal-mechanical stress response is approximately one-third of the maximum stress in the accuracy test mentioned in the previous section; this information is not to be neglected for the safety of the structure.
The crane was subjected to long-term monitoring to observe the reliability of the sensors. As shown in Figure 10, the sensor monitored the crane’s stress variation of the primary and secondary rod from April 30th to December 23rd. During this time, the maximum stress of the right rod reached 50.6 MPa, and the maximum stress of the left rod reached 48.6 MPa. Because the rods are made of Q345 steel, the yield strength of 345 steel is about 345 MPa and the tensile strength of 345 steel is about 490MPa, which is within the safety range. Also, the sensors’ output returned to zero after each measurement, which proves that the sensor remains highly accurate and reliable in long-term monitoring.
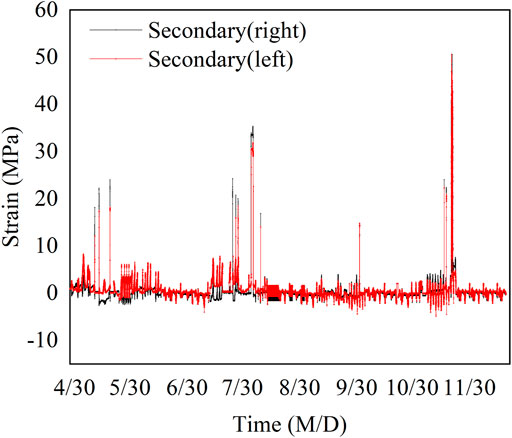
FIGURE 10. The stress course of rods during the long-term monitoring test.
A new configuration for an FBG strain sensor with low temperature-sensitivity was characterized, calibrated, and applied in a crane monitoring project. Its various properties were demonstrated on the field. The calibration shows that the actual sensitivity of the sensor, packaged with reverse-expand material, agrees well with the theoretical calculation. The reliability test demonstrates that the sensor maintains highly consistent under 90,000 cycle load tests. The low temperature-sensitivity experiment demonstrates that the sensor is less affected by temperature than the bare fiber, which means that it is more suitable for the long-term monitoring of the structure that serves in a thermally unstable environment.
FBG strain sensors with low temperature-sensitivity have been installed on the rods and connecting plates of the crane to monitor the crane’s stress variation in an actual working situation. The accuracy test results and the temperature-sensitive test show that the sensor with low temperature-sensitivity can eliminate the effect of temperature and accurately monitor the mechanical response of temperature fluctuation. The long-term monitoring test results show that the sensor maintained high reliability during the crane operation. It is proved that the sensor has a promising potential in the structural health monitoring of cranes.
The raw data supporting the conclusions of this article will be made available by the authors, without undue reservation.
ZZ, LS, and LH contributed to conception and design of the study. ZZ and WY analyzed data. ZZ, LS, and WY wrote sections of the manuscript. All authors contributed to manuscript revision, read, and approved the submitted version.
The authors declare that the research was conducted in the absence of any commercial or financial relationships that could be construed as a potential conflict of interest.
1. Wang C, Mi G, Zhang X. Welding Stability and Fatigue Performance of Laser Welded Low alloy High Strength Steel with 20 Mm Thickness. Opt Laser Tech (2021) 139:106941. doi:10.1016/j.optlastec.2021.106941
2. Song X, Li H, Wang X, Zhang J. Experimental Investigation of Ultra-low-cycle Fatigue Behaviors of Plate Bearings in Spatial Grid Structures. Eng Structures (2021) 231(4):111764. doi:10.1016/j.engstruct.2020.111764
3. Tochaei EN, Fang Z, Taylor T, Babanajad S, Ansari F. Structural Monitoring and Remaining Fatigue Life Estimation of Typical Welded Crack Details in the manhattan Bridge. Eng Structures (2021) 231(2):111760. doi:10.1016/j.engstruct.2020.111760
4. Reason J. Human Error. Cambridge: Cambridge University Press (1990). doi:10.1017/cbo9781139062367
5. Meng WJ, Hong TW. Design of Stress Monitoring and Safety Assessment System for Crane Metal Structure Based on Virtual Instrument. Amm (2012) 152-154:1492–7. doi:10.4028/www.scientific.net/amm.152-154.1492
6. Xu M, Ni J, Chen GJ. Research on the Wireless Monitoring System for Port Crane Structure Stress. Amm (2013) 278-280:920–3. doi:10.4028/www.scientific.net/AMM.278-280.920
7. K LI, Dominik WP, KwaNiewski J. Integrated Stress Measurement System in tower crane Mast. Measurement (2017) 102:47–56. doi:10.1016/j.measurement.2017.01.041
8. Moyo P, Brownjohn JMW, Suresh R, Tjin SC. Development of Fiber Bragg Grating Sensors for Monitoring Civil Infrastructure. Eng Structures (2005) 27(12):1828–34. doi:10.1016/j.engstruct.2005.04.023
9. Kersey AD, Davis MA, Patrick HJ, LeBlanc M, Koo KP, Askins CG, et al. Fiber Grating Sensors. J Lightwave Technol (1997) 15:1442–63. doi:10.1109/50.618377
10. Li H-N, Li D-S, Song G-B. Recent Applications of Fiber Optic Sensors to Health Monitoring in Civil Engineering. Eng Structures (2004) 26:1647–57. doi:10.1016/j.engstruct.2004.05.018
11. Li X-X, Ren W-X, Bi K-M. FBG Force-Testing Ring for Bridge Cable Force Monitoring and Temperature Compensation. Sensors Actuators A: Phys (2015) 223:105–13. doi:10.1016/j.sna.2015.01.003
12. Khan MM, Panwar N, Dhawan R. Modified Cantilever Beam Shaped FBG Based Accelerometer with Self Temperature Compensation. Sensors Actuators A: Phys (2014) 205:79–85. doi:10.1016/j.sna.2013.10.027
13. Hsu YS, Likarn Wang L, Wen-Fung Liu WF, Chiang YJ. Temperature Compensation of Optical Fiber Bragg Grating Pressure Sensor. IEEE Photon Technol Lett (2006) 18(7):874–6. doi:10.1109/LPT.2006.871832
14. Lin YB, Chang KC, Chern JC, Wang LA. Packaging Methods of Fiber-Bragg Grating Sensors in Civil Structure Applications. Sensors (2005) 5:419–24. doi:10.1109/JSEN.2005.844539
15. Iwashima T, Inoue A, Shigematsu M, Nishimura M, Hattori Y. Temperature Compensation Technique for Fibre Bragg Gratings Using Liquid Crystalline Polymer Tubes. Electron Lett (1997) 33(5):417. doi:10.1049/el:19970289
Keywords: bridge Crane1, FBG sensor2, accurate measurement3, low temperature-sensitivity4, long-term monitoring5
Citation: Zhaobo Z, Sheng L, Yibo W and Hongnan L (2021) Structural Health Monitoring for Bridge Crane Based on Low Temperature-Sensitivity FBG Sensors. Front. Phys. 9:678263. doi: 10.3389/fphy.2021.678263
Received: 09 March 2021; Accepted: 03 June 2021;
Published: 17 June 2021.
Edited by:
Qingzhao Kong, Tongji University, ChinaReviewed by:
Niravkumar J. Joshi, University of Sao Paulo, BrazilCopyright © 2021 Zhaobo, Sheng, Yibo and Hongnan. This is an open-access article distributed under the terms of the Creative Commons Attribution License (CC BY). The use, distribution or reproduction in other forums is permitted, provided the original author(s) and the copyright owner(s) are credited and that the original publication in this journal is cited, in accordance with accepted academic practice. No use, distribution or reproduction is permitted which does not comply with these terms.
*Correspondence: Zhang Zhaobo, emh6YjE5OTJAMTYzLmNvbQ==
Disclaimer: All claims expressed in this article are solely those of the authors and do not necessarily represent those of their affiliated organizations, or those of the publisher, the editors and the reviewers. Any product that may be evaluated in this article or claim that may be made by its manufacturer is not guaranteed or endorsed by the publisher.
Research integrity at Frontiers
Learn more about the work of our research integrity team to safeguard the quality of each article we publish.