 Tao Peng
 Xingchen Zhao1
 Marlan O. Scully
95% of researchers rate our articles as excellent or good
Learn more about the work of our research integrity team to safeguard the quality of each article we publish.
Find out more
ORIGINAL RESEARCH article
Front. Phys. , 21 April 2021
Sec. Optics and Photonics
Volume 9 - 2021 | https://doi.org/10.3389/fphy.2021.657333
This article is part of the Research Topic Coherent Phenomena in Molecular Physics View all 15 articles
We propose and demonstrate a method for measuring the time evolution of the off-diagonal elements ρn,n+k(t) of the reduced density matrix obtained from the quantum theory of the laser. The decay rates of the off-diagonal matrix element ρn,n+k(t) (k = 2,3) are measured for the first time and compared with that of ρn,n+1(t), which corresponds to the linewidth of the laser. The experimental results agree with the Scully-Lamb quantum theory of the laser.
Quantum coherence effects in molecular physics are largely based on the existence of the laser [1]. Indeed, in most of our experiments and calculations we take the laser to be an ideal monochromatic light source. If the laser linewidth is important then we usually just include a “phase diffusion” linewidth into the logic. But what if we are thinking about higher order correlation effects in an ensemble of coherently driven molecules. For example, photon correlation and light beating spectroscopy involving Glauber second order correlation functions [2, 3]. Furthermore, third and higher order photon correlations of the laser used to drive our molecular system can be important. The investigation of higher order quantum laser noise is the focus of the present paper.
Fifty years ago the Scully-Lamb (SL) quantum theory of the laser (QTL) was developed using a density matrix formalism [4]. In the interesting threshold region [5, 6] the steady state laser photon statistics is given by the diagonal elements of the laser density matrix as
where α is the linear gain, β is the non-linear saturation coefficient, γ is the cavity loss rate, and 𝔑 is the normalization constant:
Equation (1) is plotted in Figure 1 where it is compared with a coherent state.
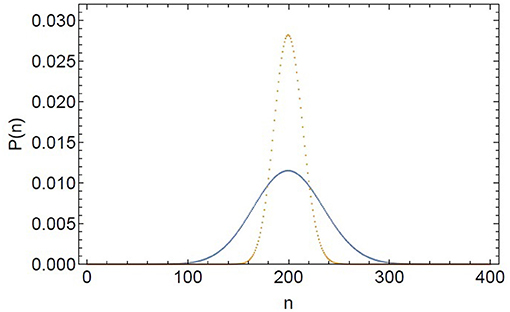
Figure 1. Steady state photon distribution function for coherent (orange dashed line) and laser radiation (blue solid line). The laser is taken to be 20 percent above threshold, 〈n〉 = 200.
The formalism developed in the QTL density matrix analysis has since been successfully applied to many other physical systems such as the single-atom maser(aka the micromaser) [7], the Bose-Einstein condensate (aka the atom laser, see Table 1) [8], pion physics [9], etc. Other applications of the formalism have been developed recently and more will likely emerge. Thus, we are motivated to deeper our understanding of the QTL by further analyzing and experimentally verifying the time dependence of off-diagonal elements . The diagonal elements of the laser density matrix for which k = 0, have been well-studied. Not as for the off-diagonal elements. In particular yields the Schawlow-Townes laser linewidth. But what about the higher order correlations k = 2, 3⋯ ? That is the focus of the current paper.
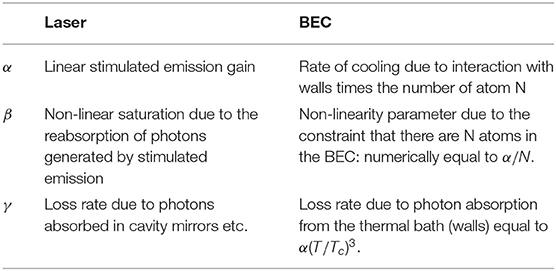
Table 1. Parameters in laser and BEC systems.
The off-diagonal elements vanish at steady state, regressing to zero as [4]
where is the Schawlow-Townes phase diffusion linewidth and . The expectation value of the laser amplitude operator is given by
where ν is the center frequency of the laser field and the electric field per photon is given by , where ϵ0 is the permittivity of free space and V is the laser cavity volume.
As is discussed in the following, the second order off-diagonal elements are given by the field operator averages
and the third order off-diagonal elements are given by
Equation (4) gives the time evolution associated with the first order off-diagonal elements , yielding the spectral profile of the laser. The heterodyne method is usually adapted to measure the linewidth of the laser [10, 11], in which case the center frequency is shifted from optical frequency to the radio frequency range. A natural way to measure the laser linewidth is to beat two almost identical but uncorrelated lasers [12] such that the beat frequency between the lasers is in the MHz range. The result, as seen from Equation (10), is twice of the laser linewidth when the two independent lasers are nearly identical.
Many experiments have been carried out to determine the linewidth [10] and photon statistics [13] of the laser. Other experiments have measured the intensity correlation of the laser at threshold [14], revealing the influence of the intensity fluctuation on the laser spectrum. However, to the best of our knowledge, no measurements have been made of the higher order phase correlations (k ≥ 2). Here we measure the second and third correlation of the heterodyne signals from two independent lasers, which yields the second and third order time evolution of a laser above threshold. Specifically, we performed the following experiments: the first set of experiments is to measure the spectral profile of the laser beat note, i.e., allows us to measure the decay rate as shown in Equation (4). The other two sets of experiments determine the spectral profile of the second and third order correlated beat notes, this allows us to measure the decay rate as shown in Equations (5) and (6).
Figure 2 illustrates the setup of the first set of experiments. This is a typical heterodyne detection setup, the center frequency between the two He-Ne lasers is in the MHz range. This difference allows us to analyze the beat signal around a non-zero value hence the full shape of the linewidth is obtained unambiguously. A non-polarizing beamsplitter (BS) is used to mix the two laser beams. The beat signal is then directed to the photodiode (D1) after the BS. A fast Fourier transform (FFT) of the signal is performed by the spectrum analyzer (SA) giving the frequency spectrum of the beat note.
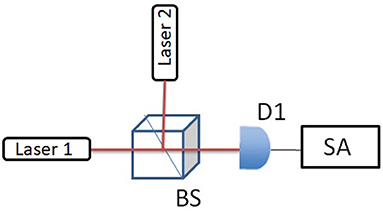
Figure 2. Experimental setup used in measuring the spectrum of the beat note between lasers 1 and 2. The beat note signal is measured by the detector (D1) and analyzed by the spectrum analyzer(SA). BS, non-polarizing beamsplitter.
For the first set of experiments, the first order coherence function [3, 4] is
where ρ = ρ1 ⊗ ρ2 is the density operator of the system, ρ1 and ρ2 represent the density operators of laser 1 and 2, ν1 and ν2 represent the center frequencies of the lasers 1 and 2, respectively.
From the above equation, we can see the only terms that carry the beat note frequency are
with its complex conjugate which contributes to the −ν0 frequency component, where ν0 ≡ ν2 − ν1. Under the condition that the two lasers are independent, we can rewrite Equation (8) as
Taking the Fourier transform, we have a Lorentzian spectrum centered at the beat frequency ν0 with a width , which is essentially twice the width of one laser
The second and third experiments measure the spectral profile of the second and third order correlation of beat notes, the setup is shown in Figure 3. We used the same two lasers to create the beat signal, where three detectors Di(i = 1, 2, 3) are used. The outputs from the photodiodes are used as inputs for a frequency mixer. The output from the mixer is then sent to the spectrum analyzer and the frequency spectrum of the correlated signal is obtained after the FFT. As shown in Figure 3, this set of experiments measures the laser field correlation that is governed by the time evolution of the second and third order off-diagonal elements and , respectively. The quantity we now measure is determined by the correlation of the heterodyne signals from detectors as in Figure 3. We have the signal of interest at frequency 2ν0 from the second order coherence function is
The correlated heterodyne signal is
Taking the Fourier transform, we get a Lorentzian spectral profile centered at 2ν0 with a width of 4D′
similarly, the signal of interest at frequency 3ν0 from the third order coherence function is
The correlated heterodyne signal is
We therefore get a Lorentzian spectral profile centered at 3ν0 with a width of 9D′
The main experimental results are shown in Figure 4. All measurements were taken with the laser operating at the same average output power level. The resolution bandwidth (RBW) of the SA is 10 kHz, video bandwidth (VBW) is 30 kHz in all the measurements. For the sake of simplicity, the Full width at half maximum (FWHM) linewidth is taken at the -3 dB width of the measured spectrum by considering only the Lorentzian fitting [12]. Figure 4A represents the data of the first set of experiments with an average of 50 measurements of beat note signal from D1. The theoretical fitting in the red solid line is based on Equation (10), and the FWHM is 107.9 kHz. Figure 4B represents the data of the second set of experiments with 50 measurements of correlated beat note signals from D1 and D2. The theoretical fitting in the red solid line is based on Equation (13), and the FWHM is estimated to be 420.6 kHz. Figure 4C represents the data of the third order experiments with 50 measurements from all three detectors. The theoretical fitting in the red solid line is based on Equation (16), and the FWHM is estimated to be 963.3 kHz. First of all, we see that the obtained linewidth from the second order correlation spectrum is essentially 4 times wider than that of the single beat note linewidth, as well as the third order spectrum is 9 times wider than that of the single beat note linewidth, validating our theoretical expectation. Secondly, we see that the theoretical curves fit the data well in the center peak, but not as good at the tails. This is mainly due to the influences from other noises that also contribute to the spectral profile. For the same reason, we see that the single beat note signal can be better fitted than the second and third order correlation signals. There are some small peaks in the higher order measurements, due to our remeasured higher order spectral signal is close to the noise level of the detection system. Ideally, more averaging (≫50) should be able to smooth out these peaks. However, we note here that, there is a trade-off between time averaging and the accurate measurement of the center beat note frequency, due to the drifting of center frequencies of the two lasers. Further using an intense local oscillator and sensitive detection system (detector and spectral analyzer) should be able to solve this issue. Nevertheless, our data confirms the Lorentizan spectral profile of the signal and the time evolution described by Equation (3), in the case of k = 1, k = 2, and k = 3.
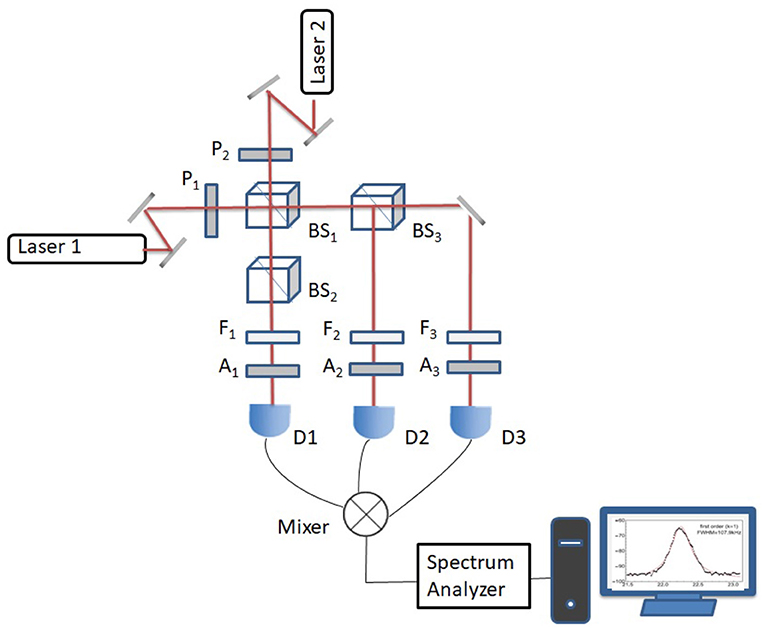
Figure 3. Schematic setup for measuring higher order spectral line distribution up to 3rd order. Laser 1 and 2 : He-Ne lasers; P, polarizer; F, filter; A, analyzer; BS, non-polarizing beamsplitter; Mixer, frequency mixer; D1, D2, and D3, photodiode detectors.
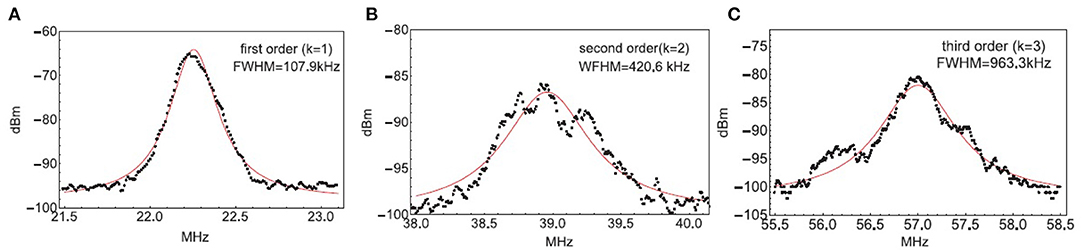
Figure 4. Experimental results from the two sets of measurements. The bandwidths of the detectors are 50 MHz, the resolution bandwidth of the SA is 10 kHZ. The black dots are experimental data and the red curves are theory. (A) is the beat signals from D1, where the FWHM is 107.9 kHz with average 50 times. Theory is the Fourier transform of the laser fields time evolution (e−D′t) associated with frequency ν0, as shown in Equation (10); (B) is correlated signal from D1 and D2, where the FWHM bandwidth is 420.6 kHz with average 50 times. Theory is the Fourier transform of the correlated laser fields time evolution (e−4D′t) associated with frequency 2ν0, as shown in Equation (13). (C) is correlated signal from D1, D2, and D3, where the FWHM is 963.3 kHz with average 50 times. Theory is the Fourier transform of the correlated laser fields time evolution (e−9D′t) associated with frequency 3ν0, as shown in Equation (16).
In conclusion, we have studied the time evolution of the higher degrees of off-diagonality obtained SL theory of the laser. We particularly measured the bandwidth of the laser beat note and the bandwidth of the correlated laser beat note, which reveal the evolution of the first, second, and third order off-diagonal elements of the laser density operator. The higher order spectra reveal the influence of the randomness in the phase of the laser field due to quantum fluctuation. Experimental results agreed with the SL QTL showing that the bandwidth of the third order and second order spectral profile are nine times and four times wider than that of the first order spectral profile, respectively.
The raw data supporting the conclusions of this article will be made available by the authors, without undue reservation.
TP, YS, and MS discussed the design principle. TP and XZ performed the experiment and data analysis. TP and MS wrote the paper. All the authors polished the paper.
This study was funded by Air Force Office of Scientific Research (Award No. FA9550-20-1-0366 DEF), Office of Naval Research (Award No. N00014-20-1-2184), Robert A. Welch Foundation (Grant No. A-1261), National Science Foundation (Grant No. PHY-2013771), King Abdulaziz City for Science and Technology (KACST).
The authors declare that the research was conducted in the absence of any commercial or financial relationships that could be construed as a potential conflict of interest.
We thank Z. H. Yi, R. Nessler, H. Cai, and J. Sprigg for helpful discussion.
1. Pestov D, Murawski RK, Ariunbold GO, Wang X, Zhi M, Sokolov AV, et al. Optimizing the laser-pulse configuration for coherent Raman spectroscopy. Science. (2007) 316:265–8. doi: 10.1126/science.1139055
2. Cummins H. Photon Correlation and Light Beating Spectroscopy. Vol. 3. Springer Science & Business Media (2013).
3. Glauber RJ. The quantum theory of optical coherence. Phys Rev. (1963) 130:2529. doi: 10.1103/PhysRev.130.2529
5. Haken H. Theory of intensity and phase fluctuations of a homogeneously broadened laser. Z Phys. (1966) 190:327–56. doi: 10.1007/BF01333598
6. DeGiorgio V, Scully MO. Analogy between the laser threshold region and a second-order phase transition. Phys Rev A. (1970) 2:1170. doi: 10.1103/PhysRevA.2.1170
7. Meschede D, Walther H, Müller G. One-atom maser. Phys Rev Lett. (1985) 54:551. doi: 10.1103/PhysRevLett.54.551
8. Scully MO. Condensation of N bosons and the laser phase transition analogy. Phys Rev Lett. (1999) 82:3927. doi: 10.1103/PhysRevLett.82.3927
9. Hoang T. Remarks on the charged multiplicity of hadronic Z 0 (91) decays. Z Phys C Part Fields. (1997) 73:149–52. doi: 10.1007/s002880050304
10. Okoshi T, Kikuchi K, Nakayama A. Novel method for high resolution measurement of laser output spectrum. Electron Lett. (1980) 16:630–1. doi: 10.1049/el:19800437
11. Richter L, Mandelberg H, Kruger M, McGrath P. Linewidth determination from self-heterodyne measurements with subcoherence delay times. IEEE J Quant Electron. (1986) 22:2070–4. doi: 10.1109/JQE.1986.1072909
12. Muanzuala L, Ravi H, Sylvan K, Natarajan V. Measuring the linewidth of a stabilized diode laser. arXiv preprint arXiv:151003683 (2015).
13. Arecchi FT. Measurement of the statistical distribution of Gaussian and laser sources. Phys Rev Lett. (1965) 15:912. doi: 10.1103/PhysRevLett.15.912
Keywords: high order coherence, quantum theory of the laser, spectral line distribution, density matrix, heterodyne detection
Citation: Peng T, Zhao X, Shih Y and Scully MO (2021) High Order Coherence Functions and Spectral Distributions as Given by the Scully-Lamb Quantum Theory of the Laser. Front. Phys. 9:657333. doi: 10.3389/fphy.2021.657333
Received: 22 January 2021; Accepted: 23 March 2021;
Published: 21 April 2021.
Edited by:
Tamar Seideman, Northwestern University, United StatesReviewed by:
Qing Ai, Beijing Normal University, ChinaCopyright © 2021 Peng, Zhao, Shih and Scully. This is an open-access article distributed under the terms of the Creative Commons Attribution License (CC BY). The use, distribution or reproduction in other forums is permitted, provided the original author(s) and the copyright owner(s) are credited and that the original publication in this journal is cited, in accordance with accepted academic practice. No use, distribution or reproduction is permitted which does not comply with these terms.
*Correspondence: Marlan O. Scully, c2N1bGx5QHRhbXUuZWR1
Disclaimer: All claims expressed in this article are solely those of the authors and do not necessarily represent those of their affiliated organizations, or those of the publisher, the editors and the reviewers. Any product that may be evaluated in this article or claim that may be made by its manufacturer is not guaranteed or endorsed by the publisher.
Research integrity at Frontiers
Learn more about the work of our research integrity team to safeguard the quality of each article we publish.