- 1National Climate Center, China Meteorological Administration, Beijing, China
- 2Institute of Arid Meteorology, China Meteorological Administration, Lanzhou, China
- 3Southern Marine Science and Engineering Guangdong Laboratory, Zhuhai, China
- 4Institute of Physics Science and Technology, Yangzhou University, Yangzhou, China
- 5School of Mathematics and Physics, Yancheng Institute of Technology, Yancheng, China
Droughts have more impact on crops than any other natural disaster. Therefore, drought risk assessments, especially quantitative drought risk assessments, are significant in order to understand and reduce the negative impacts associated with droughts, and a quantitative risk assessment includes estimating the probability and consequences of hazards. In order to achieve this goal, we built a model based on the three-dimensional (3D) Copula function for the assessment of the proportion of affected farmland areas (PAFA) based on the idea of internally combining the drought duration, drought intensity, and drought impact. This model achieves the “internal combination” of drought characteristics and drought impacts rather than an “external combination.” The results of this model are not only able to provide the impacts at different levels that a drought event (drought duration and drought intensity) may cause, but are also able to show the occurrence probability of impact at each particular level. We took Huize County and Mengzi County in Yunnan Province as application examples based on the meteorological drought index (SPI), and the results showed that the PAFAs obtained by the method proposed in this paper were basically consistent with the actual PAFAs in the two counties. Moreover, due to the meteorological drought always occurring before an agricultural drought, we can get SPI predictions for the next month or months and can further obtain more abundant information on a drought warning and its impact. Therefore, the method proposed in this paper has values both on theory and practice.
Introduction
Droughts are a complex and recurrent natural disaster that result in widespread effects on humans and natural systems, including agriculture, ecosystems, energy, economics, and so forth [1–8]. A drought can be commonly classified into four types: meteorological, agricultural, hydrological, and socioeconomic, and the meteorological drought has received more attention as it usually occurs before the other three types of drought [1, 9].
Over the past decades, droughts around the world have caused tremendous economic losses on an annual basis [10, 11]; furthermore, droughts are a major cause of unexpected crop failure (in corn, rice, and wheat). In China, problematically frequent occurrences of drought have resulted in great impacts on social and economic development and human life [12, 13], and historical disaster data show that the average annual area of crop damage due to drought accounted for 50% of all areas affected by meteorological disasters over the period of 2004–2013 [14]. Due to rising temperatures and increasing climatic variability [15–18], it is widely recognized that droughts may become more frequent and more serious globally in the coming decades on regional and temporal levels [17, 19, 20]. In this context, the challenges faced by agricultural production will become more severe. In addition, the possibility of soil desertification will increase under prolonged drought, so sand prevention and control also face major challenges [21, 22]. Therefore, drought risk assessment, especially quantitative drought risk assessment, is required in order to reduce the negative impacts associated with droughts [23–26].
Quantitative drought risk assessment includes estimating the probability and consequences of a drought disaster [27]. To achieve this, we need on three levels to (i) characterize the drought statistically in terms of its relative severity; e.g., exceeding probability [28], (ii) quantify the consequences of a given drought event [29], and (iii) estimate the consequences of droughts with varying severity. The key point here is to separate “droughts” from “non-droughts” [30]. Although studies have proven that risk assessment results on the impacts or losses provided by statistical methods and physical models are reliable and valid [31–36], the accurate assessment of drought impacts on agricultural production is not easy to calculate, and there are still various data-related and methodological problems that need to be solved [37, 38]. In particular, these include the requirement of (i) the time series of drought index with sufficient spatial and temporal details in order to obtain enough information on the local meteorological and hydrological conditions, and (ii) the accurate, high-resolution, long-term yield or economic loss databases [36]. Therefore, a complete description of a drought disaster requires multiple related variables, and the appropriate option is a multivariate analysis using the Copula function [39]. The Copula function is a statistical tool, which can used to construct a multivariate joint distribution function for analyzing the statistical characteristics of dependent variables. However, the applications of the Copula technique in assessing the impacts of droughts on agricultural production are very limited in published literature, and almost all research has been performed to obtain the qualitative relationships between drought characteristics and the degree of a potential disaster [32, 40–46]. Moreover, most previous studies use two-dimensional Copula functions, and crop damage data are not often used as a variable to be substituted into the Copula function, but are instead used as an independent variable in combination with the comprehensive features of a drought obtained by the Copula function.
The goal pursued by many international researchers is to obtain objective results and reduce subjective judgments through the use of statistical methods and physical models to provide more accurate drought information and warnings for the prevention of disasters and to reduce losses. It is of more practical significance to assess the specific impacts of droughts with different severities and durations, and to see how crop damage data are substituted directly into the Copula function as one of the variables in assessing the impact of droughts. However, there is no published work that uses the above ideas to study the impact of droughts, so it is, therefore, worth studying in further detail. Therefore, the objective of this paper is to make a breakthrough in this respect.
Combining the above reasons, in this paper we propose a three-dimensional (3D) Copula model for the assessment of drought risks in terms of agriculture. We built a model based on the three-dimensional (3D) Copula function for the assessment of the proportion of affected farmland areas for the purpose of quantitative drought risk assessment. We calculated the proportion of affected farmland areas (PAFA) based on the farmland areas affected by droughts and the annual agricultural planting area, and then obtained the PAFA time series caused by each drought event. The reason behind using PAFA as the assessment object is that the affected area is a result of drought; thus, the impacts of “droughts” can be clearly separated from those of “non-droughts.” Next, we extracted drought events from a monthly standardized precipitation index (SPI) time series, which is calculated based on precipitation data and satisfies a standard normal distribution. After, we calculated the parameters of the duration and the severity of a drought, as well as the PAFA, and thus, the marginal distribution functions of duration, severity, and PAFA were obtained, and their joint distribution function was then computed using a three-dimensional Copula function. The joint probability and the classification of these three variables were both achieved using this 3D statistical model. Different types of drought events were identified based on the combination of these variables, and the probabilities of occurrence of the drought events were calculated. Thus, the estimation of the PAFA of a drought event could be obtained by integrating this method with the monitoring of current droughts and the prediction of future droughts.
Study Area and Data
Study Area
Yunnan Province, located in the southwest of China, is influenced primarily by the South Asian monsoon and also impacted by the East Asian monsoon, the Tibetan Plateau monsoon, and westerlies [47]. The soil in Yunnan Province is covered by a large area of karst landforms and characterized by poor water conservation. Due to the complicated land surface terrain, as well as the control and influence of different general circulation patterns, the seasonal and geographical distributions of precipitation are extremely uneven in Yunnan, and droughts have become one of the most extensive, frequent, and severe natural disasters in Yunnan Province [48–50]. Yunnan's crops mainly include rice, wheat, and corn, among others, and the crops are normally fed and cultivated with rain.
Because in this article we are trying to build a Copula-based three-dimensional (3D) risk analysis model, including the duration and intensity of the drought, as well as the PAFA, only the areas where the three types of data (SPI, affected farmland areas caused by droughts, and annual agricultural planting area) that meet the following three requirements can therefore be used as the research area in this article: (i) the daily precipitation series as long as possible without missing values, (ii) the number of disaster loss records (affected farmland areas caused by droughts) from 1984 to 2012 should be as much as possible, and (iii) the annual agricultural planting area from 1984 to 2012 requires as much continuous data as possible. Figure 1 shows the spatial distribution of the number of disaster loss records caused by droughts from 1984 to 2012 submitted by each county in Yunnan Province, and the stations that comply with the requirement in Yunnan Province are also shown in Figure 1. After a survey of all the stations (counties) in Yunnan Province, it was found that two stations (counties) met the above three requirements: Huize county and Mengzi county.
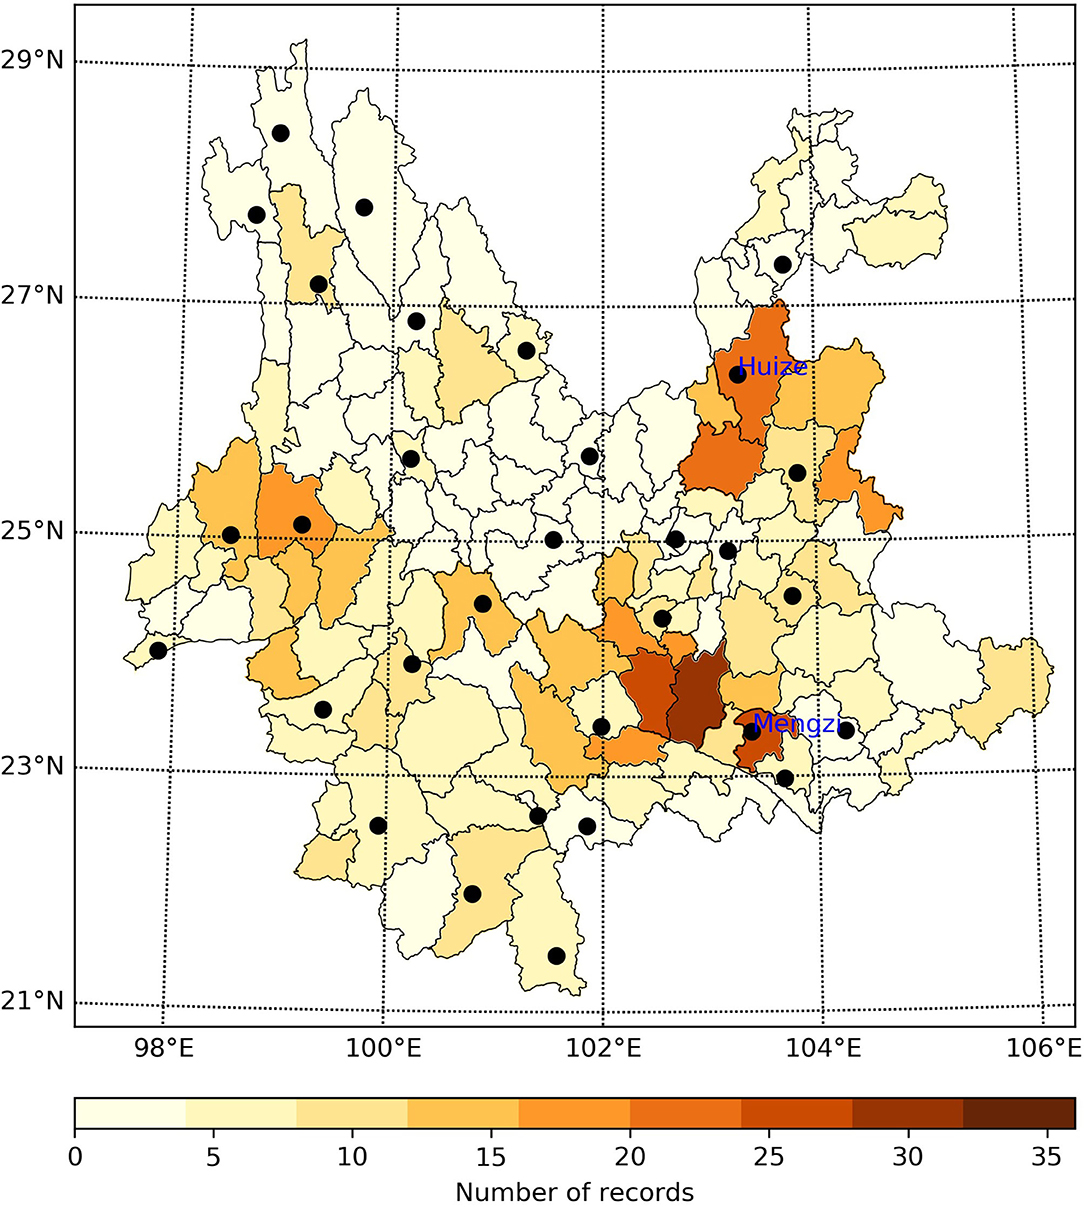
Figure 1. The distribution of the number of damage records (affected farmland areas by drought, 1984–2012) in the counties of Yunnan Province, China (black symbols represent the location of meteorological stations).
In this paper, we take Huize County and Mengzi County in Yunnan Province as examples to demonstrate the three-dimensional (3D) Copula model for the assessment of drought risk on agriculture.
Data
The data used in this study on damages caused by droughts come from China's Meteorological Disaster Loss Databases at County Level (1984–2012, including county name, geographic location, category of meteorological disasters, starting and ending time of meteorological disaster, number of affected populations, affected farmland areas, and direct economic losses) compiled by the China Meteorological Administration (CMA). Currently, the database is stored in the National Climate Center, and applied to the scientific research [51] and operational works (http://10.28.107.46:8084/MDMIS_oneMap/) of meteorological disaster risk management. The data on the affected farmland areas caused by drought was obtained between 1986 and 2012; of these, there are 20 records in Huize County and 21 records in Mengzi County. The two counties did not experience drought in 1984 and 1985.
It is known that agricultural yields vary continuously with the hydro-climatic conditions; it is also influenced by many other factors such as field management and specific varieties of crops. In addition, the direct economic loss of agriculture caused by droughts is also related to the current price of crops, and the factors affecting prices are so complex that they far exceed the drought itself. Therefore, in this study, we used the data of affected farmland areas caused by droughts because they have an intuitive cut-off between “drought” and ‘‘non-drought” conditions.
The exposure of crops to drought will also change with changes in the agricultural planting areas. Even if a drought occurs with the same duration and intensity, the larger the agricultural planting area, the larger affected the farmland area is. This makes it difficult to compare and analyze the impact of droughts when the data on the affected farmland areas in different years are used directly. Thus, the PAFA in each year was used for analysis in this study. In order to cooperate with the data on the affected farmland areas, we also need the continuous data of annual agricultural planting areas to calculate the PAFA. The data on the annual agricultural planting areas were taken between 1986 and 2012 (Figure 2) in Huize and from 1995 to 2012 in Mengzi. These data were obtained from the yearbook of Huize and Mengzi. Because of the establishment of the marginal distribution functions of duration and intensity of drought, it is necessary to use a time series of drought index. The monthly SPI [52] was calculated after processing daily precipitation data into monthly data. It should be noted that the Gamma distribution is used as the distribution function of precipitation in the calculation of SPI. The Kolmogorov-Smirnov distribution test results show that all stations in Figure 1 have passed the distribution test. In order to obtain more accurate and stable marginal distribution functions of drought duration and drought intensity, the daily precipitation data without missing values from 1961 to 2012 from Huize County and Mengzi County were acquired from the National Meteorological Information Center of the China Meteorological Administration (http://www.nmic.cn).
Methods
Description of Drought Characteristics
We described drought events based on the two major characteristics: drought duration and severity, which were both extracted from monthly SPIs. The most applied index is the SPI that concerns meteorological drought. As a powerful index, the SPI has been widely used to analyze droughts in different parts of the world, and the advantage of the SPI over other indices is that the SPI depends only on precipitation, the flexibility of timescales at which this index can be calculated, as well as being comparable in time and space. The SPI obtained based on the precipitation of 1 month is called a monthly scale index, the SPI obtained based on the precipitation of 3 months is called a seasonal scale index, and the SPI obtained based on the precipitation of 6 months is called an semi-annual scale index. SPI for 1 month is suitable for describing meteorological drought, SPI for 3 months is suitable for describing agricultural drought, and SPI for more than 6 months is suitable for describing drought in watersheds or groundwater. Since the SPI can characterize short- and long-term droughts, various research on drought risk assessment has been carried out using the SPI, and the results show that the SPI is ideal for performing a risk assessment in comparison to other drought indices [53–56]. Recently, a piece of research applied six drought indices to estimate the drought onset, and the results showed that meteorological drought indices predict the onset of a drought earlier than hydrological and agricultural drought indices [57]. Therefore, in this paper, we use the SPI to allow the method to be more practical in terms of risk warnings of droughts.
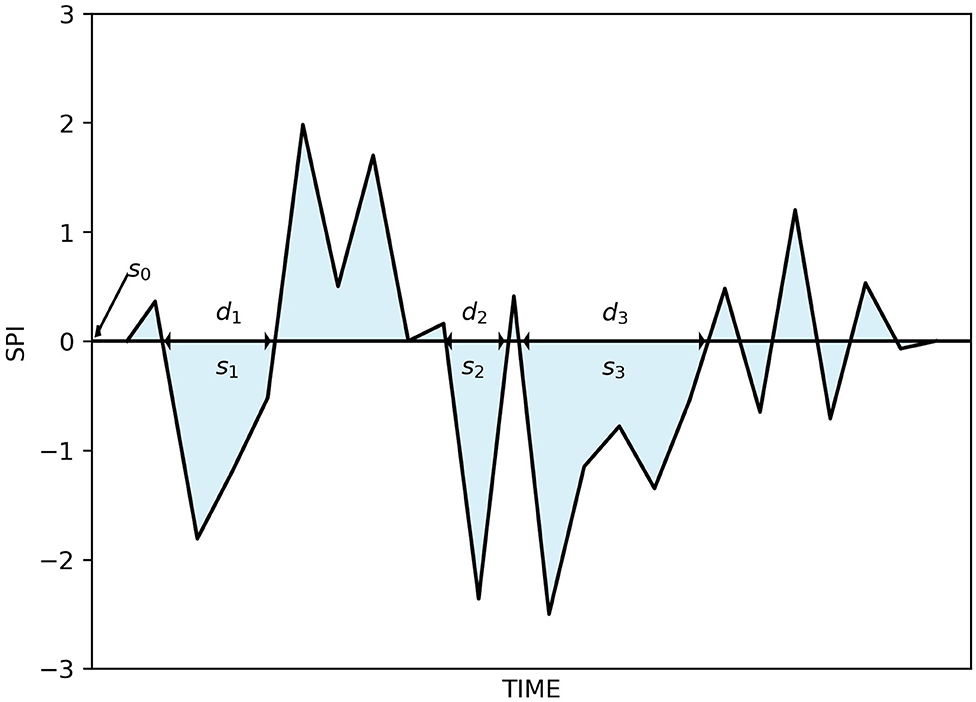
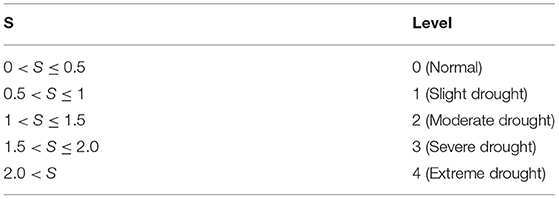
For an SPI time series, the definitions of drought duration and drought intensity that are adopted in the run theory [58] are shown in Figure 3. Run theory is a method of time series analysis, which is widely used in the identification of drought events [44, 59–61]. Drought duration (d) represents the number of months during which the SPI index is continuously below the threshold value (s0 = 0). Because the SPI of the monthly scale is used in this paper, the drought duration lasts for at least 1 month, and the range of the d value is within [1, +∞] month. Drought severity refers to the accumulation of the value of the SPI index within the ranges of the drought duration, and can be calculated by using the formula , and the range of the s value is within (0, +∞). Thus, the duration (d1,d2,d3 ⋯ ) and severity (s1,s2,s3 ⋯ ) of drought events can be extracted from an SPI time series [62, 63]. Based on previous studies, the classification of drought duration and severity was defined, and is shown in Tables 1, 2.
The Distribution Characteristics of Three Variables
The proportion of affected farmland area (PAFA) in each year was used for analysis. The mathematical expression is:
where I refers to PAFA, Ad is the affected farmland area, and AP is the annual agricultural planting area. An exponential function is applied to describe the distribution of the index I, and the mathematical expression is defined as:
Some studies [62, 64] have reported that drought duration and severity follow exponential and Gamma distributions, respectively. The mathematical expressions of the two distributions are:
where D and S refer to the sample set of drought duration and severity, respectively, d and s denote the element in the sample set of drought duration and severity, respectively, FD(d) refers to the probability that drought duration d is equal to or less than D, FS(s) denotes the probability that drought severity s is equal to or less than S, and λ, α, and β are the distribution parameters.
According to Equations (2–4), the Copula function was used to establish the joint distribution function of the three variables (the duration and intensity of the drought, as well as the PAFA caused by drought) in this study.
Copula Function
The Copula function is an effective method that uses the marginal distribution functions of different random variables to build a joint distribution function. As each marginal distribution of the variables is known, the joint distribution can be constructed with the Copula function. According to the theory of Sklar [39], the joint distribution function F(x1, x2, ⋯ , xn) can be decomposed into marginal distribution functions F(x1), F(x2), ⋯ , F(xn) and a Copula function C(·). The mathematical expression is:
The Copula function can be classified into three classes: the elliptic type, Archimedean family, and quadric form. The Archimedean Copula function has been widely used [62, 64], and therefore, it has also been used in our study. The common 3D Archimedean Copulas functions [40, 65] are as follows.
Clayton
Frank
Gumbel-Hougaard
Where, μ, v, ω are the marginal distribution functions, and θ is the parameter of the Copula function.
In this study, the parameter θ is estimated through the maximum log-likelihood estimation. The function can be written as follows:
where μ, v, ω are marginal distributions, and c(μ, v, ω, θ) is defined as . The log-likelihood function ln L can be maximized in order to obtain the estimation of Copula parameter . Furthermore, the root-mean-square error method [66, 67] was used to select the optimal Copula function:
where Pei is the empirical probability value obtained directly from the sample size, and Pi is the theoretical probability value under different Copula functions.
We compared and analyzed three Archimedes Copula functions, suggesting that the difference between the three Copula functions is not significant. However, the Gumbel-Hougaard function has an upper tail dependency, which is more suitable for the analysis of the dependence among three variables (the duration and intensity of a drought, as well as the PAFA caused by a drought). Thus, our subsequent analyses were all based on the Gumbel-Hougaard type Copula function.
Joint Distribution
In recent years, some researchers have begun to use three-dimensional Copula functions in their research [68, 69]. The joint distribution function can be obtained from the marginal distribution functions FD(d), FS(s), and FI(i), as well as the Copula function of drought duration, severity, and PAFA.
The joint distribution describes the probability that the drought duration, severity, and PAFA are all equal to or less than a given value of the drought event.
Analysis Process
The main analysis process in this paper is as follows: first, the Run theory was used to extract the drought events by using the SPI sequences in Huize County and Mengzi County from 1961 to 2011. Then, the marginal distribution functions and their parameters were obtained using the data on drought durations and drought intensities, respectively. After that, we calculated the PAFA, and the marginal distribution functions and their parameters of PAFA were obtained by using the data from Huize County from 1986 to 2011 and Mengzi County from 1995 to 2011. Finally, by using the data on drought durations, drought intensities, and the PAFA of Huize County from 1986 to 2011 and Mengzi County from 1995 to 2011, the 3D joint distribution functions and the parameters of the two counties were obtained, respectively, based on a maximum likelihood estimation. The data on drought durations, drought intensities, and the PAFA for 2012 would be used to verify the evaluation of the model.
Results and Discussion
The Establishment and Analysis of the 3D Joint Probability Distribution
The SPI sequences of the Huize and Mengzi counties were applied to extract drought events during the period between 1961 and 2011. Statistical characteristics were obtained and shown in Table 3, with s0 = 0 set as the threshold.
The number of drought events extracted from the SPI sequence were 161 (Huize County) and 153 (Mengzi County) from 1961 to 2011. The statistical indicators of drought duration and severity in Mengzi County were slightly larger than in Huize County. The average drought duration of both counties was close to 2 months, and the average drought severity of both counties reached the level of severe drought. The longest drought duration in Mengzi County was 12 months, and its cumulative drought severity reached the maximum recorded value (12.12) in history. The Pearson correlation coefficient of drought duration and drought severity indicated that there was a strong correlation between the two variables in the two counties, showing that the duration and severity of the droughts in the two counties were both strongly synchronized (Table 3). Moreover, each pairwise relationship among drought duration, drought severity, and PAFA is measured using Kendall's tau coefficient (Table 4), the results indicating that there exists a positive interrelated relationship between any two of these three variables in the two counties because the values of Kendall's tau are all > 0.
Figure 4 shows the scatter diagrams and statistical histograms of the drought duration and severity in the two counties, respectively. The distribution characteristics of drought duration and severity in the two counties were basically consistent (Figure 4). In most cases, the drought durations were all under 2 months and the drought severities were lower than the level of a severe drought in the two counties.
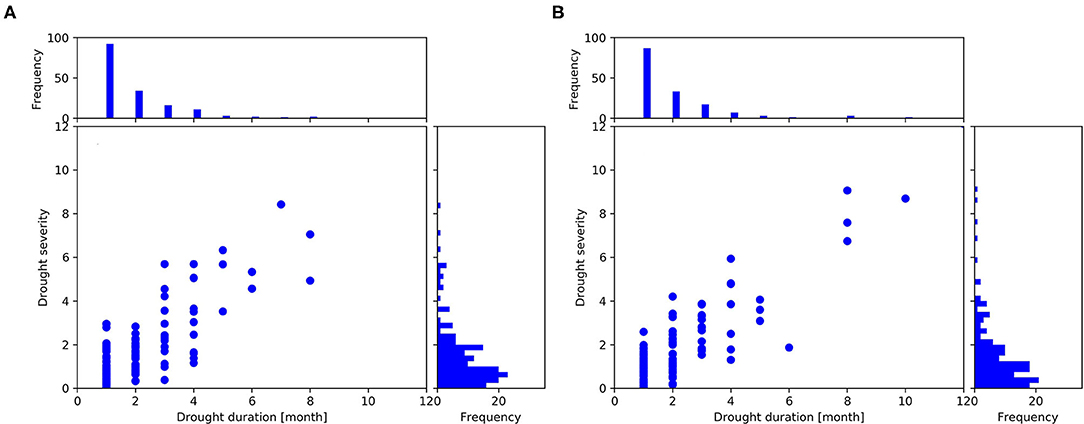
Figure 4. The scatter diagrams and the frequency diagrams of the drought duration and severity in (A) Huize County and (B) Mengzi County.
In order to confirm that the distributions of the drought durations of the two counties satisfy the exponential distribution, drought severities of the two counties satisfy the gamma distribution, as well as having the distributions of the PAFA of the two counties satisfy the exponential distribution, the Kolmogorov-Smirnov (KS) test was used to analyze the difference between the empirical distribution function and the theoretical distribution function at the 0.05 significance level. The results according to the KS test are shown in Table 5. Table 5 shows that the results had passed the statistical test and were reliable; namely, the distributions of the drought durations of the two counties were subject to exponential distribution, the distributions of the drought severities of the two counties were subject to gamma distribution, and PAFA of the two counties were subject to exponential distribution.
In this study, Copulas are employed to construct the joint distribution function. A three-variable joint distribution function was obtained by using Equations (1–11), and the probability distributions of PAFA were then calculated based on different drought durations and severities. Figure 5 shows the three-variable joint probability distribution of different PAFAs in Huize County, and the distribution characteristics were similar in Mengzi County.
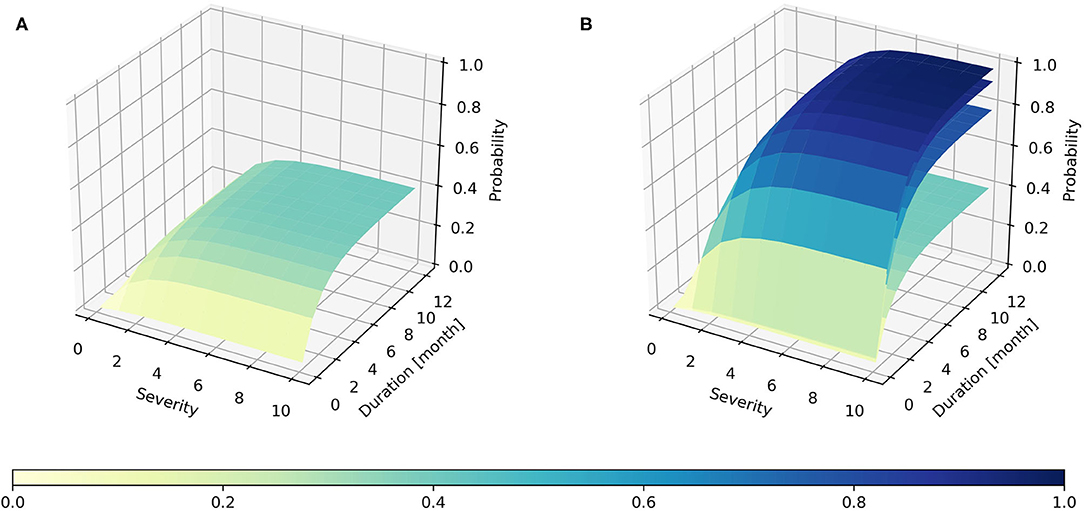
Figure 5. The 3D joint probability distribution (A) when PAFA is 10%, and (B) when PAFA is 10, 30, 50, and 80% in Huize County.
The Z coordinate in Figure 5 represents the probability when the random variables are less than given values. Taking Figure 5A as an example, the meaning of the curved surface in the figure is the probability P(D ≤ d, S ≤ s, PAFA ≤ 10%). The meaning in Figure 5B is the same as Figure 5A, except that the PAFA is less than a different value. As shown in Figure 5A, with regard to all drought events, 40% of the drought events caused PAFAs of no more than 10%; in other words, the farmland areas affected by 40% of the drought events did not exceed 10% of the planted areas. In addition, 80% of the drought events caused PAFAs of no more than 30%, meaning that the drought events, which caused PAFA to exceed 30% occurred rarely in history (Figure 5B). Then, the 3D joint probability distribution and the statistical relationships between the PAFA, the drought duration, and the drought severity could be obtained.
In this paper, more attention was actually paid to the practical application of the 3D joint probability distribution rather than the statistical relationships between the PAFA, the drought duration, and the drought severity, so we propose a classification scheme. By combining the classification method of drought duration and severity (Tables 1, 2) with the classification standard of PAFA (Table 6) (National Standard of the People's Republic of China: Grade of drought disaster GB/T 34306-2017), the probability distribution of various combinations of different drought durations, severities, and PAFAs could be determined, as shown in Figure 6.
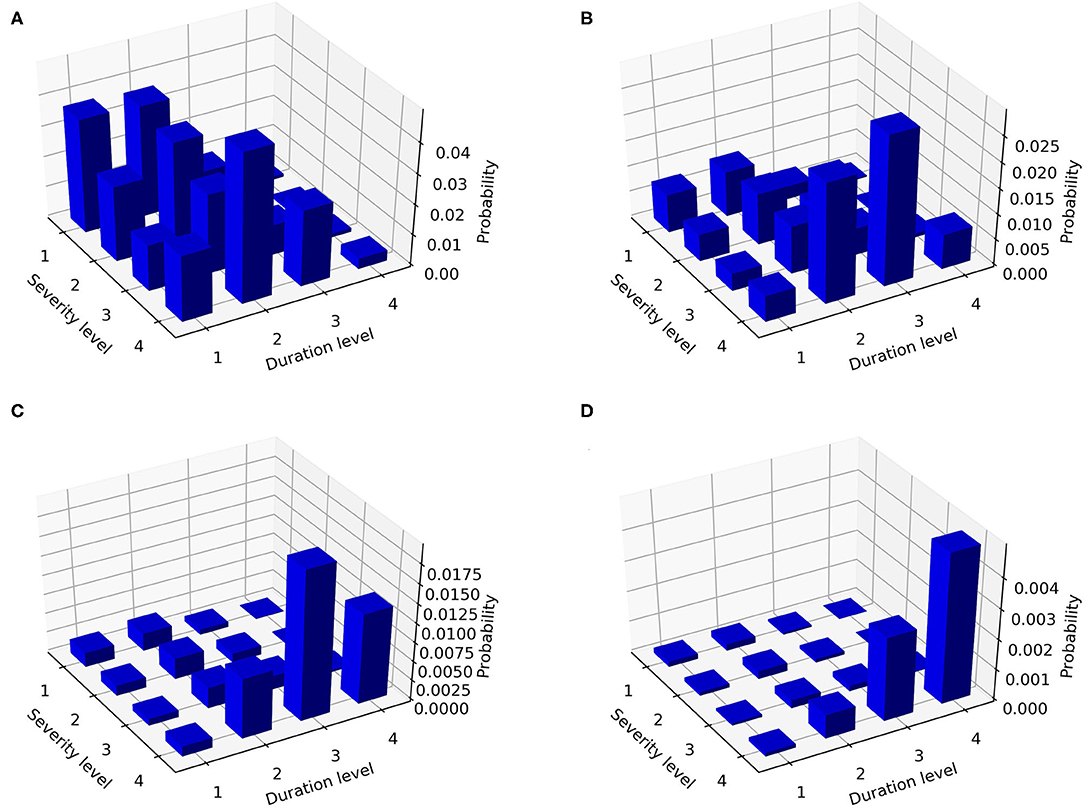
Figure 6. The joint probability distribution characteristics of Huize County corresponding to the level (A) 2, (B) 3, (C) 4, and (D) 5 of PAFA in Table 6.
Figure 6 shows the joint probability distributions of Huize County that drought duration and drought severity are within a given interval. Figure 6A shows the occurrence probability (P(d1 < D ≤ d2, s1 < S ≤ s2, 10% < PAFA ≤ 30%)) of drought events with different durations and severities when the PAFA is at the level of 2. The durations of drought events with a high probability of occurrence are at levels 1 (0 < D ≤ 1 within 1 month) and 2 (1 < D ≤ 3 within one season); that is, the durations do not exceed one season. If the drought duration is in level 1 (0 < D ≤ 1 within 1 month), the severity of the most likely drought events is in level 1 (0.5 < S ≤ 1 slight drought), but the severity of the most likely drought events is in level 4 (2.0 < S extreme drought) while the drought duration is in level 2 (1 < D ≤ 3 within one season). The probability of drought events with other durations and severities is very small. Similarly, Figures 6B–D gives the occurrence probability of drought events with different durations and severities when the PAFA is at three other levels. When the PAFA is at level 3 (30% < I ≤ 50%) (Figure 6B), the durations of drought events with a high probability of occurrence are at levels 2 (1 < D ≤ 3 within one season) and 3 (3 < D ≤ 6 cross-quarter), as well as severity level 4 (2.0 < S extreme drought); when the PAFA is at level 4 (50% < I ≤ 80%) (Figure 6C), the durations of drought events with a high probability of occurrence are at levels 3 (3 < D ≤ 6 cross-quarter) and 4 (6 < D over 6 months), as well as severity level 4 (2.0 < S extreme drought). The conclusion of Figure 6D is similar to Figure 6C but for the PAFA being at level 5 (80% < I). As the PAFA increases, the joint probability of drought duration and severity also increases with the increase in their levels.
The Application of the 3D Joint Probability Distribution
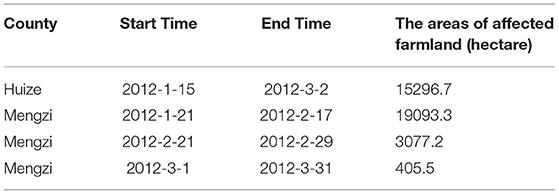
Figure 7 shows the SPI index sequences in Huize and Mengzi counties in 2012. According to Figure 7, Huize (Figure 7A) and Mengzi (Figure 7B) counties experienced several drought events during this period, especially between January and March 2012. Huize County experienced a drought event with a duration of 2 months and a severity of 1.9 from January 2012 to February 2012. Similarly, Mengzi County experienced a drought event with a duration of 5 months and a severity of 3.09 from February 2012 to June 2012. Furthermore, the disaster data indicated that drought disasters occurred in Huize and Mengzi counties from January to April in 2012. Table 7 shows the disaster data during this period.
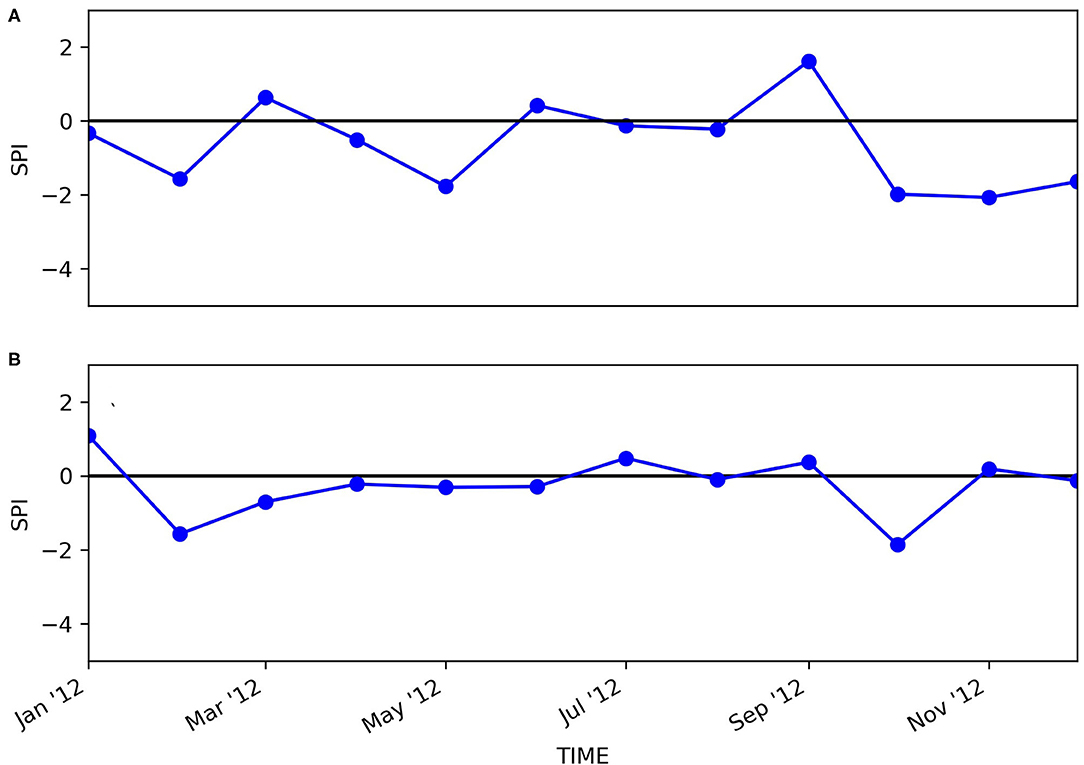
Figure 7. The SPI sequences of (A) Huize County and (B) Mengzi County from January to December 2012.
There was one piece of recorded disaster drought data in Huize County in 2012 (during the period between January and March); at the same time, there were three records in Mengzi County in 2012 (Table 7). By comparison, it was found that the start and end times of the drought disasters given by the recorded disaster data were basically consistent with the calculation results of the SPI index sequences in the two counties. The calculation result of the SPI index shows that the drought event in Huize County lasted for 2 months from January to February 2012 and the severity was 1.90, and the drought event in Mengzi County lasted for 5 months from February to June 2012 and the severity was 3.09, although the drought intensity in April-June was weak. The levels of drought duration and severity in Huize County were 2 (1 < D ≤ 3 within one season) and 3 (1.5 < S ≤ 2 Moderate drought), respectively, while the levels of drought duration and severity in Mengzi County were 3 (3 < D ≤ 6 cross-quarter) and 4 (2 < S Extreme drought), respectively. Equation (8) was used to estimate the occurrence probability of PAFAs that correspond to the two drought events in the two counties in 2012, respectively, and the results are shown in Table 8.
Table 8 shows that in Huize County, the highest probability of an occurrence of a PAFA was 10% < I ≤ 30%; that is, the maximum risk corresponded to a PAFA of 10%; and in Mengzi County, the highest probability of an occurrence of PAFA was 30% < I ≤ 50%; i.e., the maximum risk corresponded to a PAFA of 30% < I ≤ 50%. In a practical situation, the actual PAFA in Huize County was 14.3%, and in Mengzi County it was 50.3%. The PAFA results obtained by the method proposed in this paper were consistent with the actual PAFAs in the two counties, the PAFA of Huize County was evaluated well, and the PAFA of Mengzi County was slightly underestimated.
On the one hand, the underestimation of Mengzi County can be understood from a statistical point of view because we gave the occurrence probabilities of different levels of PAFA in a certain drought event, and while the probability is precisely an expression of risk, and on the other hand, the drought index used in this study (i.e., the SPI) is a meteorological drought index rather than a direct indicator of agricultural drought. Therefore, there is still a certain difference between the duration/severity of a drought obtained through the SPI index and the actual agricultural drought. However, a meteorological drought always occurs before an agricultural drought, so a meteorological drought index could be used to forecast and forewarn farmers of an agricultural drought and its effects in advance. In practical applications, compared with simple drought monitoring indicators, we can get SPI predictions for the following month or months based on monthly or seasonal precipitation forecasts, and can further obtain more abundant information about a drought warning and its impact through the method proposed in this paper so that relevant countermeasures can be taken according to the probability of occurrence of different levels of PAFA in order to achieve the purpose of disaster prevention, mitigation, and relief.
Conclusions and Discussions
Copula-based distribution has been used by researchers from different countries around the world in multivariate analyses of hydrological or meteorological events such as droughts due to its advantages in modeling the non-linear dependence structure of variables regardless of their marginal distributions. However, the applications of the Copula technique in assessing the impacts of a drought on agricultural production are very limited in published literature, and the damage data are often not used as a variable to be substituted into the Copula function, but are instead used as an independent variable in combination with the comprehensive features of a drought obtained by the Copula function. This assessment is actually based on an “external combination” of drought characteristics and drought impacts.
In order to achieve the “internal combination” of drought characteristics and drought impacts, as well as assessing the specific impacts of droughts with different severities and durations, we used three variables of drought events and their impacts; namely, the drought duration, drought intensity, and the proportion of affected farmland areas (PAFA), and built a model based on the three-dimensional (3D) Copula function for the assessment of the PAFA for the purpose of quantified drought risk analysis. The result of the model can provide occurrence probabilities for different levels of PAFA in a certain drought event, and while probability is precisely an expression of risk, we took Huize County and Mengzi County in Yunnan Province as application examples, and the results showed that the PAFAs obtained by the method proposed in this paper were both consistent with the actual PAFAs in the two counties.
Based on this model, the loss size and uncertainty (probability) under a given drought intensity can be well-expressed, which is the expected result of risk analysis. What's more, according to the division of drought grade, what kind of loss and its probability caused by a certain type of drought event can be clearly given. Moreover, in order to take risk control and mitigation measures, it is necessary to assess the impacts of a drought on agricultural production based on current drought conditions, and, more importantly, based on the forecast and predicted drought conditions in the future. A meteorological drought always occurs before an agricultural drought. In practical applications, we can obtain SPI predictions for the following month or months and can obtain further abundant information on drought warnings and their impact according to the probability of occurrence of different levels of PAFA. Therefore, the method proposed in this paper has values both on theory and practice.
Data Availability Statement
The original contributions presented in the study are included in the article/supplementary material, further inquiries can be directed to the corresponding author/s.
Author Contributions
WH, DZ, and PY: methodology. WH and DZ: writing original draft preparation. GF and WH: writing review and editing. DZ and PY: visualization. All authors contributed to the article and approved the submitted version.
Funding
This work was funded by National key research and development program of China (Grant no. 2017YFC1502402), National Natural Science Foundation of China (Grant No. 41775078), Natural science research project of higher education in Jiangsu provinces (Grant No. 20KJB170004), and School-level research projects of Yancheng Institute of Technology (Grant No. xjr2019052).
Conflict of Interest
The authors declare that the research was conducted in the absence of any commercial or financial relationships that could be construed as a potential conflict of interest.
References
1. Wilhite DA, Glantz MH. Understanding: the drought phenomenon: the role of definitions. Water Int. (1985) 10:111–20. doi: 10.1080/02508068508686328
2. Wilhite DA, Svoboda MD, Hayes MJ. Understanding the complex impacts of drought: a key to enhancing drought mitigation and preparedness. Water Resour Manag. (2007) 21:763–74. doi: 10.1007/s11269-006-9076-5
3. Quiring SM. Developing objective operational definitions for monitoring drought. J Appl Meteorol Climatol. (2009) 48:1217–29. doi: 10.1175/2009JAMC2088.1
4. Mishra AK, Singh VP. A review of drought concepts. J Hydrol. (2010) 391:202–16. doi: 10.1016/j.jhydrol.2010.07.012
5. Al-Qinna MI, Hammouri NA, Obeidat MM, Ahmad FY. Drought analysis in Jordan under current and future climates. Clim Change. (2011) 106:421–40. doi: 10.1007/s10584-010-9954-y
6. Schwalm CR, Anderegg WRL, Michalak AM, Fisher JB, Biondi F, Koch G, et al. Global patterns of drought recovery. Nature. (2017) 548:202–5. doi: 10.1038/nature23021
7. Sun GQ, Wang SF, Li MT, Li L, Feng GL. Transmission dynamics of COVID-19 in Wuhan, China: effects of lockdown and medical resources. Nonlinear Dyn. (2020) 101:1981–93. doi: 10.1007/s11071-020-05770-9
8. Sun GQ, Zhang HT, Wang JS, Li J, Wang Y, Li L, et al. Mathematical modeling and mechanisms of pattern formation in ecological systems: a review. Nonlinear Dyn. (2021). doi: 10.1007/s11071-021-06314-5. [Epub ahead of print].
9. Van Loon AF, Gleeson T, Clark J, Dijk AIJMV, Stahl K, Hannaford J, et al. Drought in the anthropocene. Nat Geosci. (2016) 9:89–91. doi: 10.1038/ngeo2646
11. Aghakouchak A, Feldman D, Hoerling M, Huxman T, Lund J. Recognize anthropogenic drought. Nature. (2015) 524:409–11. doi: 10.1038/524409a
12. Wang XJ, Shahid S, Elmahdi A, He RM, Bao ZX, Ali M. Water resources management strategy for adaptation to droughts in China. Mitig Adapt Strateg Glob Change. (2012) 17:923–37. doi: 10.1007/s11027-011-9352-4
13. Yu M, Li Q, Hayes MJ, Svoboda MD, Heim RR. Are droughts becoming more frequent or severe in China based on the Standardized Precipitation Evapotranspiration Index: 1951–2010? Int J Climatol. (2014) 34:545–58. doi: 10.1002/joc.3701
14. Wang X, Hou X, Li Z, Wang Y. Spatial and temporal characteristics of meteorological drought in Shandong Province, China, from 1961 to 2008. Adv Meteorol. (2014) 2014:1–11. doi: 10.1155/2014/685971
15. Trinh T, Ishida K, Kavvas ML, Ercan A, Carr K. Assessment of 21st century drought conditions at Shasta Dam based on dynamically projected water supply conditions by a regional climate model coupled with a physically-based hydrology model. Sci Total Environ. (2017) 586:197–205. doi: 10.1016/j.scitotenv.2017.01.202
16. Ahmed K, Shahid S, Nawaz N. Impacts of climate variability and change on seasonal drought characteristics of Pakistan. Atmos Res. (2018) 214:364–74. doi: 10.1016/j.atmosres.2018.08.020
17. Hao Z, Singh VP, Hao F. Compound extremes in hydroclimatology: a review. Water. (2018) 10:718. doi: 10.3390/w10060718
18. Lloret F, Kitzberger T. Historical and event-based bioclimatic suitability predicts regional forest vulnerability to compound effects of severe drought and bark beetle infestation. Glob Change Biol. (2018) 24:39. doi: 10.1111/gcb.14039
19. Royer PD, Villegas JC. Extreme climatic event-triggered overstorey vegetation loss increases understorey solar input regionally: primary and secondary ecological implications. J Ecol. (2011) 99:714–23. doi: 10.1111/j.1365-2745.2011.01804.x
20. Hui-Mean F, Yusop Z, Yusof FJAR. Drought analysis and water resource availability using standardised precipitation evapotranspiration index. Atmosp Res. (2018) 201:102–15. doi: 10.1016/j.atmosres.2017.10.014
21. Li B, Sherman DJ. Aerodynamics and morphodynamics of sand fences: a review. Aeolian Res. (2015) 17:33–48. doi: 10.1016/j.aeolia.2014.11.005
22. Lima IA, Parteli EJR, Shao Y, Andrade JS, Araújo AD. CFD simulation of the wind field over a terrain with sand fences: critical spacing for the wind shear velocity. Aeolian Res. (2020) 43:100574. doi: 10.1016/j.aeolia.2020.100574
23. Li YP, Wei Y, Meng W, Yan XD. Climate change and drought: a risk assessment of crop-yield impacts. Clim Res. (2009) 39:31–46. doi: 10.3354/cr00797
24. Ferrise R, Moriondo M, Bindi M. Probabilistic assessments of climate change impacts on durum wheat in the Mediterranean region. Nat Hazards Earth Syst Sci. (2011) 11:1293–302. doi: 10.5194/nhess-11-1293-2011
25. Capa-Morocho M, Ines AVM, Baethgen WE, Rodríguez-Fonseca B, Han E, Ruiz-Ramos M. Crop yield outlooks in the Iberian Peninsula: connecting seasonal climate forecasts with crop simulation models. Agric Syst. (2016) 149:75–87. doi: 10.1016/j.agsy.2016.08.008
26. Madadgar S, Aghakouchak A, Farahmand A, Davis SJ. Probabilistic estimates of drought impacts on agricultural production: Drought impacts on agricultural. Geophys Res Lett. (2017) 44:7799–807. doi: 10.1002/2017GL073606
27. Willner SN, Otto C, Levermann A. Global economic response to river floods. Nat Clim Change. (2018) 8:594–8. doi: 10.1038/s41558-018-0173-2
28. Volpi E. On return period and probability of failure in hydrology. Wiley Interdiscip Rev Water. (2019) 6:1–13. doi: 10.1002/wat2.1340
29. Freire-González J, Christopher AD, Jim WH. A scenario-based framework for assessing the economic impacts of potential droughts. Water Econ Policy. (2017) 3:1–27. doi: 10.1142/S2382624X17500072
30. Hall JW, Leng G. Can we calculate drought risk and do we need to? Wiley Interdiscip Rev Water. (2019) 6:e1349. doi: 10.1002/wat2.1349
31. Hagenlocher M, Castro MC. Mapping malaria risk and vulnerability in the United Republic of Tanzania: a spatial explicit model. Popul Health Metr. (2015) 13:2. doi: 10.1186/s12963-015-0036-2
32. Sun Z, Zhang JQ, Yan DH, Lan W, Guo E. The impact of irrigation water supply rate on agricultural drought disaster risk: a case about maize based on EPIC in Baicheng City, China. Nat Hazards. (2015) 78:23–40. doi: 10.1007/s11069-015-1695-9
33. Welle T, Birkmann J. The world risk index – an approach to assess risk and vulnerability on a global scale. J Extreme Events. (2015) 2:34. doi: 10.1142/S2345737615500037
34. Zhang Q, Sun P, Li J, Xiao M, Singh VP. Assessment of drought vulnerability of the Tarim River basin, Xinjiang, China. Theor Appl Climatol. (2015) 121:337–47. doi: 10.1007/s00704-014-1234-8
35. Feizizadeh B, Kienberger S. Spatially explicit sensitivity and uncertainty analysis for multicriteria-based vulnerability assessment. J Environ Plann Manag. (2017) 60:1–23. doi: 10.1080/09640568.2016.1269643
36. García-León D, Contreras S, Hunink J. Comparison of meteorological and satellite-based drought indices as yield predictors of Spanish cereals. Agric Water Manag. (2019) 213:388–96. doi: 10.1016/j.agwat.2018.10.030
37. Siebert S, Webber H, Rezaei EE. Weather impacts on crop yields - searching for simple answers to a complex problem. Environ Res Lett. (2017) 12:081001. doi: 10.1088/1748-9326/aa7f15
38. Hagenlocher M, Meza I, Anderson C, Min A, Renaud F, Walz Y, et al. Drought vulnerability and risk assessments: state of the art, persistent gaps, and research agenda. Environ Res Lett. (2019) 14:083002. doi: 10.1088/1748-9326/ab225d
39. Sklar A. Fonctions de répartition à n dimensions et leurs marges publications de l'Institut de Statistique de l'Université de Paris. Sci Res. (1959) 8:229–31.
41. Okhrin O, Odening M, Wei X. Systemic weather risk and crop insurance: the case of China. J Risk Insur. (2013) 80:351–72. doi: 10.1111/j.1539-6975.2012.01476.x
42. Bokusheva R, Kogan F, Vitkovskaya I, Conradt S, Batyrbayeva M. Satellite-based vegetation health indices as a criteria for insuring against drought-related yield losses. Agric For Meteorol. (2016) 220:200–6. doi: 10.1016/j.agrformet.2015.12.066
43. Mehdikhani H, Saghafian B, Arasteh PD. A new damage-probability approach for risk analysis of rain-fed agricultural systems under meteorological drought. KSCE J Civil Eng. (2016) 21:1453–61. doi: 10.1007/s12205-016-0510-y
44. Guo E, Liu X, Zhang J, Wang Y, Wang C, Rui W, et al. Assessing spatiotemporal variation of drought and its impact on maize yield in Northeast China. J Hydrol. (2017) 553:231–47. doi: 10.1016/j.jhydrol.2017.07.060
45. Nguyen-Huy T, Deo RC, Mushtaq S, An-Vo DA, Khan S. Modeling the joint influence of multiple synoptic-scale, climate mode indices on Australian wheat yield using a vine copula-based approach. Eur J Agron. (2018) 98:65–81. doi: 10.1016/j.eja.2018.05.006
46. Nguyen-Huy T, Deo RC, Mushtaq S, Kath J, Khan S. Copula statistical models for analyzing stochastic dependencies of systemic drought risk and potential adaptation strategies. Stoch Environ Res Risk Assess. (2019) 33:779–99. doi: 10.1007/s00477-019-01662-6
47. Li Z, He Y, Wang P, Theakstone WH, An W, Wang X, et al. Changes of daily climate extremes in southwestern China during 1961–2008. Glob Planet Change. (2012) 80:255–72. doi: 10.1016/j.gloplacha.2011.06.008
48. Huang K, Tao Z, Xiang Z. Extreme drought-induced trend changes in MODIS EVI time series in Yunnan, China. IOP Conf Ser Earth Environ Sci. (2014) 17:012070. doi: 10.1088/1755-1315/17/1/012070
49. Long D, Shen Y, Sun A, Hong Y, Longuevergne L, Yang Y, et al. Drought and flood monitoring for a large karst plateau in Southwest China using extended GRACE data. Remote Sens Environ. (2014) 155:145–60. doi: 10.1016/j.rse.2014.08.006
50. Yan Z, Zhang Y, Zhou Z, Ning H. The spatio-temporal variability of droughts using the standardized precipitation index in Yunnan, China. Nat Hazards. (2017) 88:1–20. doi: 10.1007/s11069-017-2904-5
51. Wang Y, Wen S, Li X, Thomas F, Su B, Wang R, et al. Spatiotemporal distributions of influential tropical cyclones and associated economic losses in China in 1984–2015. Nat Hazards. (2016) 84:2009–30. doi: 10.1007/s11069-016-2531-6
52. McKee TB, Doesken NJ, Kleist J. The relationship of drought frequency and duration to time scales Preprints. In: 8th Conference on Applied Climatology. Anaheim (1993). p. 179–84.
53. Mishra AK, Desai VR. Drought forecasting using stochastic models. Stoch Environ Res Risk Assess. (2005) 19:326–39. doi: 10.1007/s00477-005-0238-4
54. Cancelliere A, Mauro GD, Bonaccorso B, Rossi G. Drought forecasting using the standardized precipitation index. Water Resour Manag. (2007) 21:801–19. doi: 10.1007/s11269-006-9062-y
55. Bordi I, Fraedrich K, Sutera A. Observed drought and wetness trends in Europe: an update. Hydrol Earth Syst Sci. (2009) 13:1519–30. doi: 10.5194/hess-13-1519-2009
56. Golian S, Mazdiyasni O, Aghakouchak A. Trends in meteorological and agricultural droughts in Iran. Theor Appl Climatol. (2015) 119:679–88. doi: 10.1007/s00704-014-1139-6
57. Bayissa Y, Maskey S, Tadesse T, Andel SJV, Moges S, Griensven AV, et al. Comparison of the performance of six drought indices in characterizing historical drought for the upper blue Nile Basin, Ethiopia. Geosciences. (2018) 8:81. doi: 10.3390/geosciences8030081
58. Herbst PH, Bredenkamp DB, Barker HMG. A technique for the evaluation of drought from rainfall data. J Hydrol. (1966) 4:264–72. doi: 10.1016/0022-1694(66)90084-9
59. Cancelliere A, Salas JD. Drought length properties for periodic-stochastic hydrologic data. Water Resour Res. (2004) 40:389–91. doi: 10.1029/2002WR001750
60. Chang J, Li Y, Wang Y, Meng Y. Copula-based drought risk assessment combined with an integrated index in the Wei River Basin, China. J Hydrol. (2016) 540:824–34. doi: 10.1016/j.jhydrol.2016.06.064
61. Wu L, Feng L, Li Y, Wang J, Wu L. A yield-related agricultural drought index reveals spatio-temporal characteristics of droughts in Southwestern China. Sustainability. (2019) 11:714. doi: 10.3390/su11030714
62. Shiau JT. Fitting drought duration and severity with two-dimensional copulas. Water Resour Manag. (2006) 20:795–815. doi: 10.1007/s11269-005-9008-9
63. Liu CL, Zhang Q, Singh VP, Cui Y. Copula-based evaluations of drought variations in Guangdong, South China. Nat Hazards. (2011) 59:1533–46. doi: 10.1007/s11069-011-9850-4
64. Serinaldi F, Bonaccorso B, Cancelliere A, Grimaldi S. Probabilistic characterization of drought properties through copulas. Phys Chem Earth A/B/C. (2009) 34:596–605. doi: 10.1016/j.pce.2008.09.004
65. Bezak N, Mikoš M, Šraj M. Trivariate frequency analyses of peak discharge, hydrograph volume and suspended sediment concentration data using copulas. Water Resour Manag. (2014) 28:2195–212. doi: 10.1007/s11269-014-0606-2
66. Willmott CJ, Ackleson SG, Davis RE, Feddema JJ, Klink KM, Legates DR, et al. Statistics for the evaluation and comparison of models. J Geophys Res Oceans. (1985) 90:8995–9005. doi: 10.1029/JC090iC05p08995
67. Jeong DI, Sushama L, Khaliq MN, Roy R. A copula-based multivariate analysis of Canadian RCM projected changes to flood characteristics for northeastern Canada. Clim Dyn. (2014) 42:2045–66. doi: 10.1007/s00382-013-1851-4
68. Song S, Singh VP. Frequency analysis of droughts using the Plackett copula and parameter estimation by genetic algorithm. Stoch Environ Res Risk Assess. (2010) 24:783–805. doi: 10.1007/s00477-010-0364-5
Keywords: drought, risk assessment, three-dimensional Copula function, Huize county, Mengzi County
Citation: Hou W, Yan P, Feng G and Zuo D (2021) A 3D Copula Method for the Impact and Risk Assessment of Drought Disaster and an Example Application. Front. Phys. 9:656253. doi: 10.3389/fphy.2021.656253
Received: 25 January 2021; Accepted: 10 March 2021;
Published: 01 April 2021.
Edited by:
Gui-Quan Sun, North University of China, ChinaReviewed by:
Qiang Zhang, Gansu Meteorological Bureau, ChinaEric Josef Ribeiro Parteli, University of Duisburg-Essen, Germany
Copyright © 2021 Hou, Yan, Feng and Zuo. This is an open-access article distributed under the terms of the Creative Commons Attribution License (CC BY). The use, distribution or reproduction in other forums is permitted, provided the original author(s) and the copyright owner(s) are credited and that the original publication in this journal is cited, in accordance with accepted academic practice. No use, distribution or reproduction is permitted which does not comply with these terms.
*Correspondence: Dongdong Zuo, ZG9uZ2R6X3Zvd0AxNjMuY29t
 Wei Hou
 Pengcheng Yan
 Guolin Feng
 Dongdong Zuo
