 F. Gael Segura-Fernández
 Erick F. Serrato-García
 J. Emmanuel Flores-Calderón
 Orlando Guzmán
- Departamento de Física, Universidad Autónoma Metropolitana Unidad Iztapalapa, Mexico City, Mexico
We study nonlinear dynamical equations for coupled conserved and non-conserved fields describing nanoparticle concentration and liquid crystal order parameter, respectively, and solve them numerically over bidimensional domains. These equations model the rapid segregation of nanoparticles away from nematic domains, which has been observed experimentally in a suspension of gold nanoparticles in 5CB below the isotropic-nematic transition temperature. We contrast the different behaviors obtained when the LC order parameter is treated as a scalar or a tensor, as well as the different rates of evolution observed with each of these. We find, after an instantaneous quench lowering the temperature below the transition one, an initial linear regime where the ordering of the nematic phase proceeds exponentially with time. Only after a lag period the nanoparticle material couples effectively to the LC order parameter and segregates to regions that are less orientationally ordered (extended domain walls for a scalar order parameter, but point disclinations for a tensor one). The lag period is followed by the onset of nonlinear dynamics and saturation of the order parameter. The choice of a scalar or tensor LC order parameter does not change this sequence but results in a clear overshooting of the nonlinear saturation level for the tensor order parameter case. These results are found to be insensitive to weak anchoring due to coupling of gradients of the conserved and non-conserved variables, for the nanoparticle concentrations and anchoring parameters studied. Our modeling approach can be extended in a straightforward manner to cases where the cooling rate is finite and to other systems where a locally conserved concentration is coupled to a orientation field, such as active Langmuir monolayers, and possibly to other examples of nonlinear dynamics in ecological or excitable media problems.
1. Introduction
Nonlinear dynamical systems generate intense research because they encompass a large class of phenomena displaying pattern formation, wave-like solutions and even oscillatory patterns of activity [1, 2]. When nonlinear dynamical systems take into account spatial dependencies, they often are modeled in a continuum fashion with partial differential equations. Among the diversity of such systems, the Newell-Whitehead equation (1) finds application diverse fields such as population growth and epidemics in ecology [3], pattern formation in cloud fields [4], mechanical and chemical engineering [5], and the dynamics of phase transitions [6]:
where f[u] is a known functional of the unknown u, Γ is a diffusion rate, b is a convection force and ϵ is the magnitude of the nonlinear response.
An example of the application of the Newell-Whitehead equation to soft matter systems occurs for the case of liquid crystals and their isotropic-nematic transition, where the appropriate choice of the functional f[u] leads to the well-known Allen-Cahn [7] or Model A equations [8]. Liquid crystals are a particularly convenient, table-top choice of materials to study the behavior of nonlinear dynamical systems: they are chemically stable at room temperature, highly susceptible to external influences (of thermal, electrical, or magnetic character), and have wide technological application [9].
When nanoparticles are suspended homogeneously in the isotropic phase of a mesogenic fluid, they can undergo rapid self-assembly of micron-sized nanoparticle structures if there is a transition to the nematic phase [10–12]. The hollow structures that can be obtained from such process have a range of sizes and morphologies (such as spheres, cylinders, and foams) that make them attractive for different areas of application [13–15], such as optoelectronics, encapsulation and controlled release, sensing, or catalytic frameworks, among others.
In order to understand this behavior, the Newell-Whitehead equation (corresponding to Model A [8]) must be consistently coupled to a conservation law for the concentration of nanoparticles. We have formerly introduced a thermodynamic model that accounts for the formation of the simplest NP aggregate morphology observed in experiments (micro-shells) as a first-order transition [16], where the excluded volume of the nanoparticles competes with the latent heat of the isotropic-nematic transition to give rise to shells with walls of a definite width for a given temperature quench and initial volume fraction of nanoparticles in the mixture. However, in the self-assembly methodology reported by [12], the final morphology is controlled by the cooling rate and initial concentration of nanoparticles. This indicates that a dynamic model of the system, as opposed to a purely thermodynamic description, is required to analyze it.
A first model addressing this requirement was presented in [12], which combined a Lebwhol-Lasher Monte Carlo simulation of the isotropic-nematic transition which was coupled in a linear fashion to a Cahn-Hilliard equation for the nanoparticle sorting. However, this coupling was one-directional: the nematization order parameter S acted as an external field driving the nanoparticle concentration, but there was no coupling back to the Lebwhol-Lasher simulation.
In this work, we reconsider that previous approach in the context of the dynamic equations of Model C for the time evolution of coupled conserved and non-conserved fields [8]. In our present approach, the nematic order parameter and the nanoparticle concentration follow dynamic equations that are mutually coupled, and therefore we reconsider the nature of the coupling free-energy term. We contrast the different behavior obtained when the liquid crystal is described solely by its (scalar) nematization order parameter S and when it is described with a more detailed alignment tensor Q. To begin with, the former situation does not allow for anchoring of the liquid crystal director, while the second one can. We characterize and contrast the types of structures obtained with the scalar and tensorial models, as well as the different rates of evolution observed with each of these. Further, we investigate the initial segregation process, driven by linear dynamics, and the later non-linear dynamics with numerical simulations.
We report new results quantifying the role of the nanoparticle mobility and the anchoring of the liquid crystal (with respect to nanoparticle concentration gradients present at the edges of the NP aggregates) regarding the impact that the NPs have on the LC dynamics and viceversa. Our results indicate that the tensorial model is characterized by a slower rate of evolution of the alignment tensor field but a faster evolution of the NP concentration field, in comparison to the results of the scalar model. Both display non-linear saturation of their initially exponential dynamics, although the tensorial model shows a clear overshooting with respect to its final saturation behavior.
With our new model, we are able to account for the mutual coupling between the nanoparticles and the mesogenic fluid. It also opens the way for including more realistic models for the NP free energy, beyond the quadratic term that corresponds to a truncation of the NP free energy at the level of its second-virial coefficient. In particular, including the effect of the NP excluded volume as well as the presence of attractive interactions is feasible through known models for the free energy of hard spheres and perturbation theories for Lennard-Jones, square-well and other types of attractive potentials. We also discuss how our results relate to other settings where Newell-Whitehead equations could be coupled to conserved fields, in cases like excitable media, population growth, and epidemics.
2. Methods
Our analysis relies on the formulation of Model C, by [8], for the dynamical equations of a conserved field coupled with a non-conserved field. For our purposes, the conserved field corresponds to the nanoparticle concentration, C(x′, t′). We denote space and time coordinates by x′ and t′, respectively, reserving unprimed symbols for non-dimensional coordinates to be introduced below in order to simplify the notation. The non-conserved field corresponds to the order parameter for the liquid crystal. We consider, first, the case where this parameter is taken simply as the scalar nematization,
where θ is the angle between the molecular axis of a mesogen and the nematic director, P2(x) is the second Legendre polynomial, and the angular brackets denote here a coarse-graining average over molecular orientations at the given coordinates. We also consider the case where the order parameter is the alignment tensor,
with u a unit vector in the direction of molecular orientation, I the identity tensor, and d = 2, 3 the dimensionality of u; the angular brackets also denote here a coarse-graining average over molecular orientations at point x′ and time t′.
Within the methodology of Hohenberg and Halperin [8], the dynamic equations are related to the functional derivatives of the system's free energy functional with respect to each of the dynamical fields, but they have different forms depending on the presence or absence of a conservation law for each dynamical variable. We show how to obtain such dynamical equation below.
For the case where the LC order parameter is taken just as the nematization S, we take as the system's free energy functional the following expression:
In the previous equation, ∇′ denotes differentiation with respect to the spatial coordinates , r = a(T − T*) is a control parameter that depends on the temperature T, the limit of thermal stability T* and a positive constant a, while K is an elastic constant, w and u are Landau-de Gennes expansion coefficients [9], Ω is a virial expansion coefficient for the NPs free energy and α is coupling parameter for the conserved and non-conserved fields. They are phenomenological constants with material-specific values. The first four terms in (4) correspond to a Landau-de Gennes expansion, the fifth term is a low-concentration approximation to the free energy of the nanoparticles (to the level of the second virial coefficient), with the last term providing the coupling between the fields.
The Landau-de Gennes expansion coefficients a, T*, w and u can be determined from microscopic information by simulation [17, 18] or by experimental information about the values of several quantities at the isotropic-nematic transition in the pure liquid crystal: the magnitude of the discontinuity of the nematization S, the temperature shift between the transition temperature, the limit of meta-stability T*, the phase-transition latent heat and the correlation length [19]. Elastic constants such as K can be calculated from microscopic information about the direct correlation function for the mesogens in a liquid crystal [20, 21], or by analysis of long-wavelength director fluctuations using molecular simulations [22, 23]. For the coupling between the conserved and non-conserved fields, we have chosen a term that is linear in C but is quadratic in S. This choice is similar to that used by Elder and coworkers for the study of binary mixtures [24] and results in a shift in the isotropic-nematic transition temperature, as can be recognized by defining a control parameter . Thus, the first effect of the coupling term is a shift in the isotropic-nematic transition temperature by an amount proportional to , when compared with that for the pure nematic with C = 0. From experimental information as well as molecular simulation modeling, we set α > 0 and therefore obtain a reduction in the transition temperature when nanoparticles are present. A second effect of the coupling term αCS2/2, when α is positive, is that the absolute minimum of its contribution to the free energy is zero and can be achieved when non-zero values of C occur at places where S = 0. In other, words, segregation of nanoparticles to locally isotropic regions is favored thermodynamically by this term.
For the case where the LC order parameter is the alignment tensor Q, the system's free energy functional is, analogously, taken as:
Again, the parameters in this expression are phenomenological and available from experiments [25, 26] and we consider α>0 for the coupling between the fields C and Q, since the isotropic-nematic transition temperature is observed to decrease as the concentration of nanoparticles is increased. When considering molecular orientation of mesogens confined to a plane, hence d = 2, the tensor order parameter can be parameterized as
and the trace of odd powers of Q is identically zero. In such situations, substitution of the previous parametrization into (5) shows that the remaining terms , u trQ4, and contribute to the free energy with , , , respectively. These differ from the corresponding terms in (4) only by a rescaling of the coefficients r, u, and α. Therefore, the coupling term also favors segregation of nanoparticles into locally isotropic regions.
In this work we present our results for the cases of systems described by the models in Equations (4) and (5) over bidimensional domains. To describe the dynamics after the isotropic-nematic phase transition, we assume in Model C that at time t′ = 0 the system suffers a sudden quench bringing the temperature below the transition value. We also assume that isothermal conditions throughout the whole sample remain aftwerwards: this allows us to work solely with the dynamical equations of Model C for the conserved and non-conserved fields. For the case where S is the sole order parameter of the LC, these equations are
where Γ and ΓC are phenomenological mobilities that here we consider constant. Substitution of the free energy functional defined in (4) into (7), followed by a change of variables to non-dimensional ones defined by
yields the following dynamical equations:
where sgn(x) is the sign function, while R and g are non-dimensional parameters:
We point out that, because our assumption of isothermal conditions, we can treat parameter r = a(T − T*) as constant and so our scaled dynamical equations become independent of r up to its sign; also, the actual nematization S is related to the non-dimensional variable s through a temperature-dependent transformation.
In summary, we notice that (9) contain a Newell-Whitehead equation for the non-conserved field and a diffusion equation for the conserved one that are mutually coupled. The coupling in the former equation amounts to a local shift (by c) in the control parameter sgn(r), while that in the latter amounts to an additional term driving NP diffusion away from high-nematization regions.
For the case where Q is the LC order parameter, it is necessary to project onto the set of traceless symmetric tensors, which results in the following expressions:
If one introduces a reduced alignment tensor as
the dynamical equations in this case reduce to
where the unprimed Laplacian operator denotes differentiation with respect to the non-dimensional spatial coordinates x. Again, (14) correspond to two coupled Newell-Whitehead equations, for the components of the q tensor and one diffusion equation for the NP concentration: the concentration shifts the coefficients of the linear terms for the non-conserved variables, while their mutual coupling is nonlinear, and the coupling of the non-conserved variables to the conserved field drives diffusion of NPs away from the nematically ordered regions.
While the scalar order parameter model expressed by (9) does not allow us to consider anchoring of the liquid crystal orientation with respect to the NP aggregate interfaces (that is, the requirement that the nematic director n orients in a particular direction with respect to an interface normal [9]), the tensorial model given by (14) can be augmented to account for anchoring by including a new term to the free energy density in (5) [27, 28]:
where Λ is an anchoring parameter. By coupling the gradients of the concentration C and gradients of the elements of the Q tensor, for Λ > 0 lower free energy configurations are obtained when the director is parallel to concentration gradients, hence hometropic at the interface of NP aggregates; if Λ < 0, then the preferred orientation of the director becomes perpendicular to concentration gradients and the anchoring becomes planar [28]. The corresponding dynamical equations obtained from Model C are:
where .
For the tensorial model, the nematization s and the orientation θ of the director n = (cosθ, sinθ) can be obtained from q using the parametrization
Comparison between the parametrization of Q given in (6) and (17), together with the scaling in (13) shows that , just as for the scalar model. From the dynamical Equations (9), or (14), (16) and (17), one can show that homogeneous and stationary states can be achieved if the initial NP concentration is uniform c(x, 0) = c0 and the order parameter is either zero s(x, 0) = 0 or given by if r < 0. This work is concerned with the former case since, experimentally, nanoparticles are initially suspended homogeneously in the isotropic phase of 5CB [12].
We solved numerically the dynamical equations, for the models with scalar and tensor LC order parameters (with and without anchoring in the latter case), with a finite difference method over a square grid of N = 128 equidistant points in each direction, with periodic boundary conditions. The spacing Δxi = 1 and the time step Δt = 0.01 were chosen together so that the forward Euler method would be stable [1]. In order to imitate the experimental conditions described by [12], we used as initial condition an isotropic state s(x, 0) = 0 with uniform nanoparticle concentration c(x, 0) = 0.01. We then added random perturbations to the dynamical variables drawn from a uniform distribution on the interval [−10−3, 10−3]. We ran 20 realizations of the dynamics for these randomized initial conditions for each simulated system.
Besides direct visualization of the evolution of the conserved and non-conserved fields, we analyzed the dynamics of the system in Fourier space by calculating the power spectra
where f(k, t) denotes the Fourier transform with respect to space of f(x, t) and f* is the complex conjugate of f. We also computed the correlation functions
where the angular brackets denote here an average over the whole domain for the spatial coordinates y followed by a further average over multiple independent realizations. In this respect, the power spectra and correlation functions were averaged over the 20 independent realizations corresponding to the same number of randomized initial conditions for a given system.
We computed the correlations length ξa, for a = s, c, from the correlation functions as
obtained by quadratic fitting of the logarithm of the correlation functions Cs and Cc with respect to the radial coordinate x = |x|. Complementary to this method, we also measured a correlation length La = 2π/ka from the wave number ka at which the power spectra Pa(k, t) reaches half of its maximum (which corresponds to the size of the circular patterns shown in Figure 3). While both estimates yield proportional values, we found that the second one tracks the increase in the correlation length more robustly. Hence, only the time evolution of the correlation lengths Ls and Lc is presented in the results.
3. Results
Our first results for the time evolution of the nanoparticle-mesogen mixture are shown in Figure 1 for the model with scalar order parameter. Our numerical simulations show that the nanoparticle concentration grows in time precisely at those regions where the order parameter is close to zero. These regions are domain walls between areas with nematization s of opposite signs. As the domains grow and the domain walls shrink and disappear, the NP concentration “stored” in the domain walls is released back into the domains interior, diffusing back to other nearby walls.
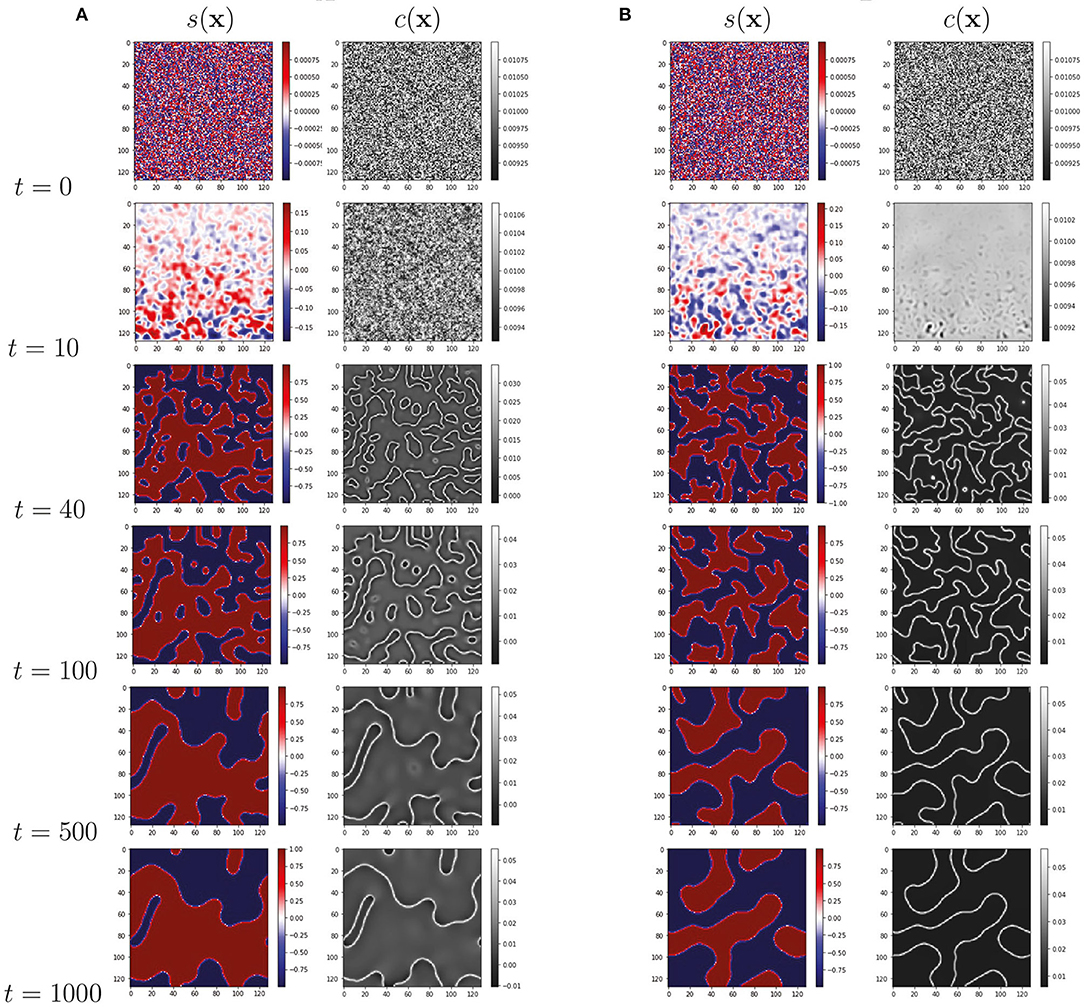
Figure 1. Time evolution of nematization s(x) and NP concentration c(x), from the scalar model (9): (A) for NP mobility R = 0.1 and (B) R = 10. NP material segregates to the domain walls where the nematization is diminished with respect to the interior of the nematic domains. This segregation is more pronounced for the more mobile case (B). Parameters g = 0.005, r = −1, c0 = 0.01 were fixed through both runs. In an homogeneous and steady nematic state but, once the NPs segregate, we expect that at long times s = ±1 deep inside the nematic regions.
Figure 1A displays the time evolution when the relative mobility parameter R = 0.1 corresponds to slow NP diffusion compared to LC relaxation, one can observe that c is higher at the domain walls but still noticeable at the domain interiors. On the other hand, Figure 1B shows the time evolution for R = 10, corresponding to fast NP diffusion compared to LC relaxation. In this latter case, c is much smaller at the domains' interior and most of the NP material gets confined to the domain walls.
Our results for the model with tensor order parameter and no anchoring (λ = 0) are shown in Figure 2 and Supplementary Figure 1. Again, the numerical simulations show that the NP concentration segregates toward topological defects where the tensor order parameter q is close to zero. Now, however, these topological defects are points where the director orientation θ changes abruptly. In this case, the NP “stored” at the defects are released back into the nematic phase when the point disclinations of opposite charge annihilate. The same qualitative behavior was obtained from numerical simulations with negative and positive values of the anchoring coefficient (λ= −0.4, −0.1, 0.1, and 0.4), corresponding to weak planar and homeotropic anchoring, respectively [28] (see Supplementary Figure 2). In this model the nanoparticle aggregates remain on the order of a few order parameter coherence lengths, and thus we observed no formation of NP aggregates large enough to trigger repulsion among them due to anchoring. However, non-zero values of λ do alter the shape of the NP aggregates: those with −1/2 topological charge acquire a clearly triangular shape, while those with +1/2 charge become slightly elongated (see Supplementary Figure 2).
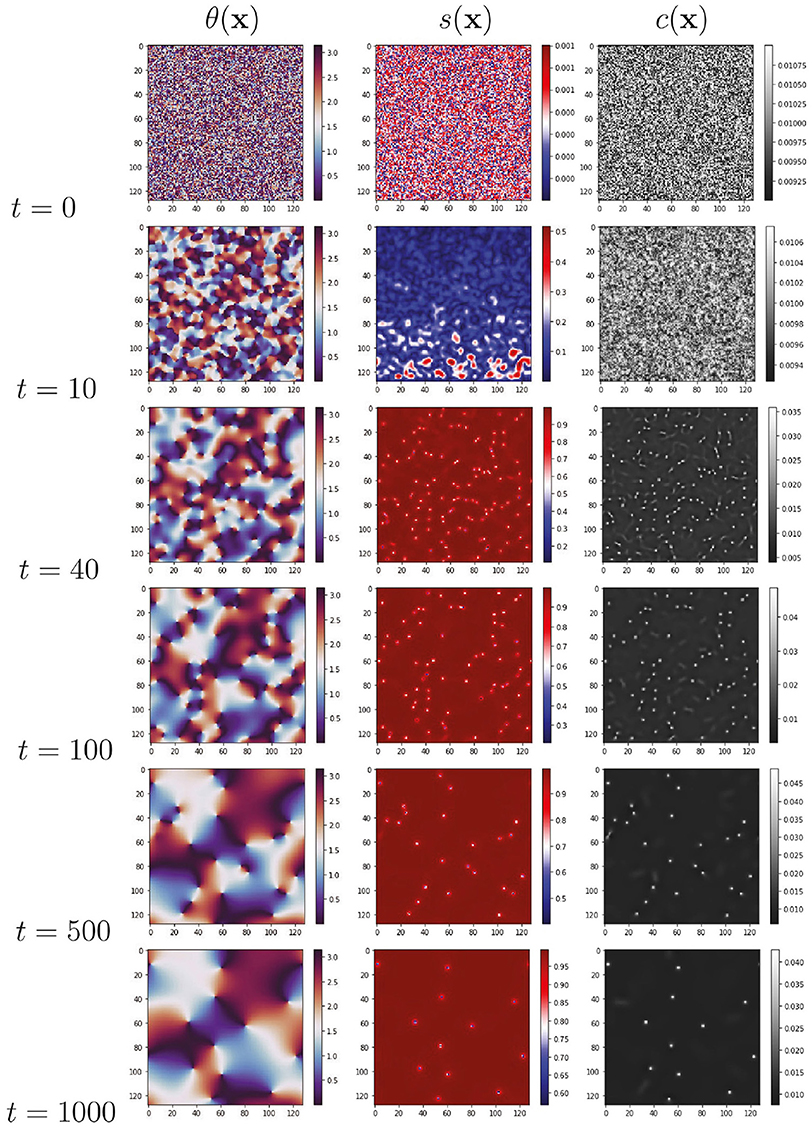
Figure 2. Time evolution of director orientation θ(x), nematization s(x) and NP concentration c(x) from the tensor dynamical Equations (14), for NP mobility parameter R = 0.1. As for the scalar dynamical equations, NP material aggregates at the low nematization regions, which correspond here to point disclinations. As the disclinations annihilate, NP material is released back into the nematic domains where it diffuses away. Parameters g = 0.005, r = −1, c0 = 0.01 were fixed through the run, so that the equilibrium values of in the nematic phase.
In order to quantify the characteristic length scales associated with the NP self-assembly at the topological defects in the nematic, we analyzed the power spectra for the conserved and non-conserved fields in our models, Ps(k, t) and Pc(k, t). Typical behavior of these power spectra is shown in Figure 3, for the cases with scalar and tensor order parameter with λ = 0 (no anchoring), keeping the same values of R and g in both of them. For both models and for both s and c, we observe that, overall, the power becomes concentrated at ever smaller values of the wave number k = |k| as time increases. This corresponds, as expected from Figures 1, 2, to an increase in the characteristic length scales for the order parameter and NP concentration fields. Nevertheless, from Figure 3 we can observe that such length scale increase is faster for s than for c when the LC order parameter is taken as scalar, but slows down noticeably for s when the LC order parameter is taken as a tensor (see Figure 3B). The numerical solutions with λ ≠ 0 display the same type of behavior and are not shown. Therefore, from this point we focus on the solutions for λ = 0, although we discuss quantitatively the effect of anchoring on the dynamics later in this section.
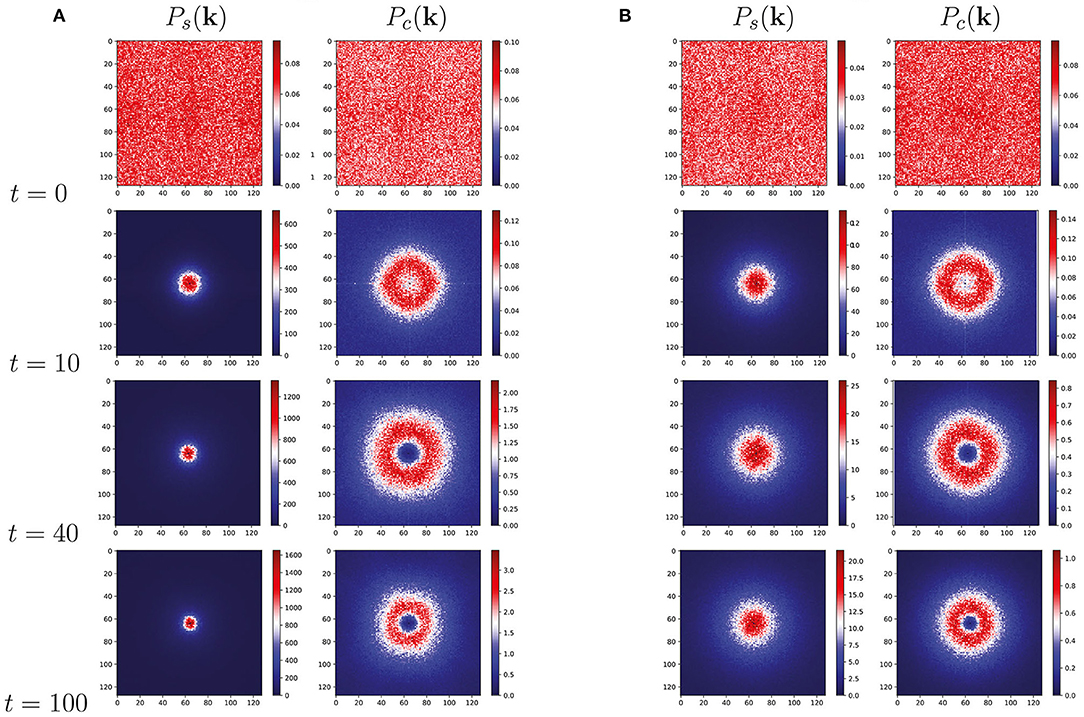
Figure 3. Time evolution of the power spectra of the nematization Ps(k) and the concentration Pc(k) from (A) the scalar Equations (9) and (B) the tensor Equations (14). As the time increases, the power is concentrated at ever smaller wave numbers k = |k|, indicating that the characteristic length in the system increases with time. Also, the conserved-field power spectra Pc(k) show clear maxima at intermediate wavenumbers, with noticeable smaller values at the origin. Parameters R = 0.1, g = 0.005, r = −1, c0 = 0.01 were fixed through the runs.
To study further the different behaviors observed in the Fourier space, we computed the angular average of the power spectra and plotted the resulting functions Ps(k, t) and Pc(k, t) against the wave number k at different times. For the model with scalar order parameter under conditions of low NP mobility (R = 0.1), we show the power spectra for s in Figure 4A and that of c in Figure 4C. Figures 4B,D show the corresponding power spectra, respectively, for conditions of high NP mobility (R = 10). For both values of R, the power spectrum Ps(k, t) for the nematization increases very quickly at low values of k, until this increment slows down and saturates (see Figures 4A,B). On the other hand, the power spectrum Pc(k, t) for the NP concentration is initially quiescent when the mobility R is small; only after some lag it increases with time and acquires a maximum at intermediate values of k (see Figure 4C): this corresponds to the bright rings visible in Figure 3. When the mobility R is high, however, the quiescent period is replaced with a process where the power spectrum decreases sharply at high wave numbers, and only later increases and develops a maximum at intermediate values of k (see Figure 4D).
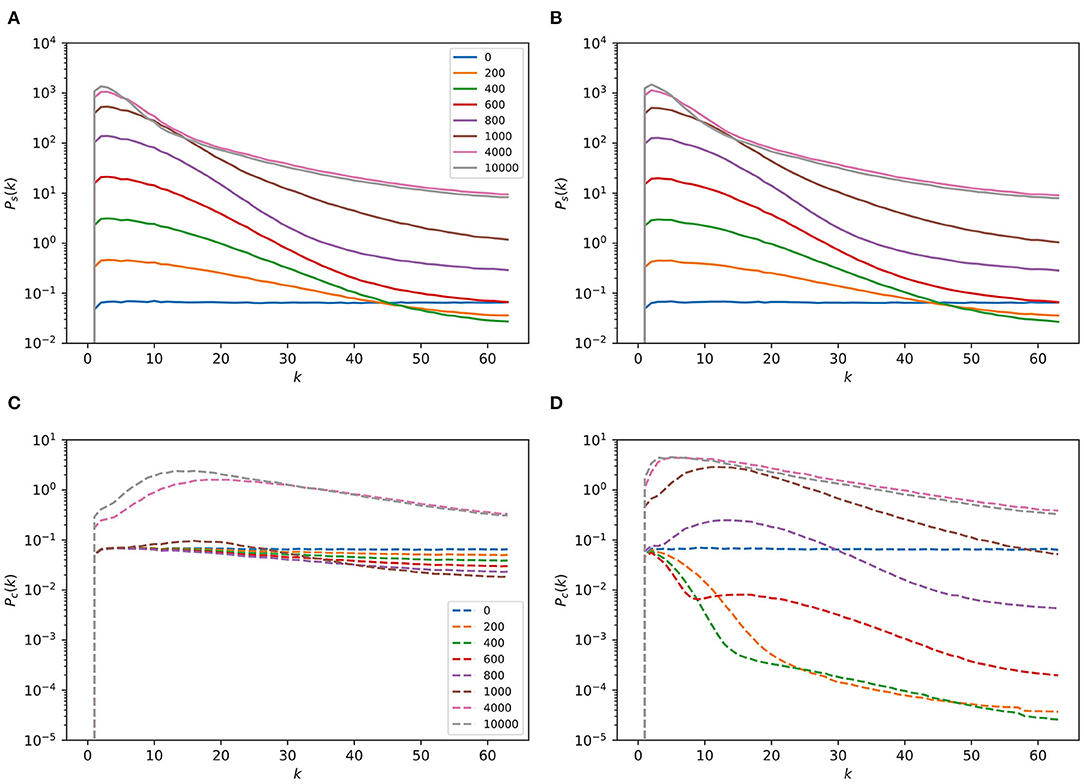
Figure 4. Time evolution of the angular average of the power spectra of the nematization Ps(k) and the concentration Pc(k), as functions of the wave number k, from the scalar Equations (9) for conditions of low and high NP mobility R: (A) Ps(k, t) for R = 0.1, (B) Ps(k, t) for R = 10, (C) Pc(k, t) for R = 0.1, (D) Pc(k, t) for R = 10. Each curve corresponds to the time indicated in the inset legends. While the nematization power spectrum increases quickly and steadily, the concentration power spectrum Pc(k) for low NP mobility goes through a quiescent stage before undergoing sudden increase, and even initially decreases at high wave numbers for high NP mobility. Parameters g = 0.005, r = −1, c0 = 0.01 were fixed through the runs.
The corresponding situation for the model with tensor order parameter is shown in Figure 5. Again, for conditions of low NP mobility (R = 0.1), we show the power spectra for s in Figure 5A and that of c in Figure 5C. On the other hand, Figures 5B,D show the corresponding power spectra of s and c, respectively, for conditions of high NP mobility (R = 10). The power spectrum Ps(k, t) for the nematization still increases rapidly at low values of k, but now the total increment is much reduced when compared with the result from the scalar equations. Eventually, growth is followed by a decrease with increasing time (see Figures 5A,C). On the other hand, the behavior of the power spectrum Pc(k, t) for the NP concentration remains qualitatively similar to that in the first model (see Figures 4B,D).
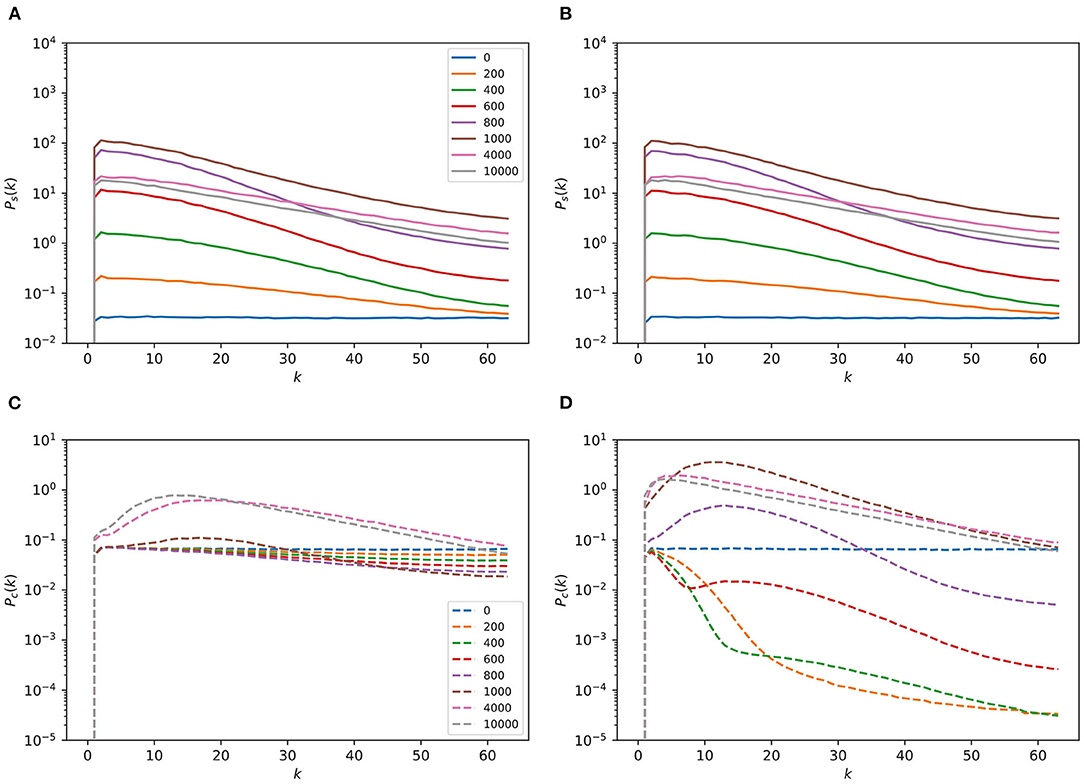
Figure 5. Time evolution of the angular average of the power spectra of the nematization Ps(k) and the concentration Pc(k), as functions of the wave number k, from the tensor Equations (14) for conditions of low and high NP mobility R: (A) Ps(k, t) for R = 0.1, (B) Ps(k, t) for R = 10, (C) Pc(k, t) for R = 0.1, (D) Pc(k, t) for R = 10. Each curve corresponds to the time indicated in the inset legends. Now, the nematization power spectrum increases quickly but non-monotonically with time. Nevertheless, the concentration power spectrum Pc(k) for low NP mobility still goes through a quiescent stage before undergoing sudden increase, and (initially) decreases at high wave numbers for high NP mobility. Parameters g = 0.005, r = −1, c0 = 0.01 were fixed through the runs.
An alternative view of the time evolution of the power spectra was obtained by plotting the maximum values of Ps and Pc, as functions of time in a semi-logarithmic scale, as shown in Figure 6. First, for the model coupling the NP concentration only to nematization (see Figure 6A), we observe a regime where the maximum of the nematization power spectrum grows exponentially with time, followed by saturation. We observe practically the same behavior for low and high values of the NP mobility parameter, R = 0.1 and 10 (respectively). Also for the case of scalar order parameter, we observe a lag interval where the maximum of Pc decreases by a small amount before growing rapidly toward some saturation value. Second, for the model coupling c and the tensor order parameter, we again observe exponential growth of the maximum of Ps, regardless of the value of R. Only, in this case, the exponential-growth regime does not reach values as high as in the first model, and it is followed by an overshoot before a decrease to a saturation value. For the second model, the maximum of Pc still shows the lag interval and decrease followed by growth to a saturation value. Here, the high mobility value R = 10 leads to a clear overshoot in the maximum of Pc, while the low mobility value does not.
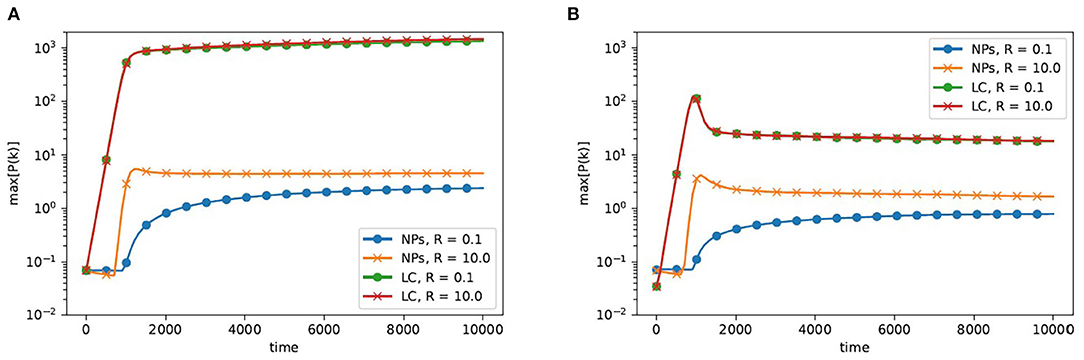
Figure 6. The maxima of the power spectra of the nematization and the concentration, as functions of time, for systems with anchoring parameter λ = 0 and with low and high NP mobility, from (A) the scalar dynamical Equations (9) and from (B) the tensor Equations (14). In both (A,B) circles correspond to low NP mobility R = 0.1 while crosses correspond to fast NP mobility R = 10. Initially, the nematization maxima grow exponentially and then saturate, but they show an overshoot with respect to the saturation value in the tensor case (B). On the other hand, the exponential growth of the concentration maxima lags behind the growth of the nematization maxima, but it is also followed by saturation. The lag period is shorter for the case of high NP mobility. Parameters g = 0.005, r = −1, c0 = 0.01 were fixed through the runs.
At this point, we present again results for the cases with positive and negative anchoring parameter λ. Figure 7 compares the time evolution of the maxima of the power spectra for nematization and concentration for conditions of homeotropic anchoring (λ > 0), planar anchoring (λ < 0), and absence of anchoring (λ = 0). We found that for the range of λ considered, corresponding to weak anchoring [28], the dynamics of the LC order parameter and the NP concentration display a minor dependence with the value of the anchoring parameter λ. We interpret this as a consequence that, since the initial concentration of NP was taken as very small, the local concentration remains small even at the NP aggregates, as well as the gradient of c. Thus, the influence of the anchoring that couples the gradients of concentration to those of the order parameter tensor is limited. With this in mind, we focus on the representative case with λ = 0 in the rest of the results section.
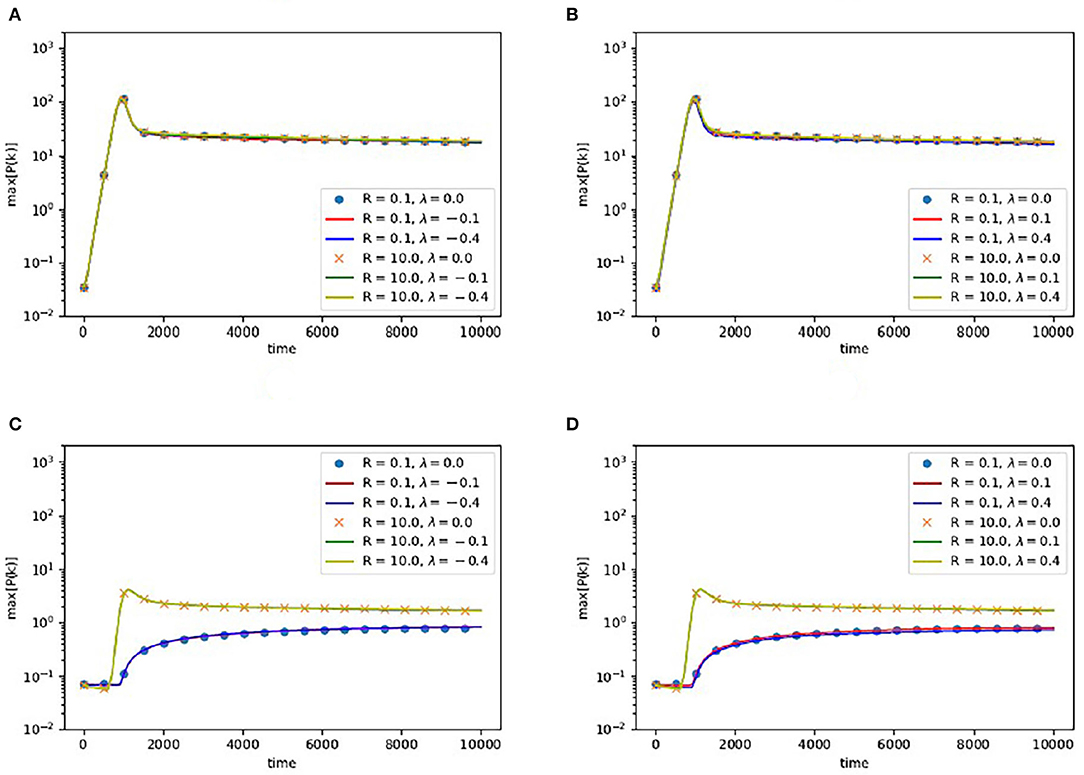
Figure 7. The time evolution of the maxima of power spectra, from the tensor equations incorporating anchoring (14) with NP mobility R=0.1 and R= 10, of: (A) the nematization when −0.4 ≤ λ ≤ 0 (planar anchoring), (B) the nematization when 0 ≤ λ ≤ 0.4 (homeotropic anchoring), (C) the NP concentration when −0.4 ≤ λ ≤ 0 (planar anchoring), and (D) the NP concentration when 0 ≤ λ ≤ 0.4 (homeotropic anchoring). To facilitate comparisons, circles and crosses indicate data for λ = 0. For the weak anchoring conditions and low initial NP concentration c0 = 0.01 considered here, the dynamics of the nematization shows only a small dependence with the value of the anchoring parameter. Parameters g = 0.005 and r = −1 were fixed through the runs.
We interpret the initial regimes of exponential growth in the power spectrum of the nematization as the interval where the dynamics can be described by the linear part of the dynamical equations, and the saturation regime as the set-in of the nonlinear saturation state where the nonlinear terms in the dynamics prevent exponential divergence of the nematization field. Also, we interpret the lag in the growth of the concentration power spectrum as arising from the conserved-field dynamics: since the dynamics of c is diffusive, at the linear stability analysis level we do not expect it to give rise to unstable modes at any wave number, only the non-conserved field may produce unstable modes and so in the initial regime (controlled by the linear dynamics) the only exponentially-rising power spectrum is the one for s.
The information contained in the power spectra can be translated back into direct space in the form of the auto-correlation functions for s and c. Figure 8 shows the time evolution of these correlation functions obtained from the scalar dynamical equations, for R = 0.1 and R = 10 (the tensor case correlation functions are qualitatively similar and shown in the Supplementary Figure 3). These functions decay over a short range, and such correlation range increases with time (as expected). Still, the auto correlation of the NP concentration remains flat over the initial lag period before growing quickly.
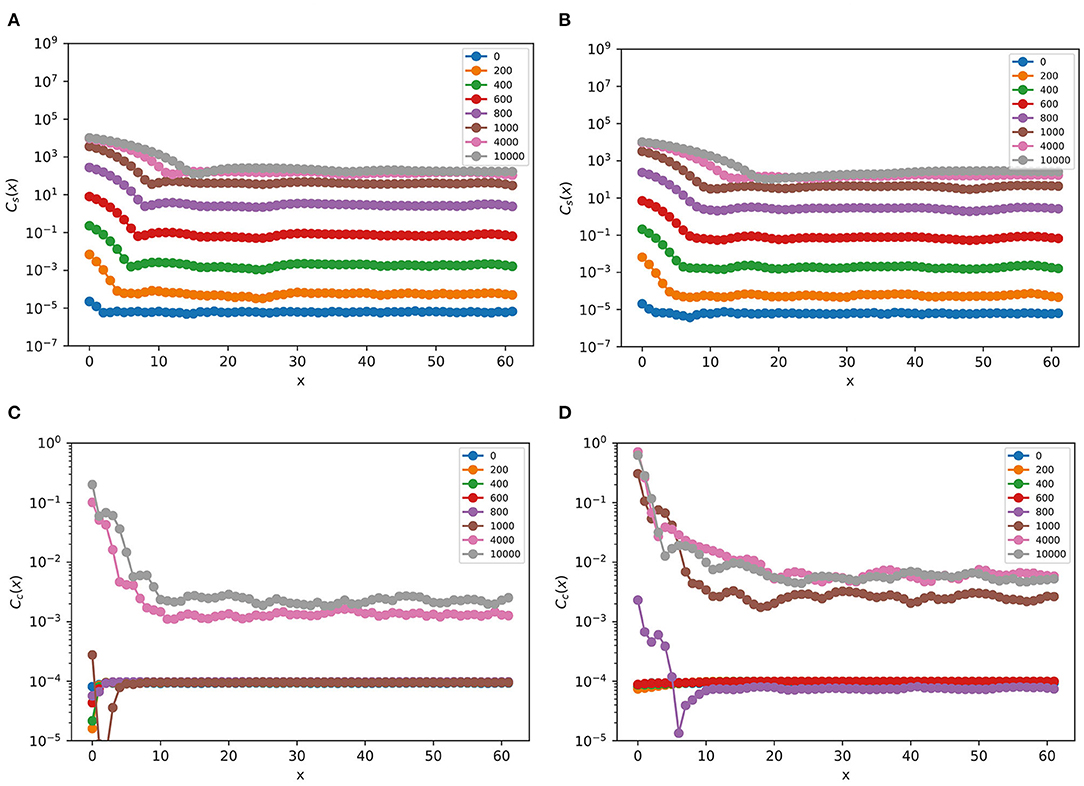
Figure 8. Time evolution of the correlation functions for the nematization and NP concentration from the scalar dynamical Equations (9), as functions of distance x, for low and high NP mobility conditions: (A) Cs(x) for R = 0.1, (B) Cs(x) for R = 10, (C) Cc(x) for R = 0.1, and (D) Cc(x) for R = 10. The color legends indicate the time t for each correlation function. Initially, the correlation for the nematization increases exponentially with increasing time, while that for the NP concentration remains small. Only after a lag period it rises abruptly. Parameters g = 0.005, r = −1, c0 = 0.01 were fixed through the runs.
Figure 9 shows the time dependence of the correlation lengths. For both the scalar and tensor order parameter models, the nematization correlation length is typically larger than the concentration correlation length. While the nematization correlation length in the scalar order parameter model grows monotonically with increasing time, in all other cases the correlation lengths show a peak over a time interval that matches the initial linear regime, followed by systematic increase afterwards. The lack of a peak in Ls(t) seems to us to be related to the absence of overshoot in the power spectrum Ps(k, t) for the scalar order parameter model when R = 0.1, since the corresponding curve for R = 10 (not shown) does show a peak while its corresponding power spectrum does present an overshoot.
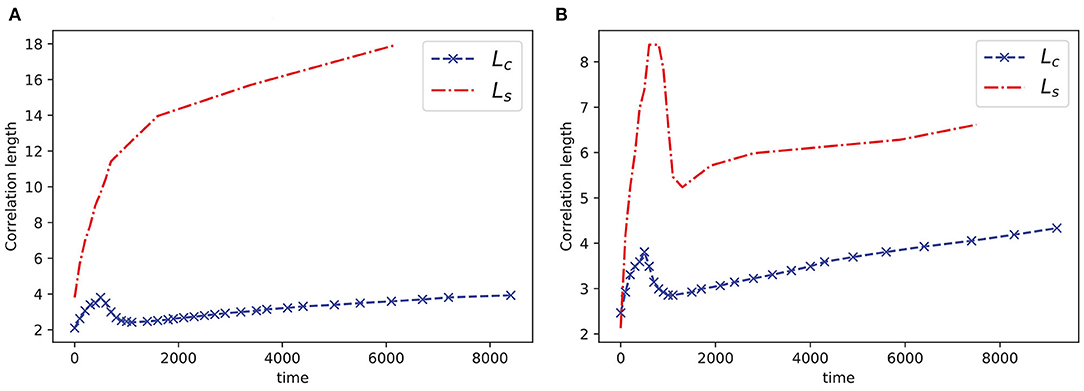
Figure 9. Correlation lengths Ls (top row) and Lc (bottom row) as functions of time for (A) the scalar order parameter model and (B) the tensor order parameter model. The nematization correlation length is generally larger than the NP concentration correlation length. The peaks in these curves span the initial linear regime. The curve for the nematization correlation length from the scalar dynamical equations does not display a peak. Parameters R = 0.1, g = 0.005, r = −1, c0 = 0.01 were fixed through the runs.
4. Discussion
Our results indicate that, for situations where the nanoparticle concentration is so low that approximation of their free energy up to the level of the second virial coefficient is adequate, the ordering of the nematic phase at temperatures below its phase transition proceeds exponentially with time, with little response of the NP material. Such exponential dependence is characteristic of the linear regime where the order parameter is small. Only after a lag the NPs couple effectively to the ordering in the liquid crystal, segregating to the regions where the nematic order parameter is close to zero. These initial stages are followed by the onset of nonlinear dynamics that leads to nonlinear saturation of the order parameter. Whether the LC order parameter is taken as a scalar or tensor does not change this sequence, but affects the kind of topological defects that capture the NP material (domain walls for the scalar case, point disclinations for the tensor one) as well as a clear overshoot of the exponential dynamics with respect to the nonlinear saturation level for the tensor case. We found insensitivity of the solution to the tensorial dynamical equations to the anchoring parameter λ for conditions of weak homotropic or planar anchoring. Since this parameter couples the gradient of the tensor order parameter with gradients in concentration, we interpret this insensitivity as arising from the low value of the conserved initial density: even at those regions where NP aggregate the local concentration and gradients remain small and so limit the influence of anchoring on the dynamics.
Compared with the model used by [12], our approach fully couples the dynamical equations for the LC order parameter with the NP concentration. Still, we find that for values of the coupling parameter g and initial NP concentration c0 as small as considered here (similar to those in experiments), the evolution of the LC component remains largely unaffected even when varying the relative mobility parameter R by two orders of magnitude. Numerical exploration of the dynamics at higher NP higher concentrations is certainly possible and useful for further investigation of the effects of anchoring, but this would require improving the NP free energy expression beyond the second virial coefficient level, as discussed below. For situations where the NP aggregates become sufficiently large and concentrated, they should start to behave as colloidal inclusions in the nematic phase, triggering processes where weak anchoring, as well as orientational elasticity, drive further interaction and structure formation at the colloidal length scale [29–31]. Another issue that should be addressed when considering higher NP concentration is the emergence of additional interactions driven by depletion interactions, as recently revealed by computer simulations [32]. It is also possible to explore the behavior for larger values of the coupling parameter g; preliminary results from molecular simulations indicate that the coupling parameter increases rapidly with pressure.
It is important to mention that the quadratic coupling term used in this work leads to different behavior from the linear one assumed by [12]: a linear coupling would result in preferential segregation of the NP field to regions where s is negative, instead of regions that are locally isotropic. Also, our choice for the free energy of the NPs leads to simple diffusive behavior, instead of the nonlinear dynamics of the Cahn-Hilliard equation,
where z = c − cc is the deviation of the NP concentration from its critical density cc. In this work, we assume that parameter Ω is positive and, therefore, that the NPs interact repulsively. In the absence of attractive interactions, no critical point is expected and so we used the Model C dynamics as stated. A Cahn-Hilliard treatment would allow us to generalize our model to include the effect of attractive interactions, but another possible route is to replace the expression for the NP free energy with known expressions for a Lennard-Jones [33] or a Square-Well fluid [34] and then use Model C to obtain the nonlinear dynamical equations. We are currently exploring this second avenue.
As mentioned earlier, our non-dimensionalization procedure for the dynamical equations assumes that parameter r = a(T − T*) is constant, and our numerical simulations correspond to evolution after a temperature quench below the isotropic-nematic transition. In order to simulate finite cooling rates, it would be sufficient to reframe the equations to incorporate a time dependence in parameter r. This would be useful to test directly the hypothesis of Riahinasab et al. that cooling rate and local shifts in the transition temperature due to higher concentration of nanoparticles dictate the morphology of NP assemblies during segregation from the nematic phase, and we plan to perform and report such calculations presently.
The modeling approach followed in this work can be extended to three-dimensional cases, where the tensor order parameter contains five degrees of freedom, but the numerical work becomes more demanding. In particular, our finite difference approach would probably need to be replaced with a more efficient scheme, such as finite element or Galerkin methods. Inclusion of stochastic noise terms into the dynamical equations is also a possibility, although it has been shown by Bray that it is an irrelevant perturbation in a Renormalization Group sense [6, 35]: transitions between the minima in the free energy are possible in the presence of thermal fluctuations (but are seldom observed in simulations over small domains) and the roughness of the interfacial structure is larger as the noise strength increases [35]. Another direction where our modeling approach can be applied is the study of active matter [35], in particular the case of active Langmuir monolayers [36] where a local concentration c of chiral molecules is coupled to a local orientation field n. By extending the description of the orientation to that of a tensor order parameter, defect dynamics beyond the director description could be captured. Finally, we point out opportunities for examining other nonlinear dynamical systems where one or more Newell-Whitehead equations become coupled to a conserved variable. As an instance, even if a quadratic term is absent in the dynamical equations for liquid crystals in two dimensions due to the traceless condition of its tensor order parameter, other systems may admit such a term. The spatially-dependent Nagumo equation contains such nonlinear dependence [3]:
where M represents the local population of a species undergoing motion and birth, death and mutual cooperation or competition, while D, C1, C2, C3 are parameters that account for such processes. In some epidemiological studies [37], a population of a short-lived species (for instance, mosquitoes) interacts with another species (such as large mammals or birds) with a very long lifespan compared to that of the first one. In such cases, as a consequence of a large separation of time scales, it may be interesting to consider the long-lived population as approximately conserved. We are currently surveying other instances of excitable nonlinear media where coupling to locally conserved fields is warranted as a promising research direction.
Data Availability Statement
The datasets presented in this study can be found in online repositories. The names of the repository/repositories and accession number(s) can be found at: https://doi.org/10.6084/m9.figshare.13309568.v3.
Author Contributions
OG was responsible for the conception and design of the work. FS-F created and maintained the computer codes. FS-F and ES-G performed the simulations enabling data collection. FS-F, ES-G, JF-C, and OG performed the interpretation of the results. FS-F and OG drafted the article, while ES-G and JF-C critically revised it. Final approval of the version to be published was done by FS-F, ES-G, JF-C, and OG. All authors contributed to the article and approved the submitted version.
Funding
OG, FS-F, and JF-C acknowledge funding from Conacyt (Mexico) Proyecto CB-2016-01 286326. ES-G acknowledges a graduate studies scholarship from Conacyt (Mexico). OG acknowledges Universidad Autónoma Metropolitana for funding publication fees.
Conflict of Interest
The authors declare that the research was conducted in the absence of any commercial or financial relationships that could be construed as a potential conflict of interest.
Acknowledgments
OG thanks Juan Manuel Noriega Hernández for useful comments regarding unstable modes from a linear stability analysis of the dynamical equations for s and c.
Supplementary Material
The Supplementary Material for this article can be found online at: https://www.frontiersin.org/articles/10.3389/fphy.2021.636288/full#supplementary-material
References
1. Cross M, Greenside H. Pattern Formation and Dynamics in Nonequilibrium Systems. Cambridge, MA: Cambridge University Press (2009).
2. Hoyle R. Pattern Formation: An Introduction to Methods. Cambridge, MA: Cambridge University Press (2010).
3. Kenkre VMN, Giuggioli L. Theory of the Spread of Epidemics and Movement Ecology of Animals. Cambridge, MA: Cambridge University Press (2021). doi: 10.1017/9781108882279
4. Monroy DL, Naumis GG. Description of mesoscale pattern formation in shallow convective cloud fields by using time-dependent Ginzburg-Landau and Swift-Hohenberg stochastic equations. Phys Rev E. (2021) 103:032312. doi: 10.1103/PhysRevE.103.032312
5. Hariharan G. An efficient legendre wavelet-based approximation method for a few Newell-Whitehead and Allen-Cahn equations. J Membr Biol. (2014) 247:371–80. doi: 10.1007/s00232-014-9638-z
7. Allen SM, Cahn JW. Coherent and incoherent equilibria in iron-rich iron-aluminum alloys. Acta Metall. (1975) 23:1017–26. doi: 10.1016/0001-6160(75)90106-6
8. Hohenberg PC, Halperin BI. Theory of dynamic critical phenomena. Rev Mod Phys. (1977) 49:435–79. doi: 10.1103/RevModPhys.49.435
10. Rodarte AL, Pandolfi RJ, Ghosh S, Hirst LS. Quantum dot/liquid crystal composite materials: self-assembly driven by liquid crystal phase transition templating. J Mater Chem C. (2013) 1:5527–32. doi: 10.1039/c3tc31043d
11. Rodarte AL, Cao BH, Panesar H, Pandolfi RJ, Quint M, Edwards L, et al. Self-assembled nanoparticle micro-shells templated by liquid crystal sorting. Soft Matter. (2015) 11:1701–7. doi: 10.1039/C4SM02326A
12. Riahinasab ST, Keshavarz A, Melton CN, Elbaradei A, Warren GI, Selinger RLB, et al. Nanoparticle-based hollow microstructures formed by two-stage nematic nucleation and phase separation. Nat Commun. (2019) 10:1–10. doi: 10.1038/s41467-019-08702-3
13. Lou XWD, Archer LA, Yang Z. Hollow micro-/nanostructures: synthesis and applications. Adv Mater. (2008) 20:3987–4019. doi: 10.1002/adma.200800854
14. Rodarte AL, Nuno ZS, Cao BH, Pandolfi RJ, Quint M, Ghosh S, et al. Tuning quantum–dot organization in liquid crystals for robust photonic applications. ChemPhysChem. (2014) 15:1413–21. doi: 10.1002/cphc.201301007
15. Prieto G, Tüysüz H, Duyckaerts N, Knossalla J, Wang GH, Schüth F. Hollow nano- and microstructures as catalysts. Chem Rev. (2016) 116:14056–119. doi: 10.1021/acs.chemrev.6b00374
16. Atzin N, Guzmán O, Gutiérrez O, Hirst LS, Ghosh S. Free-energy model for nanoparticle self-assembly by liquid crystal sorting. Phys Rev E. (2018) 97:1–7. doi: 10.1103/PhysRevE.97.062704
17. Kröger M, Ilg P. Derivation of Frank-Ericksen elastic coefficients for polydomain nematics from mean-field molecular theory for anisotropic particles. J Chem Phys. (2007) 127:034903. doi: 10.1063/1.2743961
18. Luo AM, Sagis LMC, Ilg P. The Landau free energy of hard ellipses obtained from microscopic simulations. J Chem Phys. (2014) 140:124901. doi: 10.1063/1.4868988
19. Anderson VJ, Terentjev EM, Meeker SP, Crain J, Poon WCK. Cellular solid behaviour of liquid crystal colloids 1. Phase separation and morphology. Eur Phys J E. (2001) 4:11–20. doi: 10.1007/PL00013680
20. Phuong NH, Germano G, Schmid F. Elastic constants from direct correlation functions in nematic liquid crystals: a computer simulation study. J Chem Phys. (2001) 115:7127–234. doi: 10.1063/1.1404388
21. Poniewierski A, Stecki J. Statistical theory of the Frank elastic constants. Phys Rev A. (1982) 25:2368–70.
22. Allen MP, Warren MA, Wilson MR, Sauron A, Smith W. Molecular dynamics calculation of elastic constants in Gay–Berne nematic liquid crystals. J Chem Phys. (1996) 105:2850–8.
23. Joshi AA, Whitmer JK, Guzmán O, Abbott NL, de Pablo JJ. Measuring liquid crystal elastic constants with free energy perturbations. Soft Matter. (2014) 10:882–93. doi: 10.1039/C3SM51919H
24. Elder KR, Morin B, Grant M, Desai RC. Late-time theory for the effects of a conserved field on the kinetics of an order-disorder transition. Phys Rev B. (1991) 44:6673–88.
25. Andrienko D. Introduction to liquid crystals. J Mol Liquids. (2018) 267:520–41. doi: 10.1016/j.molliq.2018.01.175
26. Coles HJ. Laser and electric field induced birefringence studies on the cyanobiphenyl homologues. Mol Cryst Liq Cryst. (1978) 49:67–74. doi: 10.1080/00268947808070330
27. Das SK, Rey AD. Texture formation under phase ordering and phase separation in polymer-liquid crystal mixtures. J Chem Phys. (2004) 121:9733. doi: 10.1063/1.1804494
28. Matsuyama A. Morphology of spinodal decompositions in liquid-crystal-colloid mixtures. J Chem Phys. (2008) 128:224907. doi: 10.1063/1.2936831
29. Poulin P, Stark H, Lubensky TC, Weitz DA. Novel colloidal interactions in anisotropic fluids. Science. (1997) 275:1770–3.
30. Stark H. Physics of colloidal dispersions in nematic liquid crystals. Phys Rep. (2001) 351:387–474. doi: 10.1126/science.275.5307.1770
31. Lapointe CP, Mason TG, Smalyukh II. Shape-controlled colloidal interactions in nematic liquid crystals. Science. (2009) 326:1083–6. doi: 10.1126/science.1176587
32. Müller D, Kampmann TA, Kierfeld J. Chaining of hard disks in nematic needles: particle-based simulation of colloidal interactions in liquid crystals. Sci Rep. (2020) 10:12718. doi: 10.1038/s41598-020-69544-4
33. Stephan S, Staubach J, Hasse H. Review and comparison of equations of state for the Lennard-Jones fluid. Fluid Phase Equilib. (2020) 523:112772. doi: 10.1016/j.fluid.2020.112772
34. del Río F, Guzmán O, Martínez FO. Global square-well free-energy model via singular value decomposition. Mol Phys. (2018) 116:2070–82. doi: 10.1080/00268976.2018.1461943
35. Desai RC, Kapral R. Dynamics of Self-Organized and Self-Assembled Structures. Cambridge, MA: Cambridge University Press (2009). doi: 10.1017/CBO9780511609725
36. Shibata T, Mikhailov AS. Nonequilibrium self-organization phenomena in active Langmuir monolayers. Chaos. (2006) 16:037108. doi: 10.1063/1.2213580
Keywords: dynamic equations, model C, liquid crystal, nanoparticles, mixture, self-assembly, phase separation sorting, conserved and nonconserved fields
Citation: Segura-Fernández FG, Serrato-García EF, Flores-Calderón JE and Guzmán O (2021) Dynamics of Nanoparticle Self-Assembly by Liquid Crystal Sorting in Two Dimensions. Front. Phys. 9:636288. doi: 10.3389/fphy.2021.636288
Received: 02 December 2020; Accepted: 13 April 2021;
Published: 20 May 2021.
Edited by:
Enrique Hernandez-Lemus, Instituto Nacional de Medicina Genómica (INMEGEN), MexicoReviewed by:
Martin Kröger, ETH Zürich, SwitzerlandAlejandro Gil-Villegas, University of Guanajuato, Mexico
Copyright © 2021 Segura-Fernández, Serrato-García, Flores-Calderón and Guzmán. This is an open-access article distributed under the terms of the Creative Commons Attribution License (CC BY). The use, distribution or reproduction in other forums is permitted, provided the original author(s) and the copyright owner(s) are credited and that the original publication in this journal is cited, in accordance with accepted academic practice. No use, distribution or reproduction is permitted which does not comply with these terms.
*Correspondence: Orlando Guzmán, b2d1em1hbkBpenQudWFtLm14