 Guolin Li
 Qingzhi Jiang
 Chenquan Hua
 Kun Ma
 Yue Jiao
 Wenhai Ji
- College of and Control Science and Engineering, China University of Petroleum, Qingdao, China
A novel rugged two-section driving NIR TDLAS scheme was implemented to reduce temperature and pressure sensitivity of methane carbon isotope measurement during oil and natural gas drilling operations. Isotope spectra line groups with same lower energy levels were selected to derive the concentration of 13CH4 and 12CH4. Dynamic pressure linewidth broadening was introduced in the absorbance curve fitting. Various uncontrollable factors such as spectra shift, stretching, and baseline trending were incorporated in the comprehensive multi-peak fitting. The results showed that the sensitivity of isotope ratios to temperature and pressure variation was greatly suppressed. The δ13CH4 uncertainty in the temperature test was 2.8‰ with fitted δ13CH4-T slope of 0.021‰/°C in 25 ± 5°C range. The δ13CH4 uncertainty in the pressure test was 1.4‰ with fitted δ13CH4-P slope of <0.001‰/mbar from 400 to 1000 mbar. The limit standard deviation of long-term test was 0.15‰ (@135 s). The results indicate that our scheme is a promising solution for δ13CH4 measurement during drilling operations due to the enhanced robustness.
Introduction
The natural gases’ carbon isotopes composition provides an effective basis for quantitatively describing the migration, transformation, and traceability of chemical substances in oil and gas resources [1–5]. Therefore, it is necessary to develop an efficient and stable technique for in situ detecting the carbon isotopes during oil and natural gas drilling operations [6, 7]. Isotopic abundance can be expressed as the relative ratio between the heavy isotopic component and the light isotopic components. δ13CH4 is determined by measuring the concentration ratio of 13CH4 and 12CH4. The δ13CH4 detection in the drilling site requires in situ measurement, robustness in the harsh operating conditions, and better than 1‰ accuracy.
Various spectroscopic techniques have been investigated for carbon isotope detection, including Fourier transform infrared spectroscopy (FTIR) [8], tunable diode laser absorption spectroscopy (TDLAS), off-axis integrated cavity output spectroscopy (OA-ICOS) [9–11], and cavity ring -down spectroscopy (CRDS) [12]. Nixon et al. measured the Mars’ satellite Titan’s δ13CH4 with ±83‰ uncertainty by using FTIR [13], which is due to the incoherence of broadband light in FTIR. OA-ICOS and CRDS were used to measure δ13CH4 in atmospheric background methane with an accuracy of 1–2‰ [14, 15]. Even the sensitivity is high, the δ13CH4 values were extremely sensitive to gas temperature and pressure. For example, 1‰ δ13CH4 accuracy requires temperature < ±50 mK and pressure <±1.33 mbar [16].
Other spectroscopic δ13CH4 measurement in trace environmental methane used mid-infrared lasers such as interband cascade laser (ICL) [16], nonlinear differential frequency generation (DFG) through LiNO3 crystal [17, 18], with accuracy ranging from 0.7‰ to 12‰. Due to increased optical pathlength in multiple reflection gas cell, tunable diode laser absorption spectroscopy (TDLAS) with NIR laser is feasible to measure δ13CH4 in natural gas. In 2019, Zhang et al. used a 1.658 µm DFB laser to detect δ13CH4 in coal bed methane (CBM) and achieved standard deviation of 0.47‰ [19]. However, their control accuracy of temperature and pressure was very tight, i.e., P < ±1 mbar and T < ±0.05 K.
Thus, the temperature and pressure sensitivities are common issues of current spectroscopic isotope measurement techniques which hinder their applications in drilling operations. In present work, we proposed a novel single laser TDLAS technique by selecting isotope spectral lines with the same lower energy level to suppress the temperature variation impact on absorption strength. In addition, two-section laser driving, and comprehensive multi-peak fitting model were used to compensate the pressure dependence. The experimental result was around 1‰ precision without tight control of temperature and pressure.
Selection of Isotope Spectra Lines
Concentration of gaseous 13CH4 and 12CH4 can be derived through their absorption spectra based on Beer-Lambert’s Law. When selecting 13CH4 and 12CH4 absorption spectral lines near 1.65 µm through HITRAN2016 database [20], the line separation, line strength, and temperature sensitivity should be considered. Eventually, four lines of 5E, F→6E, F transition belonging to the 2ν3 R5 line were chosen for 13CH4, listed as A1-A4 in Table 1 and plotted in Figure 1 (blue A1-A4 dots). Two lines of 5F2,1→5F1,2 transition belonging to the 2ν3 Q5 line were chosen for 12CH4, listed as B1-B2 in Table 1 and plotted in Figure 1 (red B1-B2 dots). They are ∼1.8 nm apart, which is close to the tuning limit of a DFB laser. For spectral strength, the line strength of 12CH4 is about twice of 13CH4 under natural abundance. Thus, the 12CH4 spectra provide a stable reference for measuring the 13CH4 spectra and concentration of subtle isotope variation. The lower level vibration quantum numbers of A and B lines are (0,0,0,0), the rotational quantum numbers are 5, and the energies are ∼157.1 cm−1. Thus, the influence of temperature on the absorption spectra is canceled per Boltzmann distribution. The detection result is insensitive to temperature variation. The candidate spectral lines A and B with important spectral parameters are shown in Table 1. Besides A and B lines, suboptimal 12CH4 candidate lines C1-C2 with least spectral interference are also listed in Table 1 and plotted in Figure 1(red C1-C2 dots). Three congested 12CH4 peaks at 6046.94, 6046.95, and 6046.96 cm−1 with corresponding 3F, A→4F, A transitions belonging to the 2ν3 R4 line are located in the middle of the wavelength range, listed in Table 1 as O1-O3. Their line intensities are 2–3 orders of magnitude stronger, which are out of Figure 1 scope.
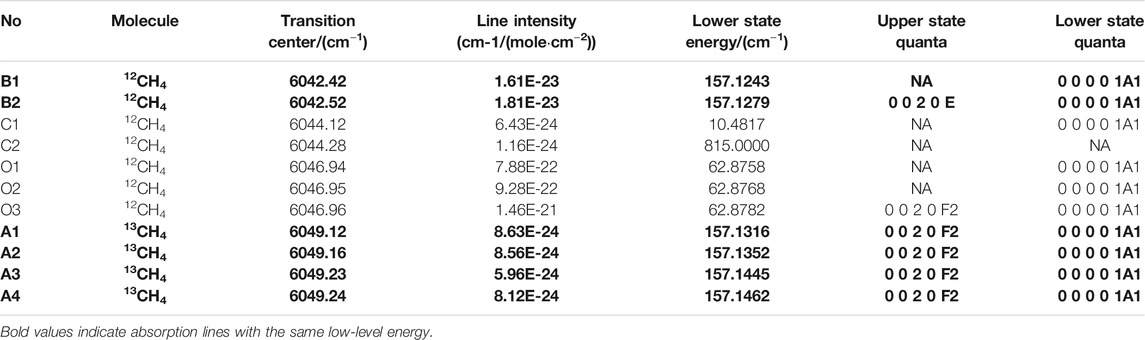
TABLE 1. The spectral parameters of 13CH4 and 12CH4 candidate lines.
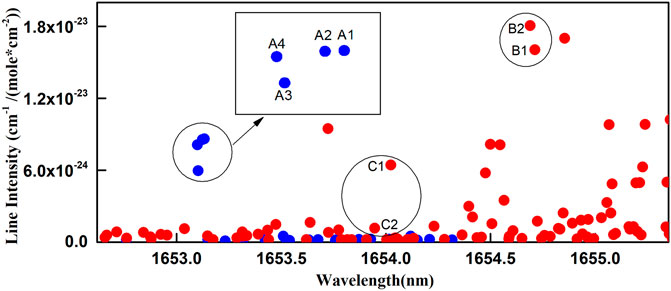
FIGURE 1. The line intensity plot of CH4 in the 2v3 absorption band. The red dots are for 12CH4 and the blue dots are for 13CH4 with insets indicating detailed view.
Spectroscopy Theory for Isotope Measurement
Isotopic abundance can be expressed as the relative ratio between the heavy isotopic component and the light isotopic components. For example, the carbon isotope abundance value (13C) of a sample can be described by δ13C [4] i.e.,
Where, (13C/12C)Sample is the concentration ratio 13C to 12C of test sample; (13C/12C)PDB is the ratio of standard substance- Pee Dee Belemnite. By definition, δ13C for PDB is 0, and the corresponding 13C:12C ratio is 0.01118. δ13CH4 was determined by measuring the concentrations of 13CH4 and 12CH4. The concentration was derived by fitting the absorbance curve which was transformed from the normalized transmission spectra [20].
The target test sample is natural gas. But only its major component methane is used in our experiment for simplicity. The tested methane was in a 30 L stainless steel cylinder at a starting pressure of 1500 psi and was provided by Yantai Deyi Specialty Gas. Before we ran the spectra test, gas was sampled twice and was analyzed by a Thermo Fisher Scientific isotope analyzing system consisting of TRACE1310 gas chromatograph (GC) and MAT 253 PLUS mass spectrometer (MS). The average δ13CH4 values after 4–5 analysis were −41.04‰ and −41.01‰ which provided the basis to calibrate the accuracy of present spectroscopic method.
Experimental Apparatus
Experiment Setup
The experiment was carried out in an automatic gas mixing station (Figure 2) which was controlled through a LabVIEW program. The station consists of mass flow controllers (MFC, Sevenstar CS200), pressure controller (PC, TESCOM ER5000), vacuum pump and temperature chamber. The gas cell was placed inside the temperature chamber where experiment can run from 0 to 50°C. The MFCs’ ranges are in 100–5000 SCCM with an accuracy of 1%. The pressure range is 400–1000 mbar with an accuracy of about 2 mbar. The tests ran automatically with different gas mixture in four dimensions including flow rate, ratio, temperature and pressure.
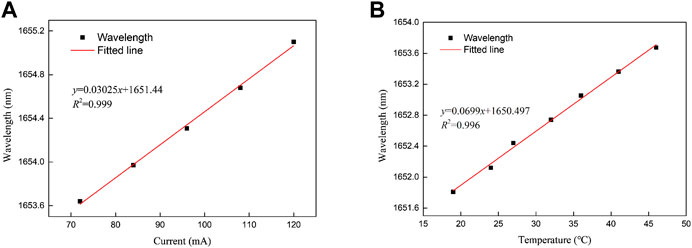
FIGURE 2. The stability of the absorption spectrum of the laser light intensity absorbed by 10% methane gas.
The TDLAS apparatus’ scheme is shown in Figure 3. A butterfly NIR DFB diode laser (Wuhan 69 Sensors, SN18020801) was used for direct absorption measurement. The wavelength scan was controlled by a periodical waveform current to cover both the target absorption lines of 13CH4 and 12CH4. The laser output was coupled into a multi-pass Chernin cell with 20 m pathlength through its pigtail fiber. A built in InGaAs photon detector was used to collect the transmitted light. The detector signal went through I-V conversion and low-pass filtering before analog digital convertor (DAC) acquisition.
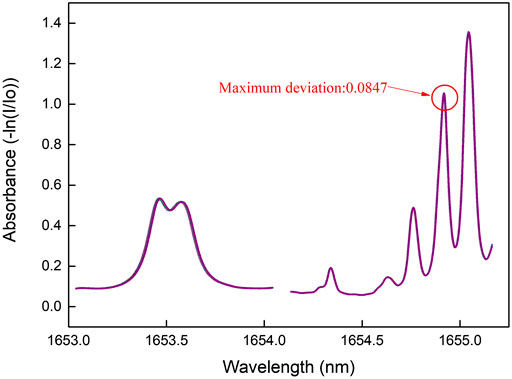
FIGURE 3. TDLAS platform and test setup.
By using Hewlett Packard 86120B wavelength meter and Fabry-Perot (F-P) scanning interferometer (SA210-12B) to study the tuning parameters of the laser, the tuning curve is shown in Figure 4. The current tuning coefficient and temperature tuning coefficient of the laser are 0.03025 nm/mA and 0.0699 nm/°C respectively. The average wavelength-current tuning coefficient is larger than that of ordinary DFB lasers (typically 0.005–0.01 nm/mA). This laser diode was specifically chosen for its large tuning coefficient, so that all target absorption lines of 13CH4 and 12CH4 were covered.
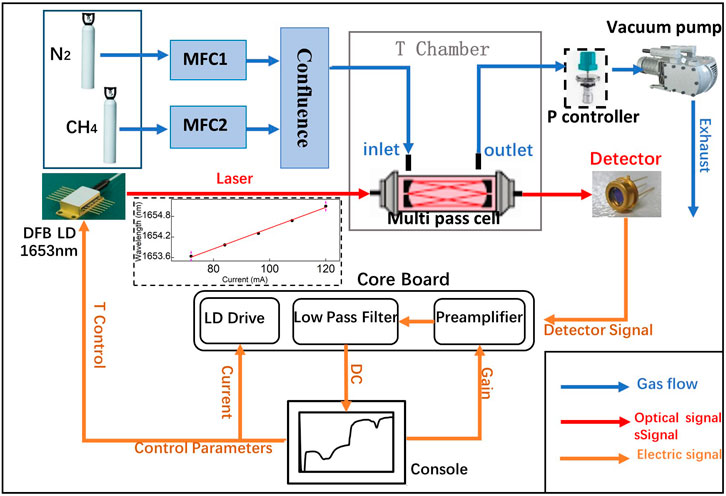
FIGURE 4. (A) Laser current tuning curve (B) Laser temperature tuning curve.
In order to verify the stability of the laser light source, the laser temperature was stabilized at 34.3°C and the driving current were set at 25–35 mA and 90–116 mA, the stability of the absorption spectrum of the laser light intensity absorbed by 10% methane gas has been researched, the test time was 1 h, and extracted 100 absorption spectra, as shown in Figure 2. The maximum deviation was 0.0847, so it is indirectly proved that the laser has good stability.
Two-Section Driving of DFB Laser
However, there are still challenges in spectra analysis due to the following reasons. First, there are lots of lines in between the two target line groups and some lines are adjacent to the target lines (Figure 1 insets). Second, there is strong linearity due to the large wavelength separation (Figure 4). Thus, it brings extra uncertainty in absorbance calculation. There is too much trivial information in the collected spectra for continuous nonstop scan (Figure 5A).
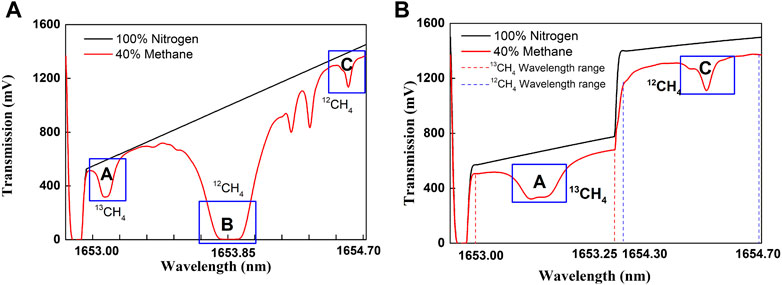
FIGURE 5. (A) current profiles and transmission spectra of 40% methane in conventional one section driving (I = 25–100 mA). (B) in two-section driving (I1 = 25–35 mA and I2 = 90–100 mA) scheme.
A two-section current driving scheme was proposed and implemented to address these challenges. In this scheme, the two isotope target spectra lines were aimed by two sections of driving current (I1 = 25–35 mA, I2 = 90–100 mA) at laser operating T of 34.3°C (Figure 5B). The overall scan period was 200 ms. The strong peak in conventional one large section (I = 25–100 mA) driving scheme (Figure 5A O) was eliminated. As a result, the spectra gain setting is now restricted by the target lines rather than by the strong background lines, which increase the spectra signal strength by more 100 times. In addition, the data length representing target lines increased from 260 points to approximately 900 points, with resolution increased 3.5 times. Thus, the features in experimental absorbance have better resemblance with HITRAN2016 simulated absorbance. The wavelength linearity in each section was also improved.
Spectra Preprocess
In order to improve the signal to noise ratio of spectra, the spectra were averaged after every 10 scans. In order to calculate the absorbance, the transmitted light I0 with no absorbing gas (pure nitrogen) in the cell was collected and was used as the normalization basis. When the sample gas was guided into the cell, real time transmitted light Is was collected. In each section, the absorbance curve Ai was calculated separately.
Where, i = 1,2 is the current section index, Isi, Ioi are the transmitted light power in the ith section with and without absorbing gases.
Multi-Peak Fitting
For the temperature and pressure range in the experiment, a Gaussian waveshape was adopted in the absorbance spectra fitting. In fact, there are more peaks in the absorbance curve other than the target peaks in the designated section. A multi-peak fitting model was introduced,
Where, Cj (j = 1,2) is the coefficients proportional to the 13CH4 and 12CH4 concentration and is further used to calculate δ13CH4,
The initial values of the peak center, line width, line amplitude and line separations are linearly related to the spectral parameters in HITRAN2016. There is a scale transformation from the database with absolute wavelength to experimental spectra with discrete data points by,
Where, μ1 is the position of first peak in the experimental absorbance curve, hi is the wavelength difference in database between the ith line and the first line, b is the scale transformation coefficients. By this formula, the spectra shift the horizontal direction can be automatically adjusted and compensated.
However, there are many practical factors affecting the performance in experiment. Due to laser/detector aging, gas flow turbulence, mirror contamination or optical alignment change, thermal drift of amplifier’s gain, there are uncontrollable fluctuations in the transmitted light, which will result in the whole absorbance curve upward or downward shift. The strong nonlinear wavelength-current relation causes the nonlinear shift (i.e., stretch) of the absorbance spectra. Furthermore, there is also nonlinear detector response at different laser power level which makes the absorbance curve having a trending baseline. So, we have to build a comprehensive fitting model by introducing more parameters,
Where, the extra terms c, k1x, and k2x are used to compensate baseline trending, horizontal scale stretching and the vertical shift in the absorbance curve. The curve fitting model was implemented in a MATLAB program. The detection accuracy of δ13C is determined by Eq. 5. The parameters that affect the error of comprehensive fitting model φ(x) mainly include fitting coefficients (Cj), absorbance strength of the ith line the jth isotope molecules (
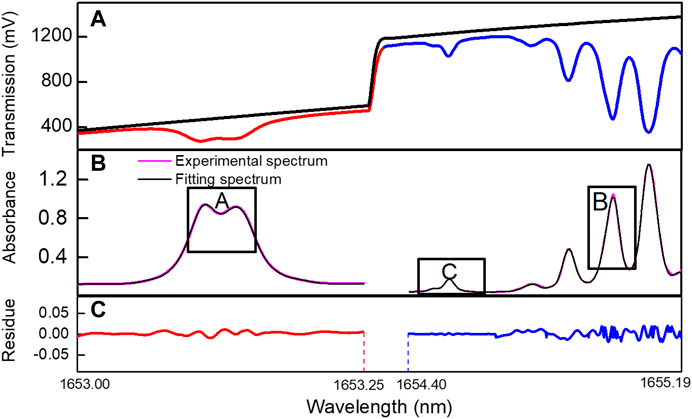
FIGURE 6. Spectra analysis process: (A) the transmitted light I0 and Is; (B) the absorbance curve; (C) the spectra fitting residue.
Experiments and Results
The isotope ratio measurement performance was experimentally evaluated in terms of temperature sensitivity, pressure sensitivity and repeatability. The experimental details are listed in Table 2. The repeatability was characterized by standard deviation of δ13CH4 in the long-term test. The spectroscopic ratio values of 10% CH4 at 25°C, 400 mbar were used as the reference, corresponding to δ13CH4 of −41.04‰.
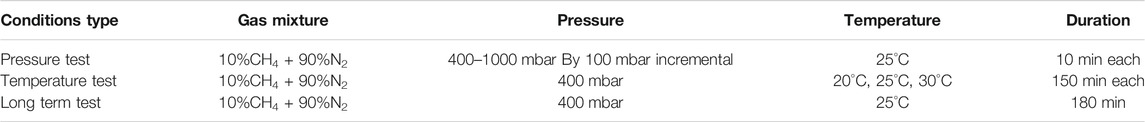
TABLE 2. Experimental protocol table.
Pressure Dependence
Simulated absorbance curves for each wavelength region at 400, 700, and 1000 mbar based on the HITRAN2016 are plotted in Figures 7A,B. As a comparison, the experimental absorbance curves from pressure test are plotted in Figures 7C,D for each driving section. The Simulated absorbance curve for 13CH4 and 12CH4 data are derived from HITRAN2016, the carbon isotope abundance value (δ13C) for simulation data is different from δ13C for the experimental data. Thus, simulated absorbance curve for 13CH4 and 12CH4 do not agree with experimental absorbance curve for 13CH4 and 12CH4 in Figure 7. As the pressure changes, the pressure broadening effect becomes more obvious. With the decrease of the pressure, the full width at half maximum of absorbance curve for 13CH4 and 12CH4 decreases gradually. Absorption spectrum mixing effect is less apparent. Thus, experiment running at lower pressure can help to improve δ13C detection accuracy.
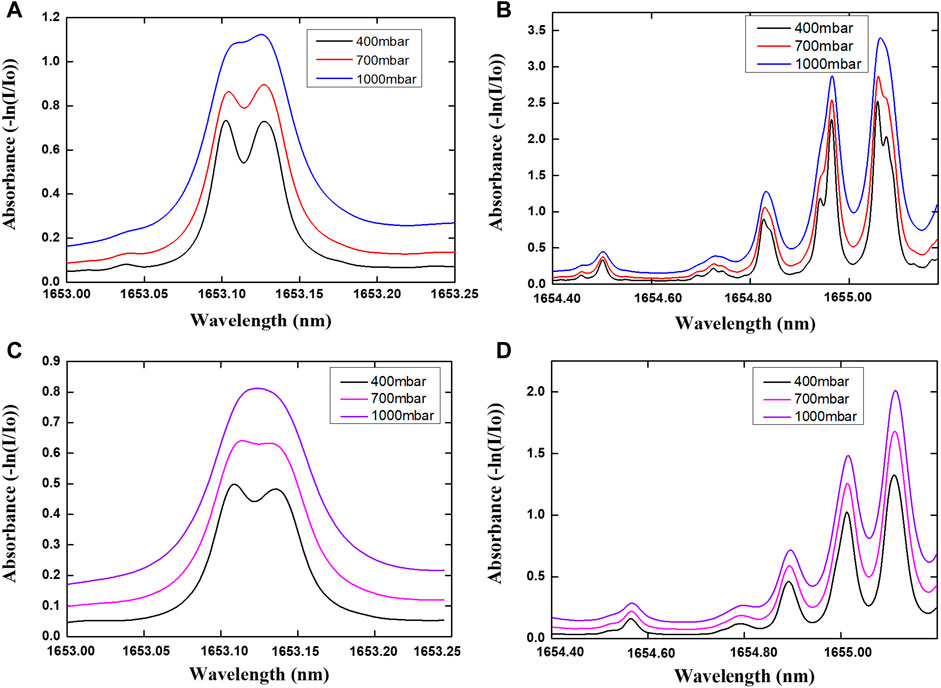
FIGURE 7. The experimental and simulation absorbance curves of 10% CH4 and 90% N2 in each section at 400, 700, 1000 mbar pressures: (A) HITRAN2016 Simulated absorbance curve for 13CH4 and (B) for 12CH4; (C) Experimental absorbance curve for 13CH4 and (D) for 12CH4.
To extend pressure range coverage, the pressure broadened linewidth was included in the curve fitting Eq. 4. The linewidth for each peak was calculated by,
Where, P is gas pressure in ATM, nCH4 and nN2 are the relative concentrations of methane and nitrogen in the gas mixture, δself and δair are self and air pressure broadening coefficients from HITRAN2016. For the selected 13CH4 spectra lines, their self and air broadening coefficients are 0.06 and 0.077 cm−1/ATM. For the selected 12CH4 spectra lines (Choice B), their self and air broadening coefficients are 0.066 and 0.077 cm−1/ATM. The δ13CH4 in the pressure test is plotted in Figure 8. The standard deviation for the overall test is 1.4‰ (Figure 8A). The δ13CH4 shows no pressure dependence with linear fit slope <0.001‰/mbar (Figure 8B). Introduction of dynamic pressure linewidth broadening by Eq. 5 is the key to maintain good δ13CH4 accuracy in pressure test.
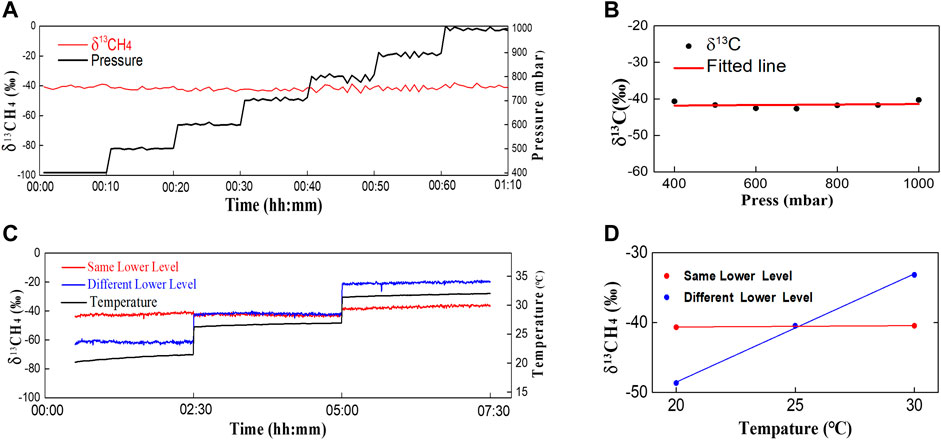
FIGURE 8. δ13CH4 in the pressure and temperature sensitivity test. (A) δ13CH4 and pressure reading in pressure test; (B) δ13CH4-pressure dependence analysis; (C) δ13CH4 and temperature reading in temperature test for choice B (red) and choice C (blue); (D) δ13CH4 -temperature dependence analysis for choice B (red) and choice C (blue).
Temperature Dependence
For the two choices of measuring 12CH4, choice B is the target line with same lower energy levels, but it is congested with other lines. Choice C is more isolated and less affected by the interference. As a comparison, we used both choices to fit the coefficients of 12CH4. The calculated δ13CH4 during temperature test with same flowing gas for choice B and C was plotted in Figure 8C red and blue curve. The choice C is clearly more sensitive to temperature change. The standard deviations in the whole test are 2.8‰ and 16.9‰ for choice B and C respectively. The linear fitting slope of δ13CH4 - temperature curve for choice B (Figure 8D red curve) is 0.021‰/°C which is 2 orders weaker than that of choice C (1.55‰/°C, Figure 8D blue curve). This proved that the selection of same lower energy state was more effective than spectra interference in terms of reducing temperature dependence.
Long Term Test
During the 3-hour long term test, the gas cell was placed inside the test chamber with T set at 25°C. The pressure was maintained at 400 mbar. The gas mixture of 10% CH4 and 90% N2 flowed through the cell at 100 ml/min rate. Totally 500 spectra were collected. We applied the multi-peak Gaussian waveshape fitting with absorbance curve. The calculated δ13CH4 are plotted in Figure 9A with standard deviation of 0.95‰ at update time of 2 s. Allan analysis of δ13CH4 measurement in long-term test gives the limit standard deviation is 0.14‰ (@135 s) (Figure 9B).
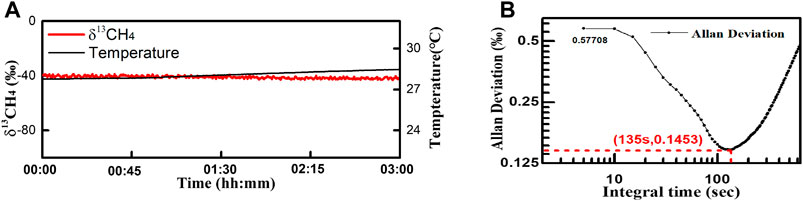
FIGURE 9. (A) Long term test of δ13CH4 and (B) Allan analysis.
Conclusion
We proposed and implemented a rugged two-section laser driving TDLAS system in which a broad tuning NIR DFB laser was used to cover spectra lines for both isotope molecules. Isotope spectra lines with same lower energy levels were selected to derive the 13CH4 and 12CH4 concentrations. In addition to dynamic pressure broadening linewidth, various uncontrollable factors such as spectra shift, stretching, and trending were addressed in the comprehensive multi-peak absorbance curve fitting by introducing the corresponding terms.
The δ13CH4 uncertainty in the temperature test was 2.8‰ with fitted δ13CH4 - temperature slope of 0.021‰/°C in 25 ± 5°C range. The δ13CH4 uncertainty in the pressure test was 1.4‰ with fitted δ13CH4 - pressure slope of <0.001‰/mbar from 400 to 1000 mbar. The limit standard deviation of long-term test was 0.15‰ (@135 s). The δ13CH4 precisions of a few research groups were better. But their apparatuses were more complicated and delicate mainly due to stringent requirement of pressure and temperature control. Our NIR TDLAS scheme is a promising solution for δ13CH4 measurement during drilling operations.
Data Availability Statement
The original contributions presented in the study are included in the article/Supplementary Material, further inquiries can be directed to the corresponding author.
Author Contributions
Writing—original draft preparation, GL; writing—review and editing GL and QJ; methodology, CH; software, KM; data curation,YJ and WJ; All authors have read and agreed to the published version of the manuscript.
Funding
This work was supported by National key Research and development programs (No. 2020YFB0408402), key R&D program of Shandong Province (No. 2019GHY112084 and 2019GGX104103), the Fundamental Research Funds for the Central Universities (No. 19CX02045A), National Natural Science Foundation of China (No. 41704124).
Conflict of Interest
The authors declare that the research was conducted in the absence of any commercial or financial relationships that could be construed as a potential conflict of interest.
References
1. Bastviken D, Tranvik LJ, Downing JA, Crill PM, Enrich-Prast A Freshwater methane emissions offset the continental carbon sink. Science (2011) 331:50. doi:10.1126/science.1196808
2. Turnbull JC, Karion A, Fischer ML, Faloona I, Lehman SJ, Miller BR, et al. Assessment of fossil fuel carbon dioxide and other anthropogenic trace gas emissions from airborne measurements over Sacramento, California in spring 2009. Atmos Chem Phys (2011) 11:705–21. doi:10.5194/acp-11-705-2011
3. Graham WM, Condon RH, Carmichael RH, D’Ambra I, Patterson HK, Linn LJ, et al. Oil carbon entered the coastal planktonic food web during the Deepwater Horizon oil spill. Environ Res Lett (2010) 5:045301. doi:10.1088/1748-9326/5/4/045301
4. Mohn J, Werner RA, Buchmann B, Emmenegger L High-precision δ13 CO2 analysis by FTIR spectroscopy using a novel calibration strategy. J Mol Struct (2007) 834:95–101. doi:10.1088/1748-9326/5/4/045301
5. Cao JJ, Chow JC, Tao J, Lee SC, Watson JG, Ho KF, et al. Stable carbon isotopes in aerosols from Chinese cities: influence of fossil fuels. Atmos Environ (2011) 45:1359–63. doi:10.1088/1748-9326/5/4/045301
6. Zhang K, Meng ZP, Wang XM Distribution of methane carbon isotope and its significance on CBM accumulation of No.2 coal seam in Yanchuannan CBM block, Ordos Basin, China. J Pet Sci Eng (2019) 174:92–105. doi:10.1088/1748-9326/5/4/045301
7. Li Y, Tang DZ, Fang Y, Xu H, Meng Y Distribution of stable carbon isotope in coalbed methane from the east margin of Ordos Basin. Sci China-Earth Sci (2014) 57:1741–8. doi:10.1007/s11430-014-4900-x
8. Li GL, Dong ET, Ji WH A near-infrared trace CO2 detection system based on an 1,580 nm tunable diode laser using a cascaded integrator comb (CIC) filter-assisted wavelength modulation technique and a digital lock-in amplifier. Front Phys (2019) 7:199. doi:10.3389/fphy.2019.00199
9. Centeno R, Mandon J, Cristescu SM, Harren FJM Three mirror off axis integrated cavity output spectroscopy for the detection of ethylene using a quantum cascade laser. Sensors Actuators B-Chem (2014) 203:311–9. doi:10.1016/j.snb.2014.06.122
10. Zheng K, Zheng C, He Q, Yao D, Hu L, Zhang Y, et al. Near-infrared acetylene sensor system using off-axis integrated-cavity output spectroscopy and two measurement schemes. Opt Express (2018) 26:26205–16. doi:10.1364/OE.26.026205
11. Leen JB, Yu XY, Gupta M, Baer DS, Hubbe JM, Kluzek CD, et al. Fast in situ airborne measurement of ammonia using a mid-infrared off-axis ICOS spectrometer. Environ Sci Technol (2013) 47:10446–53. doi:10.1021/es401134u
12. Mchale LE, Hecobian A, Yalin AP Open-path cavity ring-down spectroscopy for trace gas measurements in ambient air. Opt Express (2016) 24:5523–35. doi:10.1364/OE.24.005523
13. Nixon CA, Temelso B, Vinatier S, Teanby NA, Bézard B, Achterberg RK, et al. Isotopic ratios in Titan’s methane: measurements and modeling. Astrophys J (2012) 749:159. doi:10.1088/0004-637X/749/2/159
14. Chen Y, Lehmann KK, Kessler J, Lollar BS, Couloume GL, Onstott TC Measurement of the 13 C/12 C of atmospheric CH4 using near-infrared (NIR) cavity ring-down spectroscopy. Anal Chem (2013) 85:11250–7. doi:10.1021/ac401605s
15. Witinski MF, Sayres DS, Anderson JGHigh precision methane isotopologue ratio measurements at ambient mixing ratios using integrated cavity output spectroscopy. Appl Phys B (2011) 102:375–80. doi:10.1007/s00340-010-3957-2
16. Liu W, Tang M, Liu L, Lu X, Luo C Analysis and simulation of extracting radar modulation signal based on CIC filter. IOP Conf Series: Mater Sci Eng (2019) 569:032058. doi:10.1088/1757-899X/569/3/032058
17. Trudeau M, Chen P, Garcia G, Hollberg LW, Tans PP Stable isotopic analysis of atmospheric methane by infrared spectroscopy by use of diode laser difference-frequency generation. Appl Opt (2006) 45:4136–41. doi:10.1364/AO.45.004136
18. Abe M, Kusanagi S, Nishida Y, Tadanaga O, Takenouchi H, Sasada H Dual wavelength 3.2-μm source for isotope ratio measurements of 13CH4/12CH4. Opt Express (2015) 23:21786–97. doi:10.1364/OE.23.021786
19. Zhang Z, Pang T, Sun P, Xia H, Li Z, Yu R, et al. Measurement of carbon isotope of methane and analysis of its genesis type using laser absorption spectroscopy. Chin J Lasers (2019) 46:1211001. doi:10.3788/CJL201946.1211001
Keywords: TDLAS, pressure insensitive, temperature insensitive, isotope ratios, two-section driving, multi-peak fitting
Citation: Li G, Jiang Q, Hua C, Ma K, Jiao Y and Ji W (2021) Temperature and Pressure Insensitive Spectroscopic Method for Measuring 13CH4 during Oil and Natural Gas Drilling Operations. Front. Phys. 9:633012. doi: 10.3389/fphy.2021.633012
Received: 24 November 2020; Accepted: 26 January 2021;
Published: 11 March 2021.
Edited by:
Huadan Zheng, Jinan University, ChinaReviewed by:
Khoi Tan Nguyen, Vietnam National University, VietnamAiran Rodenas, University of La Laguna, Spain
Copyright © 2021 Li, Jiang, Hua, Ma, Jiao and Ji. This is an open-access article distributed under the terms of the Creative Commons Attribution License (CC BY). The use, distribution or reproduction in other forums is permitted, provided the original author(s) and the copyright owner(s) are credited and that the original publication in this journal is cited, in accordance with accepted academic practice. No use, distribution or reproduction is permitted which does not comply with these terms.
*Correspondence: Guolin Li, bGlndW9saW5AdXBjLmVkdS5jbg==