- 1N. M. Emanuel Institute of Biochemical Physics, RAS, Moscow, Russia
- 2Faculty of Biology, M. V. Lomonosov Moscow State University, Moscow, Russia
Hydrated fullerene C60 (HyFn) is a supramolecular object in which the nanosized fullerene molecule is enclosed in a multilayer shell of water molecules. Despite the fact that fullerene C60 is chemically rather inert, aqueous solutions of HyFn exhibit a wide spectrum of biological activity in particular in low and ultra-low concentrations. Thus, physical and chemical properties of aqueous solutions of HyFn in a wide range of its dilutions are of interest. Here we compared some physical and chemical properties of aqueous systems prepared by successive 100-fold dilutions of HyFn (10–7 M) with deionized water, with their intensive shaking at each stage up to the calculated HyFn concentration of 10–31 M and of the corresponding “dilutions” of deionized water prepared in the same manner (controls). We studied the character of рН changes in dilutions when titrating them with HCl and NaOH. It turned out that HyFn dilutions had significantly higher buffering capacity against acidification with HCl than control water “dilutions.” At the highest acidity reached pH in all HyFn dilutions was almost 0.3 units higher than in the respective controls. Average buffering capacity of HyFn dilutions and water controls when titrated with NaOH did not differ. However, differences in buffering capacity could be seen between consecutive dilutions of HyFn at their titration either with NaOH or with HCl. Most prominent differences were observed between consecutive HyFn dilutions in the range of calculated concentrations 10–17–10–31 M titrated with NaOH while no significant differences in pH between equivalent “dilutions” of control water were observed. Similar though less prominent variations in buffering capacity between consecutive HyFn dilutions titrated with HCl were also noticed. Thus, titration with an acid and especially with an alkali made it possible to reveal differences between individual dilutions of HyFn, as well as differences between HyFn dilutions and corresponding dilutions of water. These features may be due to complexity in the structural properties of aqueous systems, which, supposedly, can arise due to the emergence of heterogenous aqueous regions (“clouds”) in the course of their dilutions with intensive mixing at each stage. In order to find out if such heterogeneity is a characteristic for HyFn dilutions we used the method of drying microsphere-containing droplets, whose aqueous base were either HyFn dilutions in the range of calculated HyFn concentration 10–7–10–31 M or respective water controls. It was found that a significant part of HyFn dilutions is characterized by mesoscopic heterogeneity. It showed up by the tendency of microspheres to concentrate in a specific way resembling ornaments once the droplets had dried. As the degree of HyFn dilution increased, the number of dried droplets with an ornament-like microsphere distribution increased. Same was also observed in water control drops. However, for the dilutions of HyFn equivalent to concentrations 10–19–10–31 M the percentage of complexly structured dried up droplets reached 60–80%, while for dried out drops of respective water controls it did not exceed 15–20%. Thus, the physicochemical properties of high dilutions of hydrated fullerene differ not only from each other dependently on the dilution level, but also from those of high dilutions of water, which can be explained by the structuredness and heterogeneity of these aqueous systems. Therefore, upon dilution process the properties of the solutions change according to complex and non-linear laws so that final dilutions cannot be identical in their properties and features to those of the initial solutions (before dilutions process) and to the untreated water. Dilution process, in view of the aforementioned, should not be underestimated when analyzing properties of the solutions, having shown to be able to affect dramatically properties of the solutions.
Introduction
Fullerenes—the unique allotropic form of carbon were discovered in 1985 [1]. These molecules represent closed 3-dimensional ball-like structures. The most stable form of fullerenes containing 60 carbon atoms (C60), resembles a soccer ball, made of twenty hexagons and twelve pentagons. Each carbon atom in C60 is bonded with three other carbon atoms, and formally the fullerene contains double bonds. All these bonds are conjugated and C60 molecule exhibits a certain degree of aromatic character. C60 fullerene molecules behave chemically and physically as electron-deficient alkenes rather than electron rich aromatic systems [2]. Due to its unique structural properties C60 can behave both as an electron acceptor–an antioxidant and as a prooxidant–generator of superoxide anion radical and of singlet oxygen [3]. As an antioxidant fullerene C60 can bind up to six electrons, for which it was characterized as a “free radical sponge” [4]. Fullerenes absorb light efficiently in the ultraviolet and moderately in the visible regions of the spectrum. When C60 is exposed to light, it may behave as a prooxidant: electrons are pushed to a higher energy level, resulting in an excited singlet C60 state reacting with an oxygen molecule to form singlet oxygen (1O2), a strong oxidizer. Fullerenes are very efficacious generators of singlet oxygen with a quantum yield of 1O2 close to one [5].
However due to very low solubility of fullerenes in inorganic and even in most organic solvents it is difficult to employ these properties of native fullerenes in most prospective studies for example in biomedical research. Solubility of C60 in water was estimated to be as low as 10–11 ng/L, equivalent to few C60 molecules per milliliter of water [6]. That means that at higher concentrations fullerene molecules stick to each other forming aggregates with indefinite properties. To overcome this problem several approaches have been developed for the transfer of fullerenes into water. They included chemical modification of fullerenes by attachment to fullerene molecules of various hydrophilic functional groups, such as–OH, –COOH, –NH2 or more complex radicals, usage of detergents or incorporation of fullerenes into caging supramolecular structures such as cyclodextrins, long-term stirring of pristine fullerenes in water, and solvent exchange method implying the extraction of fullerenes dissolved in a nonpolar solvent such as toluene to water using ultrasonic treatment of their mixture (for the recent review of these methods and properties of dissolved fullerenes see [7]). Fullerenes transferred to water form colloid solutions though differing in the dimensions of colloidal particles with diameters ranging from ∼10 to 500 nm dependent on the method of their solubilization in water. In other words, they represent nanoparticles dissolved in water.
Fullerenes transferred to water in various ways exhibit a wide range of biological activity. For example, polyhydroxylated derivatives of fullerenes, fullerenols, are able to scavenge free radicals similar to pristine fullerenes [8]. They are very promising for use as pharmacological agents in chemotherapy, treatment of neurodegenerative diseases, and radiobiology [9]. Currently, there is an extensive literature on the biological activity of various water-soluble fullerene derivatives (for the reviews see [10, 11]). However, fullerene derivatives including fullerenols have some disadvantages–their structure may be not precisely defined, and undefined variations in their structure may unpredictably influence their activity [12]. In addition, any changes in the outer carbon shell of a fullerene molecule leads to a violation of the electronic structure and symmetry of this most symmetrical molecule of all known ones, which in turn changes the specificity of its interaction with the medium. Therefore, the biological effect of artificially transformed fullerene molecules largely depends on the nature of the grafted chemical residues.
Taking this into account, it seems more attractive to use pristine fullerenes introduced into the water in one way or another because the most striking originality of fullerene molecules is shown in the unmodified and non-aggregated state, for example, in the form of their molecular solutions in water. One of the procedures of obtaining aqueous solutions of nonmodified fullerenes is exchange of the solvent in which fullerene is soluble (tetrahydrofuran, toluene, benzene) for water. Among these methods one of the mostly widely used is the one suggested by G. Andrievsky et al. in 1995 [13]. According to this method fullerene C60 is dissolved in toluene, this solution is mixed with water and the suspension is treated with ultrasound until the organic solvent is fully evaporated and C60 molecules become hydrated. This procedure allowed to obtain fullerene aqueous solutions in which concentration of dissolved hydrated fullerene C60 (HyFn) could reach millimolar range, and such solutions did not lose their stability for several years. Physical chemical properties of such preparations were studied in sufficient details [13–16]. Solutions of HyFn represent molecular-colloid system, containing both single hydrated fullerene C60 molecules and their fractal clusters in a hydrated state.
According to data obtained using dynamic light scattering, small-angle neutron scattering, low temperature differential scanning calorimetry, electron microscopic and other analytical methods Andrievsky and collaborators suggested that a hydrated C60 molecule represents a supramolecular complex in which C60 molecule is covered by a hydration shell. The primary shell closest to C60 molecule consists of 20–24 water molecules that are interconnected to each other and are held on C60 surface by weak electron donor-acceptor interactions between unpaired electrons of oxygen atoms of H2O (the donor) and fullerene molecule (the acceptor). The primary shell is hydrated by additional water layers whose number may be large enough. Water is hold by fullerene so tightly that it is not lost from HyFn even in vacuum of 10–5 Torr [16]. HyFn is negatively charged [17] and the negative charge of the aqueous envelope of these molecules brings out the fact that HyFn cannot be extracted by toluene from their solutions [14]. At high HyFn concentrations they associate into spherical clusters containing up to 13 hydrated C60 fullerenes. In such a cluster HyFn do not attach each other directly because they are covered with water shells. Upon dilution the clusters dissociate up to formation of solutions consisting from single HyFn nanoassociates that base on dynamic light scattering data become covered with a multilayered ordered water shell. The diameter of this complex reaches 80 or more nm [18].
A great deal of information is accumulated concerning biological effects of pristine fullerenes transferred to water, in particular of HyFn which unlike some other fullerene preparations solubilized using for example tetrahydrofuran [19] have not revealed any toxic effects. On the contrary HyFn showed only positive biological effects in various in vitro (on cellular models) and in vivo experiments [18, 20, 21]. Such beneficial activity of HyFn can be related to the lack of the pro-oxidant activity of these particles because HyFn–C60 molecules surrounded with water shells cannot directly bind and activate oxygen converting it into singlet oxygen or reducing it into superoxide radical, but they show strong antioxidant activity exceeding such activity of many low molecule weight antioxidants. In particular some fullerene C60 derivatives possessed superoxide dismutase mimetic properties [22, 23], that is unlike “common” chemical antioxidants they eliminate superoxide radicals catalytically.
Especially intriguing results were obtained in the studies of the effects of HyFn on removal of hydroxyl radicals (OH•) from water irradiated with X-rays [24]. Paradoxically, the lower HyFn concentration in the range of 10–6–10–11 M the higher its OH•-removing efficacy. Indeed, if at HyFn concentration 10–6 M a pair of OH• radicals was eliminated per each fullerene molecule, at HyFn concentration 10–11 M more than 104 radicals could be neutralized by each HyFn particle. Notably, HyFn had a tendency to eliminate hydroxyl radicals even in dilutions equivalent to its concentrations 10–13 M. It was hypothesized that the antiradical action of HyFn in water generally is due to a “nonstoichiometric” mechanism, supposedly to a hydrated free radical recombination (self-neutralization), which is catalyzed by specific water structures ordered by HyFn.
This study is not the isolated example of the pronounced and sometimes paradoxical effects of water-soluble fullerenes on biological and physicochemical test-systems. When the effect of HyFn on blood plasma clot lysis under the action of tissue plasminogen activator (t-PA) was studied it was shown that preincubation of t-PA in the presence of ultra-low concentration of HyFn (down to 10–14 M) resulted in 2.7-fold increase of the lysis rate of a blood plasma clot and in 1.6-fold decrease of half-lysis time [25]. Here the t-PA concentration (about10–10 M) exceeded content of HyFn by 2–4 orders of magnitude. Therefore, it is not possible to explain the acceleration of blood plasma clot cleavage by formation of binary HyFn–t-PA complexes. It is also unlikely that the formation of the complex of a single HyFn particle with t-PA molecule could increase its catalytic activity by 2–4 orders of magnitude.
We demonstrated that HyFn in concentrations below 10–9 M down to 10–23 M stabilized peroxidase, alkaline phosphatase and bacterial luciferase against inactivation due to long-term incubation of the enzymes at room temperature and also against heat inactivation. Besides HyFn in low and ultra-low concentrations revives heat inactivated enzymes [26]. Here again it was noted that the efficacy of HyFn increases with increasing degree of dilution. These effects cannot be explained by the direct action of the fullerene molecules upon the enzymes. Fullerenes solubilized in water by other methods and also fullerenols demonstrated significant antioxidant effects in low and ultra-low concentrations in other biological and chemical test systems. For example, in the study of antioxidant effects of two types of fullerenols in bacteria-based and enzyme-based assays it was shown that they are active in a range of concentrations–from 10–8 M to 10–20 M, and no monotonic dependences of their effects on fullerenol concentrations was observed [27, 28]. Biological efficiency of ultra-low concentrations (down to 10–18 M) of solubilized fullerenes was demonstrated on a bacterial bioluminescent biosensor [29]. HyFn attenuated intensity of luminol-dependent chemiluminescence of whole human blood in which respiratory burst was induced in ultra-low concentration equivalent to 10–19 M [30]. In the same ultra-low concentration (10–19 M) HyFn inhibited cell proliferation and accelerated the process of “stationary phase aging” of transformed B11-dii FAF28 Chinese hamster cells in the cell culture. Moreover, secondary addition of HyFn aqueous solution at this calculated concentration to the cells that had already reached the stationary phase of growth caused a rapid (within no more than 24 h) death of a significant part of the cell population [31].
However, there are practically no studies of the physical and chemical properties of solutions containing HyFn in low and ultra-low concentrations in the literature. Given that C60 is not very active chemically and that in HyFn this molecule is surrounded by a water shell, it could be suggested that the entire pattern of HyFn activity is due to unique properties of the water shell formed around C60 and that the observed features of HyFn at ultra-low concentration may be determined by some special changes in aqueous systems that originate in the course of dilution of aqueous fullerene solutions in which fullerene molecules modify water that surrounds them. To expand understanding of mechanisms of HyFn action here we compared some physical and chemical properties of aqueous systems prepared by successive dilutions of HyFn (10–7 M) with deionized water up to the calculated HyFn concentration of 10–31 M and of the corresponding “dilutions” of deionized water prepared in the same manner (controls). We studied the character of рН changes in dilutions when titrating them with HCl and NaOH and also the degree of heterogeneity of aqueous systems obtained by serial dilutions of HyFn solutions that may reflect their specific structuring using drop evaporation method. Curious differences between individual dilutions of HyFn, as well as differences between HyFn dilutions and corresponding dilutions of water even in the highest dilutions were revealed using both approaches.
Materials and Methods
Method of Serial HyFn Dilution in Water
Deionized water (Millipore Milli-Q Academic) with electrical conductivity of 0.45 μS/cm was used for 2 days after its production. The initial concentration of HyFn (IPACOM, Kharkiv, Ukraine) was 2 × 10⁻⁴ M. The concentration was confirmed spectrophotometrically at the maximum of the absorption band at 343 nm with the molar extinction coefficient of 68,000 L × M−1 × сm−1 [14]. The volume of 100 μL of the concentrated solution was added using an automatic pipette with a plastic tip into a 2 ml Eppendorf plastic tube to 1.9 ml of purified water to obtain a HyFn concentration of 1 × 10⁻⁵ M. The resulting preparation was slightly shaken in hands and left at room temperature in a dark room for 40 min. Then, 1 ml of 1 × 10⁻⁵ M HyFn was introduced into two dark glass flasks containing 9 ml of purified water. Thus, 2 samples of 1 × 10⁻⁶ M HyFn were obtained. These flasks were tightly covered with Parafilm, slightly shaken in hands and left in the dark for 40 min. All further dilutions were stored in 15 ml dark glass flasks. For the preparation of 1 × 10⁻⁷ M HyFn, 1 ml from each of the previous samples was added to two flasks with 9 ml of purified water, then it was slightly shaken in hands and left in the dark for 40 min. For the preparation of 1 × 10⁻⁹ M HyFn, 100 μL of 1 × 10⁻⁷ M HyFn was added to 9.9 ml of purified water. Hereinafter, only glassware was used for the preparation of HyFn dilutions according to [32] with modifications. Before use, glass flasks were rinsed with potassium dichromate solution and thoroughly rinsed in water for removal of all organic and inorganic contaminants. Starting from samples with HyFn concentration of 10–9 M, the resulting solutions were shaken on a vortex mixer at a speed of 3,000 rpm for 40 s in glass flasks and sealed with a film. Then the flasks were left in a dark room for 60 min. All further dilutions of HyFn up to 1 × 10–31 M were obtained using a similar procedure for preparing centesimal dilutions. Since the preparation of all series of samples would take about 13 h, the procedure was carried out in two days, when freshly prepared HyFn 1 × 10–15 M was left for 16 h before using it to obtain 1 × 10–17 M HyFn the next day.
In parallel with the preparation of HyFn dilutions, similar actions were carried out with water samples as controls, when there was a successive dilution of portions of water and subsequent stirring. The initial milliQ-water sample was parallel to and was mirroring the initial 2 × 10⁻⁴ M HyFn solution. Therefore, at the end of sample preparation there were test samples that were the result of series dilution of 2 × 10⁻⁴ M HyFn and control samples that were the result of series dilution of a pure milliQ-water sample that mirrored the actions taken when preparing test samples. The purity of the initial control water sample that was used in a series dilution was proved spectrophotometrically.
pH Measurements of HyFn and Control Water Dilutions
A series of HyFn dilutions were obtained in accordance with the technique described above with the only difference that the initial HyFn solution was a sample with a concentration of 2 × 10⁻⁵ M, and 1 × 10⁻⁶ M HyFn was obtained by preparing a 20-fold dilution of 2 × 10⁻⁵ M HyFn. pH was measured in 10 ml samples of HyFn dilutions or “diluted” water as control.
In the course of the work, pH values were measured once a day at the same time using a pH meter pH-150M, “Measuring Technique IT,” Russia with a resolution of ±0.05 pH units with a combined EKS-10603 electrode. The first pH value was obtained by pH measuring 60 min after the preparation of each dilution. For each sample, a separate measurement graph was drawn up depending on the preparation time. The samples were stored in a refrigerator at 7 °C, and 1 h before measurement they were placed at room temperature.
pH Measurements After Addition of Portions of Acid or Alkali
In another experiment, portions of a) 1 mM HCl, and b) 1 mM NaOH, 10 μL each, were successively added to samples of different dilutions of HyFn. At the time of addition of acid or alkali, the HyFn samples were placed on a magnetic stirrer with a submerged magnet. After adding a portion of acid or alkali, the magnet stirred the solution for 30 s, then the stirrer was turned off, and pH value was fixed at the moment of equilibrium. Then the next portion of acid or alkali was added. In total, 16 measurements were carried out for each sample of each of the 14 HyFn dilutions after addition of acid, and 16 graph points were obtained, including the zero point of the pH value before acid addition. The experiment was designed in such a way that successive addition of portions of HCl was repeated 6 times with parallel samples of all dilutions of HyFn. Moreover, there were 6 series of control water samples corresponding to all the 14 dilutions of HyFn. In the course of titration with alkali, 5 series of titrations of all HyFn dilutions and three series of titrations of control water “dilutions” were obtained.
At first, 2 series of HyFn dilutions and control water dilutions were prepared. Acid titration of these samples was carried out during the next 2 days. The unequal storage time of the different dilutions was neglected. Before titration, the samples were stored at room temperature in a dark room. The second pair of series of HyFn dilutions and control water dilutions were prepared a week after the first pair, and acid titration was performed on the next 2 days. The last pair of series of samples for titration with acid was prepared a week later.
Titrations with alkali were carried out afterward with the similar periodicity.
The statistical significance of differences in the experiments was calculated using the Mann-Whitney test.
Preparation of HyFn Dilutions for Dry Droplets Microscopy
For this part of the study 13 HyFn dilutions ranging from 1 × 10⁻⁷ M to 1 × 10–31 M were prepared by the method of successive diluting from the concentrated 2 × 10⁻⁵ M HyFn solution in 6 ml dark borosilicate vials. The final volume of each dilution was 5 ml. For 1 × 10⁻⁷ M HyFn preparation 1 × 10⁻⁵ M HyFn solution was diluted 100-fold when its 50 μL were added to 4.950 μL of water. The sample was vortexed for 30 s and left in a dark place for 40 min. In parallel, the similar routine was carried out with a control water sample, and it was “diluted” in a similar way. Afterward, 100-fold dilutions of HyFn and water were carried out to obtain all successive dilutions of HyFn and water as controls.
Dry Droplets Microscopy
The initial suspension of 1 μm latex microspheres (Interfacial Dynamics, Inc., Portland, OR) is white non-transparent dense liquid. This suspension was shaken to make particle distribution homogenous and 200 μL were taken with a pipette and diluted 2-fold with pure water. The resulting suspension was used for the addition to HyFn and control water samples. A precise quantity of microspheres is not important as an equal volume of the suspension was added to each HyFn and control water sample.
The day after all HyFn and control water dilutions were prepared, portions of microsphere suspension were added to them, and the solutions in samples went cloudy. Addition of microspheres to test and control dilutions took approximately 30 min. After 4 h, HyFn diluted solution or control water “dilutions” were taken from each vial using a glass syringe and applied to new glasses for microscopy (Thermo Scientific, Hungary) in the form of drops, 6 droplets per one glass. A total of 6 glasses were obtained for each dilution of HyFn and water.
After drying, the droplets were examined using a Jenaval microscope with ×40 magnification and Carl Zeiss optics. Using the built-in MDC200 camera, the image was transferred to a computer screen, where photographs of examples of dried droplets were taken for each dilution using the ScopeTech® software.
Results
Titration of HyFn Dilutions and Water “Dilutions” With Hydrochloric Acid
In total, 6 series of experiments on titration of HyFn dilutions and 6 series of experiments on titration of “dilutions” of water with HCl were carried out. Figure 1 shows examples of HCl titration curves of all dilutions of HyFn in series 1 and all “dilutions” of water of the same series, which were prepared on the same day and titrated two days afterward.
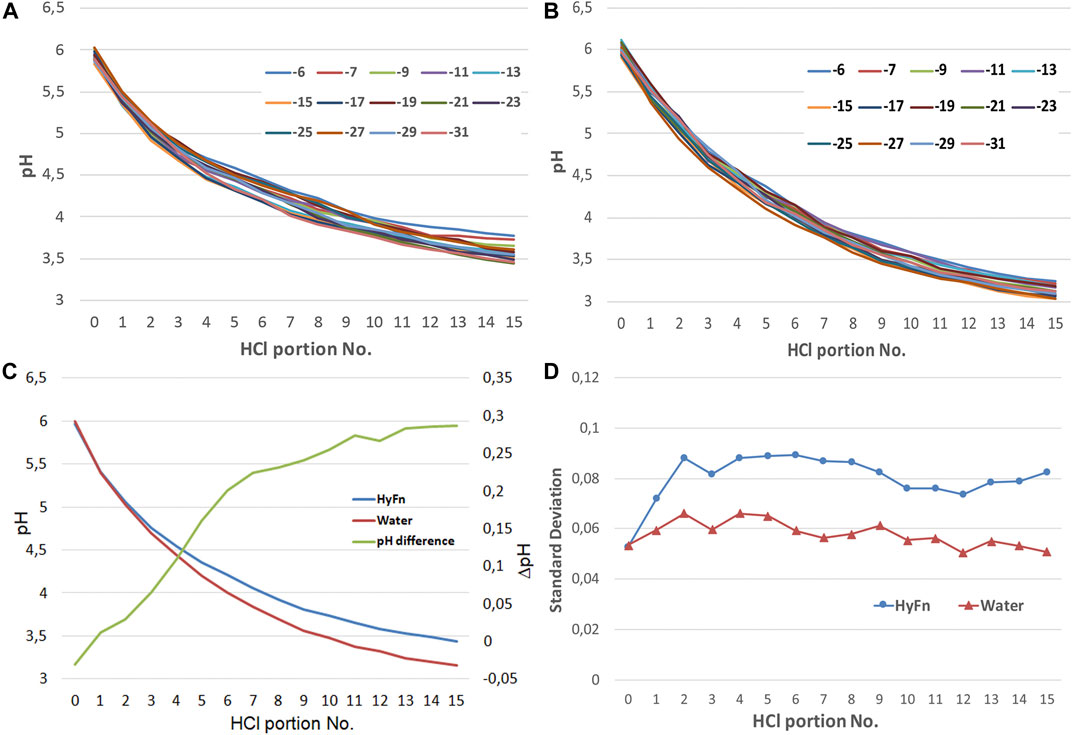
FIGURE 1. Typical examples of titration curves of series No 1 (out of 6) dilutions of HyFn (A) and “dilutions” of water (B) (from 10–7 to 10–31 M) with HCl. The abscissa axis represents numbers of the portions of HCl injections (10 μL each) added to the titrated samples, the ordinate is the pH value. Each line on (A, B) represents a particular dilution of HyFn or water dilution corresponding to calculated HyFn molar concentrations indicated in the plots as lg [HyFn] (C) Averaged titration curves of all HyFn dilutions (blue line) and water “dilutions” (red line) for all the series of experiments; green line: difference in pH values between HyFn dilutions and water “dilutions.” (D) Standard deviations from the mean pH values averaged over all series of experiments, varying during the titration of HyFn dilutions and water “dilutions” (from 10–7 to 10–31 M) with HCl.
As shown in Figure 1, at least 2 differences are observed between the sets of titration curves of HyFn dilutions and “dilutions” of water: first, with the same amount of HCl added to the titrated liquids, pH in the “dilutions” of water decreases to lower values than in HyFn dilutions; secondly, the “brush” of titration curves of HyFn dilutions looks “broader” than the “brush” of titration curves of water dilutions” (Figures 1A,B). The same differences are revealed when comparing other pairs of HyFn dilution series and water dilutions.” As it can be seen from Figure 1C, the difference between the averaged titration curves for the HyFn dilutions and water “dilutions” increase in the course of the titration and by the end of titration it reaches 0.3 pH units. This magnitude of the difference between HyFn and water dilutions tend to level off when pH values in HyFn dilutions and water “dilutions” drop to 3.5 and 3.2 respectively. It should be stressed that almost all dilutions of HyFn, ranging from 10–7 M to 10–31 M, have a higher buffering capacity against their acidification with HCl.
Standard deviations from mean pH values after acidification of the HyFn dilutions are significantly higher than those after acidification of water, although they are the same for initial HyFn solutions and the initial water “dilutions” (Figure 1D). This indicates that pH values in different HyFn dilutions differ from each other more than in titrated water “dilutions” after the addition of the same quantity of portions of HCl.
Changes in variability of pH in the sequences of HyFn dilutions and control water “dilutions” in the course of their acidification can be seen in Figure 2. It is evident that after adding the same portions of HCl to different HyFn dilutions or water “dilutions,” the pH values in them do not become the same, indicating that different dilutions differ in their buffering capacity. These differences display curious orderliness. For example, pH in 10–19 M HyFn and the corresponding potency of water decreases more slowly during the entire titration than in dilutions corresponding to 10–17 M indicating that buffering capacity in the former is higher than in the latter for both HyFn and water dilutions. One can notice that the difference in pH between these particular dilutions (10–17 M and 10–19 M) both of HyFn and water exists already in the initial samples to which no HCl was added (upper curves in Figures 2A,B), and it persists in the course of titrations. The differences in pH between other consecutive dilutions emerges in the course of titration with HCl and they are especially noticeable at high dilutions and at most acidic pH values. In this region, pH values in HyFn dilutions fluctuate more pronouncedly than in corresponding water “dilutions,” which makes the main contribution to the differences in standard deviations from the mean pH of HyFn dilutions (Figure 1D).
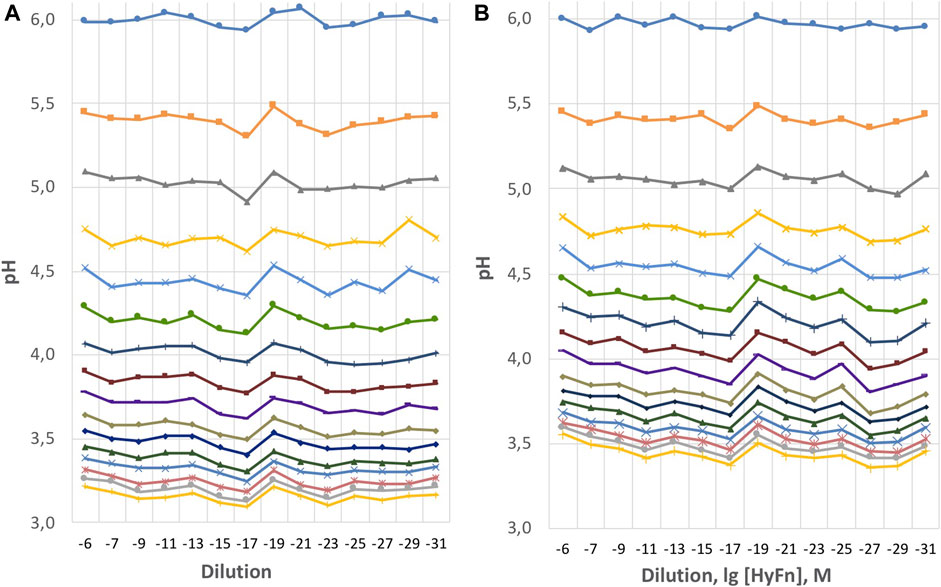
FIGURE 2. Variability of pH values in (A) “dilutions” of water and (B) HyFn dilutions during sequential titration of the samples. Average values for 6 series of samples are presented. Each horizontal line represents pH values in the dilutions after HCl injections were made. Successive injections are accompanied by increased acidification, and each next line is lower than the previous one. Abscissa depicts sequential dilutions of HyFn or of water “dilutions” corresponding to calculated lg [HyFn], M.
Data presented in Figure 3 where pH variability in the rows of HyFn and water dilutions after addition to each dilution ten portions of HCl illustrates these peculiarities more clearly. It can be seen from this Figure that after acidification of water “dilutions” by eight 10 μL injections of HCl pH value in for example 10–25 M “dilution” of water differs little from the pH values in neighboring “dilutions” (10–23 M and 10–27 M). On the contrary pH in 10–25 M HyFn dilution corresponding to this water “dilution” is noticeably higher than in HyFn dilutions corresponding to 10–23 and 10–27 M. When comparing pH values in dilutions prepared with intensive shaking (below 10–7 M), one can see both coincidences in the tendencies of pH changes at successive dilutions of HyFn and water (for example, the range from 10–13 to 10–23 M), as well as noticeable differences between them (range from 10–23 to 10–31 M), with the most striking difference between HyFn and control water at dilutions corresponding to 10–25 M. In higher dilutions (10–27–10–31 M), pH in HyFn dilutions differ from each other much more than in the corresponding “dilutions” of water acidified with the same amount of HCl.
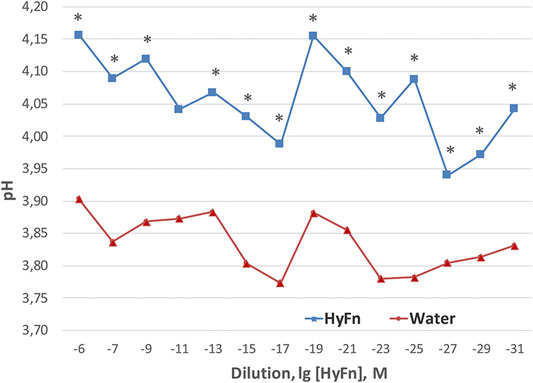
FIGURE 3. pH values in the series of HyFn dilutions and water “dilutions” after addition of eight 10 μL portions of HCl to each HyFn dilution and respective water “dilutions.” Each curve is an average over all 6 series of measurements. *p < 0.01 for the difference between HyFn dilutions and respective water “dilutions” according to Mann-Whitney U test. Abscissa depicts sequential dilutions corresponding to calculated lg [HyFn], M.
Titration of HyFn Dilutions and Water “Dilutions” With Sodium Hydroxide
In total, 5 series of titration experiments of HyFn dilutions and three series of titration experiments of “dilutions” of water with NaOH were carried out. The tendencies of pH changes in experimental and control groups differed in some respects, while in others they were similar to those that appeared when titrating the dilutions with HCl.
When comparing the set of titration curves of HyFn dilutions (Figure 4A) and the same set of titration curves of “dilutions” of water (Figure 4B) it can be seen that the “brush” of titration curves of HyFn dilution is much less compressed than the “brush” of titration curves of different dilutions of water. That means that the titration curves for different HyFn dilutions differ significantly more from each other than the titration curves for different “dilutions” of water. Indeed, the plot of standard deviations from the mean pH values for HyFn, averaged over all experimental series and dilutions (Figure 4D), lies significantly above the same plot for water. Moreover, the standard deviations for HyFn increase markedly with alkalization of the solutions, while for water, with the exception of a burst at the beginning of the titration, standard deviations from the mean pH values change much less during the alkalization. A significant difference in standard deviations from the average pH values in HyFn dilutions in comparison with water “dilutions” indicates of a strong non-uniformity of pH changes in different HyFn dilutions during their titration with the alkali. In this respect, the behavior of HyFn dilutions titrated with NaOH is similar to their behavior when titrated with HCl although standard deviations from the mean pH values for HyFn dilutions titrated with NaOH are markedly larger than for HyFn dilutions titrated with HCl and noticeably increase with the progressive alkalization of the HyFn dilutions (compare Figures 1D, 4D).
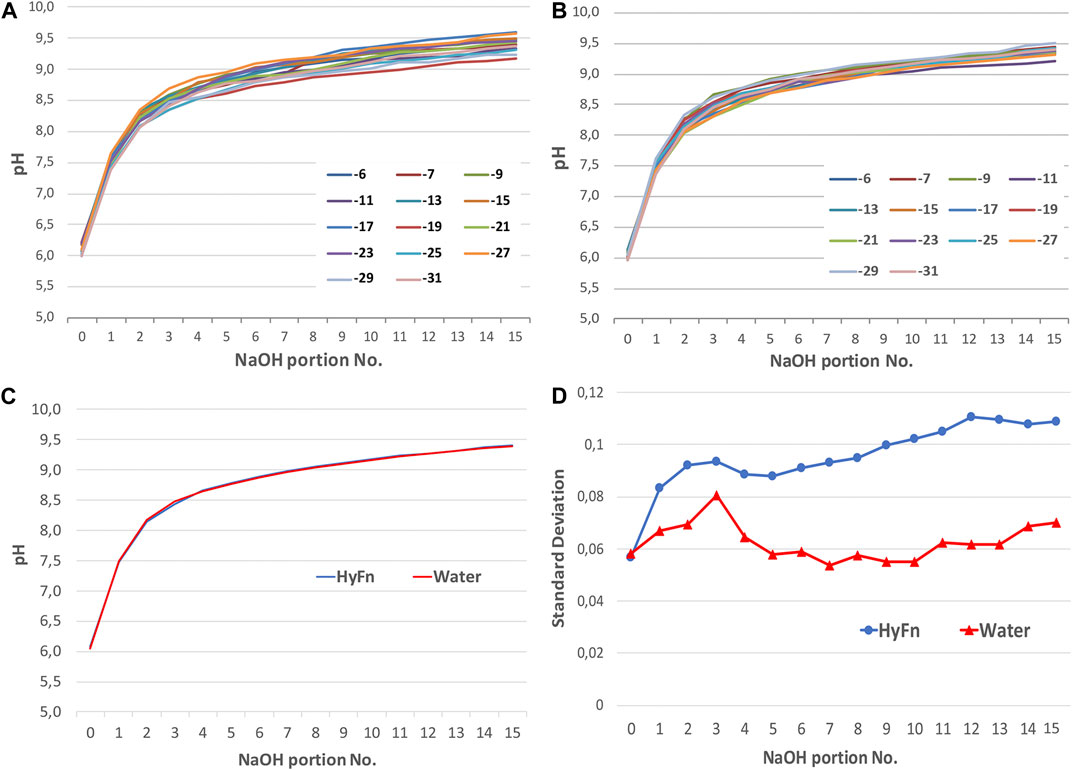
FIGURE 4. Typical examples of titration curves of (A) series No 2 (out of 5) of HyFn dilutions and (B) of series No 2 (out of 3) of “dilutions” of water (from 10–6 to 10–31 M) with NaOH. The abscissa represents numbers of the portions of NaOH (10 μL) added to the titrated samples, the ordinate is pH value. Each line on (A, B) represents a particular dilution of HyFn or water “dilution” corresponding to calculated HyFn molar concentrations indicated in the plots as lg [HyFn], M. (C) Averaged titration curves of all HyFn dilutions and water “dilutions” for all series of experiments. (D) Standard deviations from the mean pH values averaged over all series of experiments, varying during the titration of HyFn dilutions and water “dilutions” (from 10–7 to 10–31 M) with NaOH.
On the other hand, NaOH titration curves of HyFn dilutions and water “dilutions,” averaged over all HyFn dilutions and over all water “dilutions,” exactly coincided (Figure 4C). This means that average buffering capacity of experimental and control dilutions are the same, whereas during the titration with HCl significant difference between the buffering capacity of HyFn dilutions and water dilutions were revealed (see the previous section).
Changes in variability of pH in the sequences of HyFn dilutions and control water “dilutions” in the course of their alkalization can be seen in Figure 5. With the successive addition of NaOH to HyFn dilutions and water “dilutions,” pH values in both groups of samples shift to an increasingly alkaline region (the curves shift from bottom to top of the plots). Mean pH values for all HyFn dilutions and respective water “dilutions” are practically the same, but with an increase of alkalization, especially when the pH approaches 9 and exceeds it, the curves characterizing the dependence of pH on dilution for HyFn dilutions become more and more “serrated,” while the corresponding curves for the potency of water becomes even smoother than the curves characteristic of the initial stages of titration. This indicates that different HyFn dilution especially in the range of ultra-high dilutions differ significantly in their buffering capacity against alkalization while the respective control “dilutions” of water do not differ in their buffering capacity.
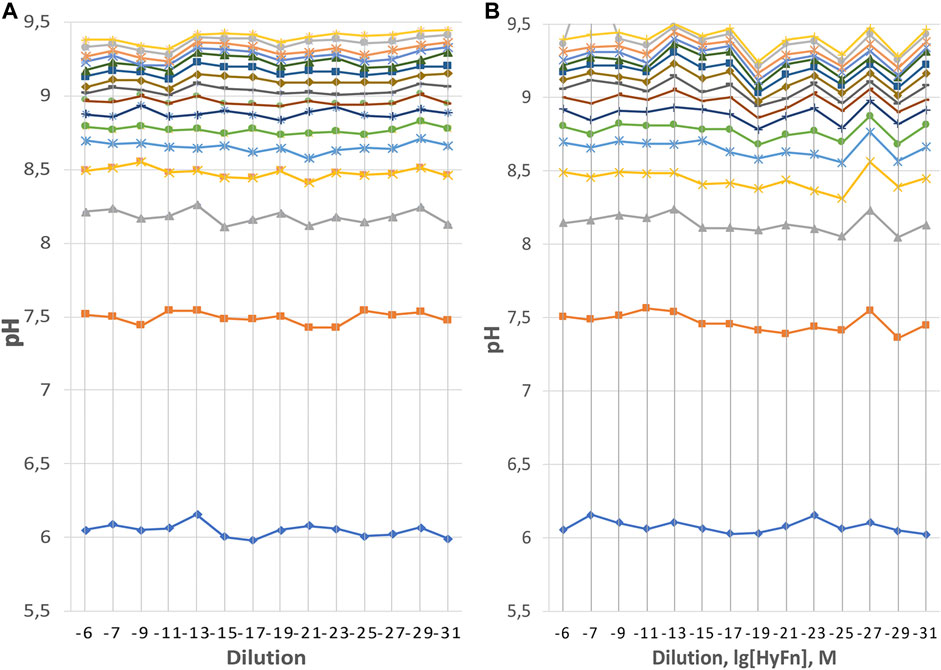
FIGURE 5. Variability of pH values in (A) “dilutions” of water and (B) HyFn dilutions during sequential titration of samples with NaOH. Average values for all the series of samples are presented. Each horizontal line represents pH values in the dilutions after 10 μL NaOH injections were made. Successive injections are accompanied by increased alkalization, and each next line is higher than the previous one. The lowest lines in (A, B) are pH values in dilutions before the addition of NaOH. Abscissa depicts sequential water “dilutions” corresponding to calculated lg [HyFn], M, or of HyFn dilutions.
In Figure 6, for clarity, the curves corresponding to pH values in the HyFn dilutions and in water “dilutions” after the 15th NaOH injection are presented in one graph. At this final stage of titration, mean pH values for all dilutions of both HyFn and water was 9.40 (averaging was also carried out over all 5 series of HyFn dilutions and three series of water “dilutions”). There are significant differences between pH in neighboring dilutions of HyFn, but not in the “dilutions” of water. For example, buffering capacity against alkalization in 10–19 M, 10–25 M and 10–29 M HyFn dilutions is much lower than in the 10–17 M, 10–21 M, 10–23 M, 10–27 M and 10–31 M dilutions and these differences are highly statistically significant. At the same time such differences between different “dilutions” of water, especially in the region below 10–17 M are not observed.
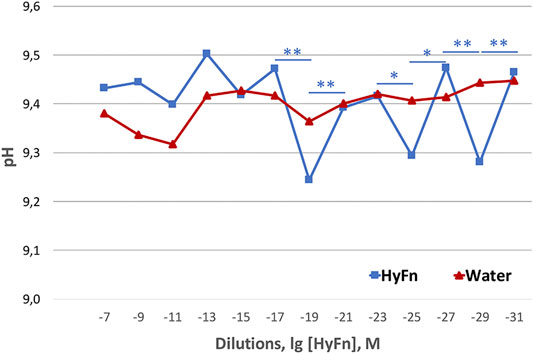
FIGURE 6. Averaged over all experimental series pH values in HyFn dilutions (blue curve) and “dilutions” of water (red curve) after the 15th NaOH injection into HyFn dilutions samples and corresponding water “dilutions” samples. Red line indicates control water “dilutions,” and blue line–dilutions of HyFn. Abscissa depicts sequential dilutions corresponding to calculated lg [HyFn], M. Blue bars above the blue curve designate statistically significant differences of pH values in neighboring HyFn dilutions according to Mann-Whitney U test: **p < 0,01; *p < 0,05.
Figure 5 also shows that there is a correlation in the variations in pH values between HyFn dilutions and the corresponding water “dilutions.” So, in the range of “dilutions” of water 10–7–10–17 M and equivalent dilutions of HyFn, pH values vary more or less synchronously. Mean correlation coefficient (±SD) between 2 rows of data in this range of dilutions is 0.7 ± 0.15. In the range of higher HyFn dilutions and “dilutions” of water, synchronicity is no longer detected, in particular, due to the fact that pH values in water samples with high “dilutions” differ little from each other. Mean correlation coefficient (±SD) between 2 rows of data in the range of dilutions from 10–19 to 10–31 is 0.18 ± 0.31.
Dry Droplets Microscopy
The above described properties of HyFn dilutions and of the respective water controls may reflect the complexity in the structural properties of aqueous systems, which, supposedly, can arise due to the emergence of heterogenous aqueous regions in the course of their dilutions with intensive agitation at each stage. In order to find out if such heterogeneity or structuredness is characteristic for the studied preparations, we used the method of drying microsphere-containing droplets, whose aqueous bases were either HyFn dilutions in the range of calculated HyFn concentration 10–7–10–31 M or respective water controls. This method allows, although not too quantitatively, to assess the degree of aqueous systems heterogeneity (structuredness).
Immediately after the droplets are applied to the slides, the microspheres are distributed randomly. However, after water evaporation, areas with non-uniformly distributed microspheres could be found in many samples. The dried droplets can be divided into those where the microspheres are located fairly evenly and those where areas of their accumulation are found, or there is a certain order in their arrangement that is different from uniformity.
Microscopic pictures of the examples of images of microspheres distribution that appear on glass after drying of droplets prepared from HyFn dilutions, “dilutions” of water and of control unstirred water are presented in Figures 7–12. In Figure 7 there are 2 examples of dried unstirred water droplets with microspheres. It is seen that after drying microspheres gather near the boundary of a droplet leaving its center clear. These pictures differ significantly from the following that are characteristic for the droplets obtained from HyFn dilutions and control water “dilutions.” A common feature of drops from HyFn dilutions is that microspheres in them are more often distributed unevenly and tend to concentrate in one place, surrounded with wave-like patterns composed of microspheres in circular or semi-circular arrays (Figure 8-left, upper rows in Figures 9–12). In dried out droplets of respective control water “dilutions” microspheres are more often distributed more evenly (Figure 8-right, lower rows in Figures 9–12) and less often there is an area of their increased accumulation (Figure 10, lower row, right picture). The contrast in microspheres arrangement is well seen in comparison of dried out HyFn dilutions and water “dilutions” in the presented here images in Figure 10: upper row vs. lower row (10–19 M) and Figure 12: upper row vs. lower row (10–31 M). In a number of cases, certain structuring in the distribution of microspheres was also found in some drops from the control water “dilutions” but the appearance of structures was different from those typical for the respective HyFn dilutions.
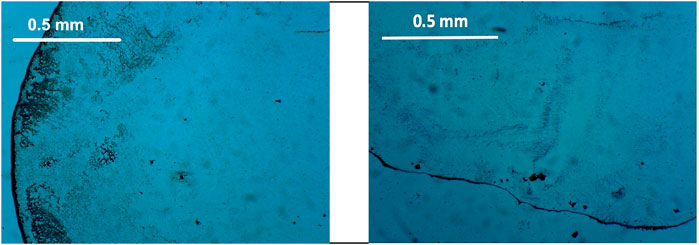
FIGURE 7. Two examples of microscopic pictures of the accumulation of microspheres in dried droplets of unstirred water.
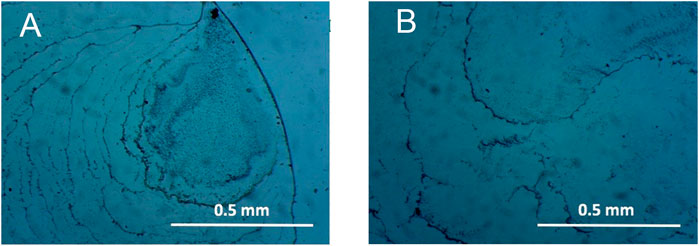
FIGURE 8. Examples of photos of the accumulation of microspheres in dried droplets in 1 × 10⁻⁷ M HyFn (left, (A) and water potency 1 × 10⁻⁷ M (right, (B).
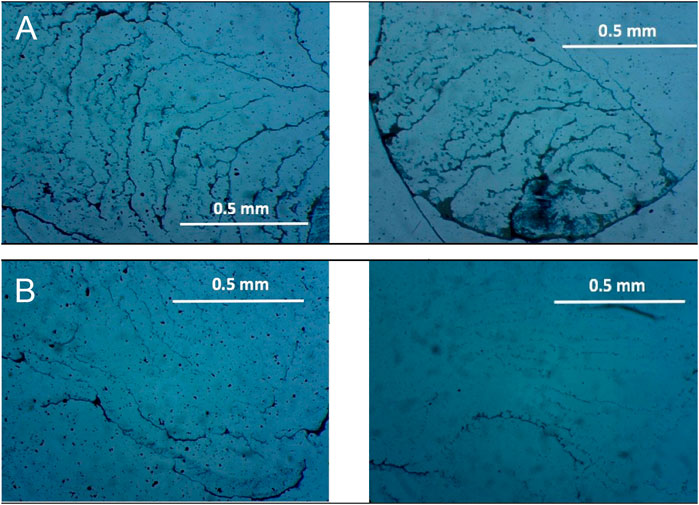
FIGURE 9. Examples of photos of the distribution of microspheres in dried droplets in 1 × 10⁻⁹ M HyFn dilution (upper row, (A)) and of microsphere distribution in dried water “dilutions” drops, corresponding to a dilution of 1 × 10⁻⁹ M (lower row, (B)). Only 2 of 36 drops obtained from this water “dilution” contain structures similar to those shown in (A).
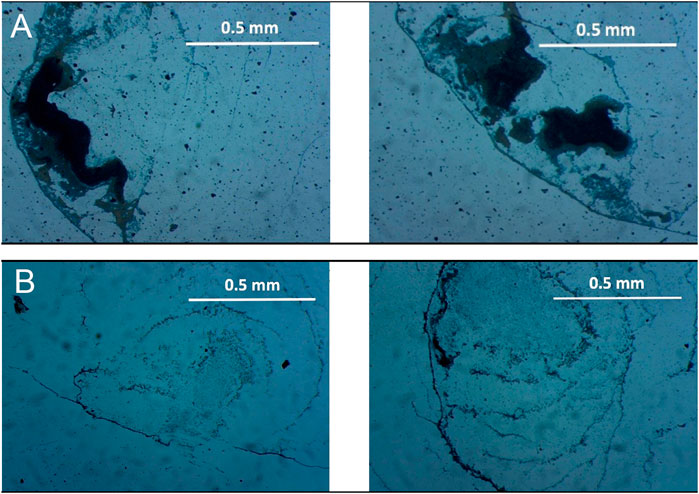
FIGURE 10. Examples of photos of the distribution of microspheres in dried droplets in 1 × 10–19 M HyFn dilution (upper row, (A)) and of microsphere distribution in dried water “dilutions” drops, corresponding to a dilution of 1 × 10–19 M (lower row, (B)). Here accumulation of microspheres is also observed, but it differs from dense accumulations in droplets with 1 × 10–19 M HyFn (A). Only 5 drops out of 36 have structures similar to those shown in (A).
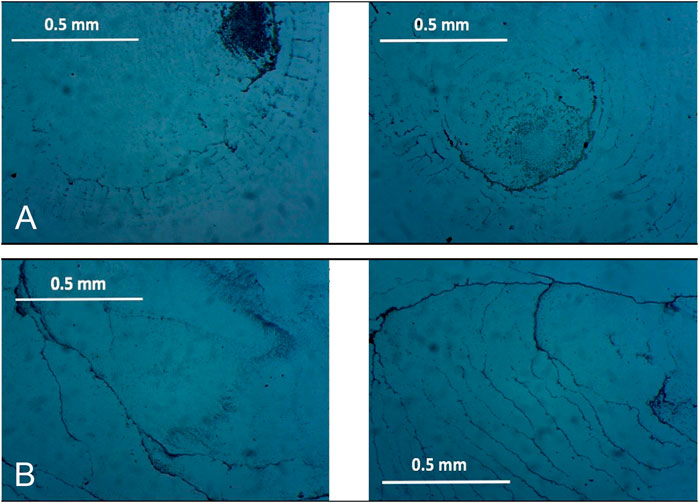
FIGURE 11. Examples of photos of microsphere distribution in dried drops in 1 × 10–27 M HyFn (upper row, (A)). ((B)–lower row)–examples of photos of microsphere distribution in dried water droplets, corresponding to a HyFn dilution of 1 × 10–27 M. Here a wavy distribution of microspheres is observed, but it differs from dense accumulations in drops with 1 × 10–27 M HyFn.
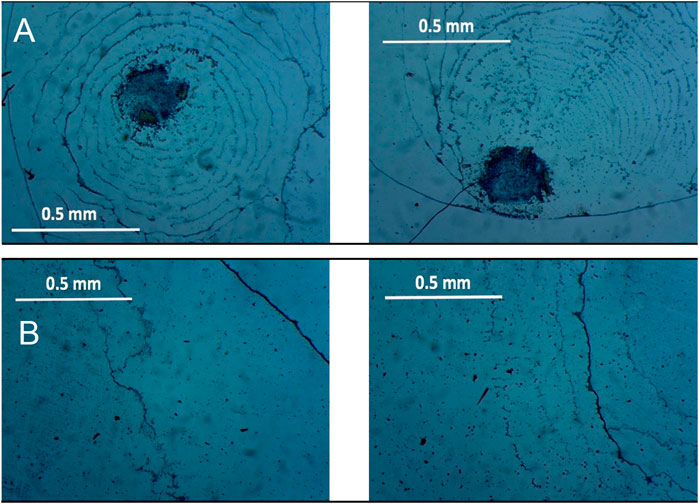
FIGURE 12. Examples of photos of microsphere distribution in dried drops in 1 × 10–31 M HyFn (upper row, (A)) and of photos of microsphere distribution in dried water droplets, corresponding to a HyFn dilution of 1 × 10–31 M (lower row, (B)).
All the results on the representation of structured and unstructured droplets in all the dilutions of HyFn and water are summarized in Scheme 1, 2. Here 6 glasses (big rectangulars) are conventionally shown for each particular dilution on each of which 6 drops (small rectangulars) were applied. Scheme 1 (gray color) represents the results obtained for HyFn dilutions, and Scheme 2 (blue color) the same for water “dilutions.” A pale color of the small rectangular means that no signs of structuredness and non-uniform distribution of microspheres were found in this drop, that is, they were located rather chaotically. A darker color means that obvious heterogeneity (structuredness) in this drop is observed. It can be seen that both pale and dark colors are present in dilutions of both HyFn and water though in general dark colored boxes obviously dominate in Scheme 1 illustrating HyFn dilutions and pale colors dominate in Scheme 2 illustrating water.

SCHEME 1. Chart of glass slides with six dried drops on each of them. Dilutions of HyFn are indicated on the left. Six slides are shown for each dilution. Pale boxes symbolize homogenous distribution of microspheres in a drop, dark boxes symbolize heterogenous distribution of microspheres.
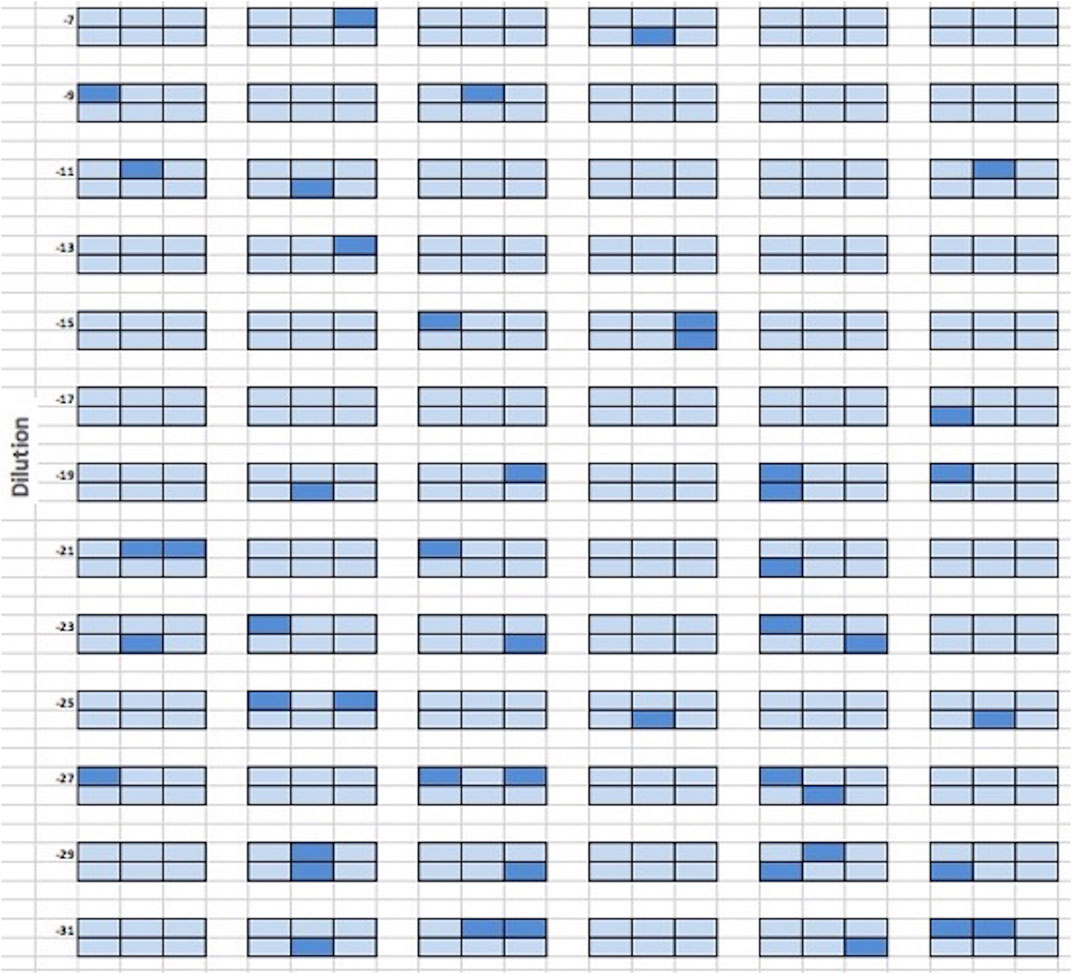
SCHEME 2. Chart of glass slides with six dried drops. Water dilutions are indicated on the left. Six slides are shown for each dilution. Pale boxes symbolize homogenous distribution of microspheres in a drop, dark boxes symbolize heterogenous distribution of microspheres.
Comparison of the number of drops with special structures (significantly uneven distribution of microspheres) in HyFn and respective water dilutions is presented in Figure 13. It can be seen, that the number of structured drops originating from HyFn dilutions markedly exceed the number of structured drops originating from water “dilutions.” This difference is especially prominent for ultra-high dilutions. In the range of dilutions equivalent to HyFn concentrations 10–19–10–31 M the proportion of structured drops to unstructured ones reaches 60–80%, while in drops from respective water “dilutions” it does not exceed 15–20%.
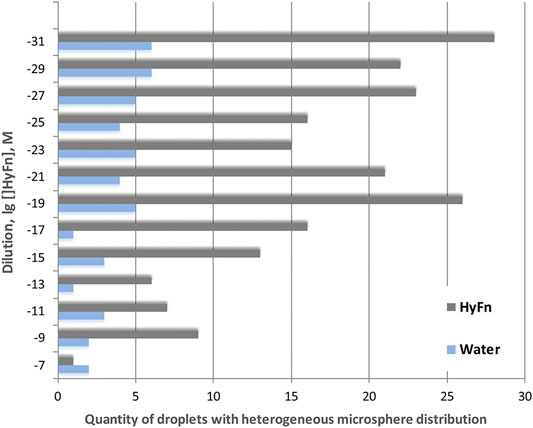
FIGURE 13. Comparison of the number of drops with special structures (substantially uneven distribution of microspheres) in HyFn dilutions and water “dilutions” out of 36 drops for each HyFn or respective water dilution.
Still one should admit that in some water “dilutions” signs of orderliness can also be observed. For example, in the few drops prepared from the “dilutions” of water corresponding to 1 × 10–23 M and 1 × 10–27 M a wave-like distribution of microspheres without their clustering in clumps were observed, which indicates that water also undergoes changes during the preparation of dilutions. Therefore, it seems difficult to completely objectively determine a single parameter according to which test and control drops can be divided. However, it is obvious that in most dilutions the test and control drops are not the same, and also the drops in different dilutions are not the same among themselves. In general, drops obtained from dilutions of HyFn are characterized by the concentration of microspheres in a certain area, as if, evaporating faster from the edges of the drop, water pushed the microspheres to the center. It can be assumed that the evaporation rate in structured HyFn water is different from that from the control drops.
Discussion
In the present study some physical-chemical properties of aqueous systems representing centesimal dilutions of HyFn and of the respective “dilutions” of deionized water used for the preparation of HyFn dilutions were compared. The range of dilutions prepared via vigorous shaking at each step extended from HyFn concentration 10–9 M to estimated HyFn “concentration” 10–31 M. As far as we are concerned comparisons of serial dilutions of different substances in the range of high and ultra-high dilutions with the respective “dilutions” of deionized water prepared according to the same protocol are not performed on a regular basis. Here such comparisons allowed to reveal not only reliable differences between HyFn dilutions and respective controls but also some peculiar features of the “dilutions” of deionized water.
Several interesting features differentiating HyFn dilutions from the “dilutions” of deionized water were displayed in titrations of the dilutions with HCl and NaOH. When the dilutions were titrated with HCl stronger buffering properties of HyFn dilutions in comparison with the respective water controls were observed. This fact implies that HyFn dilutions contain something that neutralizes added H+ ions. For the HyFn dilutions which contain reasonable, though low concentrations of HyFn (10–7–10–11 M) such an excess in buffering capacity could be tentatively explained by the neutralization of H+ by the negatively charged aqueous shells that enclosure HyFn molecules present in these dilutions [17]. However, in higher HyFn dilutions especially those that exceed 10–15 M some other entities should be responsible for the excessive binding of H+ ions.
Over the past two decades a lot of experimental evidence accumulated in the literature on the existence in particular aqueous systems of stable water clusters containing millions to billions of water molecules. Especially interesting is that these supramolecular water complexes (clusters, associates) are present in high and ultra-high dilutions of different substances obtained by repeated dilutions of polar solutes. They may be visualized using such physical methods as atomic force microscopy, transmission electron microscopy, electric force microscopy, nanoparticle tracking analysis, dynamic light scattering (for the reviews see [33–37]). Many authors who observed the appearance of supramolecule water complexes in aqueous systems suppose that they represent the so-called coherent domains (CDs) of water predicted by Emilio Del Giudice and colleagues [38]. According to them coherent domains of water having the dimensions of about 100 nm are forming spontaneously as the result of interaction between the ambient electromagnetic field and water in accordance with quantum field theory as applied to condensed matter. Other scientists suggest that in the course of dilution with vigorous shaking of solutions of different substances natural mesoscopic heterogeneity in water may originate in the form of gas nanobubbles and other impurities such as salt microcrystals that can carry original solutes from one dilution to another [39, 40]. However, different mechanisms of origination of supramolecular structures in high and ultra-high dilutions do not rule out each other and may work in concert providing heterogenous composition of these dilutions and their special properties.
One of the features common to different supramolecular complexes originating in the course of dilutions is that they carry negative charge [35, 41]. In principle, such negatively charged supramolecular associates may form complexes with the added H+ ions and restrain the decrease of pH upon addition of HCl to them. Our observation that HyFn preparations in the whole range of dilutions even in ultra-high ones that are equivalent to calculated HyFn concentrations 10–31 M have higher buffering capacity than respective water “dilutions” corresponds with previously reported results from the laboratory of V. Elia. They demonstrated that extremely diluted solutions of several drugs such as Arnica Montana, Arsenicum Album, Magnesium Muriaticum have higher capability to buffer pH decrease when they are titrated with HCl than water used for the preparation of these solutions [32]. The authors suggested that excessive buffering capacity was provided by supramolecular organization occurring in the extremely diluted solutions, namely by the appearance in them of dissipative water structures in the course of serial dilutions with intensive shaking.
In contrast to the titration of HyFn dilutions with HCl no difference in the average buffering capacity of HyFn dilutions and respective water controls was revealed when these dilutions were titrated with NaOH (Figure 4C). However, another peculiar feature of titration was observed when preparations were titrated either with acid or alkali. This feature is the nonlinear, nonmonotonic polymodal dependence of pH upon the degree of HyFn dilutions and respective water “dilutions” that were revealed in the course of the titration of the dilutions. This nonlinearity for titration with HCl is clearly seen in Figure 3 (pH values in different dilutions to which eight 10 mkL portions of HCl have been added) and in Figure 4 for the titration with NaOH (pH values in different dilutions to which fifteen 10 mkL portions of NaOH have been added). From Figure 3 one can see that not only the average buffering capacity of HyFn dilutions against acidification is higher than in the respective water controls, but also that the buffering capacity of different dilutions of both HyFn and respective water dilutions may differ. For example, dilutions equivalent to HyFn concentration 10–19 M (as well as the respective water control) have higher buffering capacity than the lower (10–17 M) and higher (10–21 M) dilutions. In this picture one can also see that buffering capacity of HyFn and respective water dilutions fluctuate rather synchronously in the range of dilutions from 10–7 M to 10–23 M). However, in the range of ultra-high dilutions they continue to fluctuate for HyFn dilutions up to 10–31 M and remain stable in the respective water “dilutions.”
Nonlinearity of pH dependence upon the degree of HyFn dilutions is much more pronounced when HyFn dilutions are titrated with NaOH. As it is seen in Figure 5B, amplitudes of pH fluctuations in the whole range of HyFn dilutions significantly increase with the increase in alkalinity of HyFn dilutions. At the same time on increasing alkalinity pH fluctuations in HyFn dilutions become especially prominent in the range of ultra-high dilutions. Opposite is true for pH fluctuations in series of successive water “dilutions.” They are much less pronounced than in series of successive HyFn dilutions and practically disappear in the range of high water “dilutions.”
These results suggest that the buffering properties of consecutive HyFn ultra-high dilutions change significantly and highly nonlinearly with respect to addition of NaOH, while the behavior of control water dilutions in the course of NaOH titration is much more trivial.
Nonlinear concentration dependence of biological activity of high- and ultra-high dilutions of biologically active substances was demonstrated long ago (for a review see [42]). However, only recently A. Konovalov and associates demonstrated nonlinear concentration dependence of different physiochemical properties of high and ultra-high dilutions of multiple biologically active substances (for the review see [35]). In particular they found that nonlinear concentration relations are typical of pH variations in highly dilute aqueous solutions [43, 44]. Basing on their discovery of the presence in highly diluted solutions of particles with sizes of tens to hundreds of nanometers (called “nanoassociates” by them), they suggested that nonlinear concentration dependence of physicochemical properties and the biological effects of dilute solutions of biologically active compounds are related to the formation and rearrangement of nanoassociates in the course of dilutions with intensive shaking. The exact nature of these nanoassociates is not known but in any case, they should predominantly consist of water. Basing on this plausible hypothesis one may expect that high- and ultra-high HyFn dilutions should also represent heterogenous and probably structured aqueous systems containing supramolecular particles. Such structuredness may define their peculiar physicochemical properties.
In order to assess the degree of heterogeneity of HyFn dilutions and compare them with the respective control dilutions we used the method of drying of droplets (for the recent review see [45]) containing microspheres. The water basis of one kind of droplets was HyFn dilutions and of another kind of droplets–respective control water “dilutions.” It was found that a significant part of the dilutions is characterized by mesoscopic heterogeneity, which is expressed in the fact that after drying of water from droplets, the microspheres are distributed unevenly on the surface, and tend to concentrate in the droplet body or form ornament-like structures. Common feature of droplets with HyFn dilutions is that microspheres tend to concentrate much more often in them, while in droplets of the corresponding water “dilutions,” microspheres are distributed more evenly, and areas of their increased accumulation are much less common. With an increase in the degree of dilution, especially for ultra-high dilutions, the proportion of “structured” dried drops increased both in the samples with HyFn dilutions and in control water samples. However, as it can be seen in Figure 13 illustrating the pooled data the number of drops with special structures obtained from evaporation of HyFn dilutions was higher than that of control drops. This difference was especially pronounced for the range of ultra-high dilutions. Here the percentage of structured drops obtained from evaporation of HyFn dilutions reached 60–80%, while in drops from respective water “dilutions” it did not exceed 15–20%.
Thus, though the method of drying of droplets is not a quantitative one, it allowed to qualitatively evaluate difference in the structuredness of HyFn dilutions and the respective water “dilutions.” It demonstrated that HyFn dilutions are much more organized than the respective water “dilutions” and what is especially remarkable the structuredness of HyFn dilutions markedly increases with the degree of the dilution especially in the range of ultra-high dilutions. Drops prepared from extensively excited and serially diluted water also demonstrate some structuredness that may depend upon the presence of nanobubbles and certain impurities that inevitably appear in aqueous preparations exposed to succussion and dilution [45, 46].
Examination of the structuredness of aqueous systems studied here using the method of drying of droplets shows that the origin of the dilutions: whether they were obtained from the solution of HyFn or from pure water determines the degree of the heterogeneity (structuredness) of even ultra-high dilutions. HyFn dilutions in the range equivalent to HyFn concentrations below 10–19 M appear to be much more structured than the respective water “dilutions” though both series were treated in a similar manner. Notably this difference in structuredness of ultra-high HyFn dilutions and respective water controls correlates with the difference between these preparations revealed in the course of their titration both with HCl and NaOH. This suggests that physicochemical properties expressed in the buffering capacity of ultra-high aqueous dilutions may be related to their structural heterogeneity.
Data Availability Statement
The raw data supporting the conclusions of this article will be made available by the authors, without undue reservation.
Author Contributions
OY and VV contributed to conception and designed the experiments, OY, EB, and KN performed them, EB and KN performed the statistical analysis. VV analyzed the results and wrote the first draft of the manuscript. OY, KN, and EB wrote sections of the manuscript. VV administrated the project. All authors contributed to manuscript revision, read, and approved the submitted version.
Funding
The authors declare that this study received funding from Materia Medica Holding, Russia in the framework of the project No 9/19/NAK of February 08, 2019. The funder was not involved in the study design, collection, analysis, interpretation of data, the writing of this article or the decision to submit it for publication.
Conflict of Interest
The authors declare that the research was conducted in the absence of any commercial or financial relationships that could be construed as a potential conflict of interest.
Acknowledgments
Funding for this work is gratefully acknowledged from Materia Medica Holding, Russia.
References
1. Kroto HW, Heath JR, O’Brien SC, Curl RF, Smalley RE. C60: buckminsterfullerene. Nature (1985) 318:162–3. doi:10.1038/318162a0
2. Fowler PW, Ceulemans A. Electron deficiency of the fullerenes. J Phys Chem (1995) 99:508–10. doi:10.1021/j100002a010
3. Markovic Z, Trajkovic V. Biomedical potential of the reactive oxygen species generation and quenching by fullerenes (C60). Biomaterials (2008) 29:3561–73. doi:10.1016/j.biomaterials.2008.05.005
4. Krusic PJ, Wasserman E, Keizer PN, Morton JR, Preston KF. Radical reactions of C60. Science (1991) 254:1183–5. doi:10.1126/science.254.5035.1183
5. Yamakoshi Y, Umezawa N, Ryu A, Arakane K, Miyata N, Goda Y, et al. Active oxygen species generated from photoexcited fullerene (C60) as potential medicines: O2-* versus 1O2. J Am Chem Soc (2003) 125:12803–9. doi:10.1021/ja0355574
6. Heymann D. Solubility of fullerenes C60 and C70 in seven normal alcohols and their deduced solubility in water. Fullerene Sci Technol (1996) 4:509–15. doi:10.1080/10641229608001567
7. Mchedlov-Petrossyan NO. Fullerenes in aqueous media: a review. Theor Exp Chem (2020) 55:361–91. doi:10.1007/s11237-020-09630-w
8. Djordjevic AB, Srdjenovic M, Seke D, Petrovic R, Injac R, Mrdjanovic J. Review of synthesis and antioxidant potential of fullerenol nanoparticles. J Nanomater (2015) 2015:567073. doi:10.1155/2015/567073
9. Grebowski J, Kazmierska P, Krokosz A. Fullerenes as a new therapeutic approach in nanomedicine. Biomed Res Int (2013) 2013:751913–9. doi:10.1155/2013/751913
10. Penkova AV, Acquah SFA, Piotrovskiy LB, Markelov DA, Semisalova AS, Kroto HW. Fullerene derivatives as nano-additives in polymer composites. Russ Chem Rev (2017) 86:530–66. doi:10.1039/C7TB00855D
11. Castro E, Hernandez Garcia A, Zavala G, Echegoyen L. Fullerenes in biology and medicine. J Mater Chem B (2017) 5:6523–35. doi:10.1039/C7TB00855DPMID:29225883
12. Dugan LL, Turetsky DM, Du C, Lobner D, Wheeler M, Almli CR, et al. Carboxyfullerenes as neuroprotective agents. Proc Natl Acad Sci U. S. A (1997) 94:9434–9. doi:10.1073/pnas.94.17.9434
13. Andrievsky G, Kosevich M, Vovk O, Shelkovsky V, Vashchenko LA. On the production of an aqueous colloidal solution of fullerenes. J Chem Soc Chem Commun. (1995) 12:1281–2. doi:10.1039/C39950001281
14. Andrievsky GV, Klochkov VK, Bordyuh A, Dovbeshko GI. Comparative analysis of two aqueous-colloidal solutions of C60 fullerene with help of FTIR reflectance and UV–Vis spectroscopy. Chem Phys Lett (2002) 364:8–17. doi:10.1016/S0009-2614(02)01305-2
15. Avdeev MV, Khokhryakov AA, Tropin TV, Andrievsky GV, Klochkov VK, Derevyanchenko LI, et al. Structural features of molecular-colloidal solutions of C60 fullerenes in water by small-angle neutron scattering. Langmuir (2004) 20:4363–8. doi:10.1021/la0361969
16. Andrievsky GV, Klochkov VK, Karyakina EL, Mchedlov-Petrossyan NO. Studies of aqueous colloidal solutions of fullerene C60 by electron microscopy. Chem Phys Lett (1999) 300:392–6. doi:10.1016/S0009-2614(98)01393-1
17. Mchedlov-Petrossyan N, Klochkov V, Andrievsky G. Colloidal dispersions of fullerene C60in water: some properties and regularities of coagulation by electrolytes. J Chem Soc Faradey Trans. (1997) 93:4343–6. doi:10.1039/a705494g
18. Andrievsky G, Klochkov V, Derevyanchenko L. Is the C60 fullerene molecule toxic?!. Fuller Nanotub Car N (2005) 13:363–76. doi:10.1080/15363830500237267
19. Sayes C, Fortner JD, Guo W, Lyon D, Boyd A, Ausman K, et al. The differential cytotoxicity of water-soluble fullerenes. Nano Lett (2004) 4:1881–7. doi:10.1021/nl0489586
20. Gharbi N, Pressac M, Hadchouel M, Szwarc H, Wilson SR, Moussa F. [60]fullerene is a powerful antioxidant in vivo with no acute or subacute toxicity. Nano Lett (2005) 5:2578–85. doi:10.1021/nl051866b
21. Nedzvetsky VS, Sukharenko EV, Baydas G, Andrievsky GV. Water-soluble C60 fullerene ameliorates astroglial reactivity and TNFa production in retina of diabetic rats. Regul Mech Biosyst (2019) 10:513–9. doi:10.15421/021975
22. Ali SS, Hardt JI, Quick KL, Kim-Han JS, Erlanger BF, Huang TT, et al. A biologically effective fullerene (C60) derivative with superoxide dismutase mimetic properties. Free Radic Biol Med (2004) 37:1191–202. doi:10.1016/j.freeradbiomed.2004.07.002
23. Ali SS, Hardt JI, Dugan LL. SOD activity of carboxyfullerenes predicts their neuroprotective efficacy: a structure-activity study. Nanomedicine (2008) 4:283–94. doi:10.1016/j.nano.2008.05.003
24. Andrievsky GV, Bruskov VI, Tykhomyrov AA, Gudkov SV. Peculiarities of the antioxidant and radioprotective effects of hydrated C60 fullerene nanostuctures in vitro and in vivo. Free Radic Biol Med (2009) 47:786–93. doi:10.1016/j.freeradbiomed.2009.06.016
25. Andrievsky GD, Shakhnin D, Tronza A, Zhernosekov D, Tykhomyrov A. The acceleration of blood plasma clot lysis in the presence of hydrated C60 fullerene nanostructures in super-small concentration. Fuller Nanotub Car N (2010) 18:303–11. doi:10.1080/15363831003785257
26. Voeikov VL, Yablonskaya OI. Stabilizing effects of hydrated fullerenes C₆₀ in a wide range of concentrations on luciferase, alkaline phosphatase, and peroxidase in vitro. Electromagn Biol Med (2015) 34:160–6. doi:10.3109/15368378.2015.1036077
27. Sachkova AS, Kovel ES, Churilov GN, Guseynov OA, Bondar AA, Dubinina IA, et al. On mechanism of antioxidant effect of fullerenes. Biochem Biophys Rep (2016) 9:1–8. doi:10.1016/j.bbrep.2016.10.011
28. Kudryasheva NS, Kovel ES. Monitoring of low-Intensity exposures via luminescent bioassays of different complexity: cells, enzyme reactions, and fluorescent proteins. Int J Mol Sci (2019) 20:4451. doi:10.3390/ijms20184451
29. Emelyantsev S, Prazdnova E, Chistyakov V, Alperovich I. Biological effects of C60 fullerene revealed with bacterial biosensor-toxic or rather antioxidant? Biosens (Basel) (2019) 9:81. doi:10.3390/bios9020081
30. Novikov KN, Berdnikova NG, Novikov AK, Lyusina OY, Muhitova OG, Yablonskaya OI, et al. Changes in chemiluminescence of whole blood of COPD patients treated with Hypoxen and effects of C₆₀ fullerenes on blood chemiluminescence. Med Sci Monit (2012) 18:BR76–83. doi:10.12659/msm.882460
31. Yablonskaya OI, Ryndina TS, Voeikov VL, Khokhlov AN. A paradoxal effect of hydrated C60-fullerene in an ultra-low concentration on the viability and aging of cultivated Chinese hamster cells. Mosc Univ Biol Sci Bull (2013) 68:63–8. doi:10.3103/S0096392513020107
32. Cacace CM, Elia L, Elia V, Napoli E, Niccoli M. Conductometric and pHmetric titrations of extremely diluted solutions using HCl solutions as titrant. A molecular model. J Mol Liq (2009) 146:122–6. doi:10.1016/j.molliq.2009.02.012
33. Ho M-W. Large supramolecular water clusters caught on camera—a review. Water J—Multidiscip Res J (2014) 6:1–12. doi:10.14294/WATER.2013.12
34. Elia V, Germano R, Napoli E. Permanent dissipative structures in water: the matrix of life? Experimental evidences and their quantum origin. Curr Top Med Chem (2015) 15:559–71. doi:10.2174/1568026615666150225102531
35. Konovalov AI, Ryzhkina IS. Highly diluted aqueous solutions: formation of nano-sized molecular assemblies (nanoassociates). Geochem Inter (2014) 52:1207–26. doi:10.1134/S0016702914130072
36. Kononov LO. Chemical reactivity and solution structure: on the way to a paradigm shift? RSC Adv (2015) 5:46718–34. doi:10.1039/c4ra17257d
37. Pollack GH. The fourth phase of water: beyond solid, liquid and vapor. Seattle, WA: Ebner and Sons (2013). 357.
38. Arani R, Bono I, Del Guidice E, Preparata G. QED coherence and the thermodynamics of the water. Int J Mod Phys (1995) 9:1813–41. doi:10.1142/S0217979295000744
39. Bunkin NF, Shkirin AV, Penkov NV, Chirikov SN, Ignatiev PS, Kozlov VA. The physical nature of mesoscopic inhomogeneities in highly diluted aqueous suspensions of protein particles. Phys Wave Phenom (2019) 27:102–12. doi:10.3103/s1541308x19020043
40. Yakhno T, Drozdov M, Yakhno V. Giant water clusters: where are they from? Int J Mol Sci (2019) 20:1582. doi:10.3390/ijms20071582
41. Lo S-Y, Geng X, Gann D. Evidence for the existence of stable-water-clusters at room temperature and normal pressure. Phys Lett A (2009) 373:3872–6. doi:10.1016/j.physleta.2009.08.061
42. Endler PC, Schulte J (eds). Ultra high dilution: physiology and physics. Dordrecht:Kluwer Academic Publishers (1994), 268. doi:10.1007/978-94-015-8342-8
43. Ryzhkina IS, Kiseleva YV, Timosheva AP, Safiuliin RA, Kadirov MK, YuN V, et al. Low-concentration aqueous solutions of an amphiphilic calix[4]resorcinarene derivative: self-organization, physicochemical properties, and biological activity under common and hypoelectromagnetic conditions. Dokl Phys Chem (2012) 447:193–9. doi:10.1134/S0012501612110024
44. Ryzhkina IS, Kiseleva YV, Mishina OA, Timosheva AP, SYu S, Kravchenko AN, et al. Correlations between the self-organization, physicochemical properties and biological activity of Mebicar in dilute aqueous solutions. Mend Commun (2013) 23:262–4. doi:10.1016/i.mencom.2013.09.008
45. Yakhno T, Yakhno V. A study of the structural organization of water and aqueous solutions by means of optical microscopy. Crystals (2019) 9:52. doi:10.3390/cryst9010052
Keywords: hydrated fullerene, water, high dilutions, pH, titration, buffering capacity, microstructure of liquids
Citation: Yablonskaya O, Buravleva E, Novikov K and Voeikov V (2021) Peculiarities of the Physicochemical Properties of Hydrated C60 Fullerene Solutions in a Wide Range of Dilutions. Front. Pharmacol. 9:627265. doi: 10.3389/fphy.2021.627265
Received: 09 November 2020; Accepted: 25 January 2021;
Published: 11 March 2021.
Edited by:
Nikolai F. Bunkin, Bauman Moscow State Technical University, RussiaReviewed by:
Igor Jerman, Inštitut Bion, SloveniaSteven Cartwright, University of Oxford, United Kingdom
Copyright © 2021 Yablonskaya, Buravleva, Novikov and Voeikov. This is an open-access article distributed under the terms of the Creative Commons Attribution License (CC BY). The use, distribution or reproduction in other forums is permitted, provided the original author(s) and the copyright owner(s) are credited and that the original publication in this journal is cited, in accordance with accepted academic practice. No use, distribution or reproduction is permitted which does not comply with these terms.
*Correspondence: V. Voeikov, djEwOTAyOHYxQHlhbmRleC5ydQ==
 O. Yablonskaya1
 E. Buravleva
 V. Voeikov