 Yonghong Wang
 Songkui Sang1
 Yongfeng Huang
- 1School of Civil Engineering, Qingdao University of Technology, Qingdao, China
- 2Collaborative Innovation Center for Engineering Construction and Safety of Blue Economic Zone, Qingdao, China
In order to investigate the influence of different diameters on pile end resistance, pile side resistance, pile axial force and pile force transmission law of jacked pile penetration, two pairs of embedded sensitized microfiber grating sensors were installed by slotting the pile body. The pile-jacking process of static-pressing viscous foundation soil with different diameters of closed-tube model piles was successfully monitored. The test results show that the pile pressure, pile end resistance and pile side resistance of the two test piles increase linearly with the increase of pile depth. When the pile jacks, the final pressure of the test pile TP1 is higher than that of the test pile. TP2 is 31% higher, pile end resistance is 18% higher, and total side resistance is 57% higher. The results show that increasing the pile diameter can significantly increase the pile side resistance; under different penetration depths, the pile side resistance is from top to end. Continuously exerted, the axial force of the pile body decreases with the depth of the pile and the slope of the distribution curve of the axial forcegradually decreases. At the maximum penetration depth, the axial force of the pile TP1 is 18% larger than that of the test pile TP2; As the depth increases, the unit side resistance at the same penetration depth gradually decreases, that is, the side resistance has a “degradation effect”; at the end of the pile jacking, the percentage of the pile end resistance to the pile force exceeds 50%, that is, the pile end resistance bears most of the load. This research can be used as a reference for the study of pile driving mechanism in clayey and layered clayey soils.
Introduction
Many scholars at home and abroad have conducted field tests [1–3] and indoor tests [4–7], combined with numerical simulation, to study the force state of the pile body in the process of pile jacking. Doherty et al. [1] carried out field tests of open pile and studied the stress during pile jacking. Zhang et al. [2] studied the main influence and effect of soil clogging through field tests, and studied the change rule of pile end resistance. Han et al. [3] conducted a slow-maintaining static load test for closed and open steel pipe piles driven side-by-side, and studied the difference in resistance between the two piles. Paik [4] studied the influence of soil plugs on the bearing capacity of open-ended pipe piles, and quantified it with an incremental filling rate. Combined with indoor model pile tests, they proposed an empirical relationship for the bearing capacity of open-end piles. Zhang et al. [5] monitored the change and displacement of soil around the pile through indoor model tests. Lehane et al. [6] studied the aging effect of pile resistance in sand through new laboratory tests. White et al. [7] used centrifuge model piles equipped with side pressure sensors, and obtained the degradation effect of resistance by referring to other laboratory and field experimental data.
At present, most indoor model tests study the load transfer law of pile body during pile jacking from the aspects of foundation soil layer, pipe pile length and different pile end forms [8–12]. However, there are few studies on the influence of pipe pile diameter on the force state of jacked pile during pile jacking. Traditional test methods mostly use strain gauges attached to the outside of the pile, but the pile jacking process is easily damaged by the resistance of the soil around the pile, which is greatly affected by the environment, low reliability, and low accuracy [13–15]. Fiber grating technology is a new type of test element that has been vigorously developed in recent years. Because of its small size, high sensitivity, good long-term stability, light weight, and strong anti-interference ability, it has gradually replaced strain gauges and has become more popular by most people. It is widely used in practical engineering and model tests [16, 17]. In this paper, the sensitivity-enhancing miniature fiber grating sensor and the pile top pressure sensor have been successfully applied to the indoor jacked pile penetration model test in the silt and clay layer. Analyze and study the difference in load-bearing performance of two closed-end model pipe piles with different pile diameters during the pile jacking process of pile shaft force, pile side resistance, pile end resistance, pile pressure, etc. The test results provide practical value and guiding significance for actual engineering and related academic research.
Experiment Preparation
The test site is located in the Power Experiment Center of Qingdao University of Technology. The instrument used in the test is a large-scale model test system developed by the Qingdao University of Technology.
Test System
The system mainly includes loading system, data acquisition system and model box. Among them, the size of the model box is 3 m × 3 m × 2 m (length × width × height), which is welded by steel plates. In order to observe the pile jacking process, a tempered glass window is installed on the front of the model box; The instruments used for data acquisition are mainly FS2200RM fiber grating demodulator and DH3816N static strain acquisition instrument; the test loading system is shown in Figure 1.
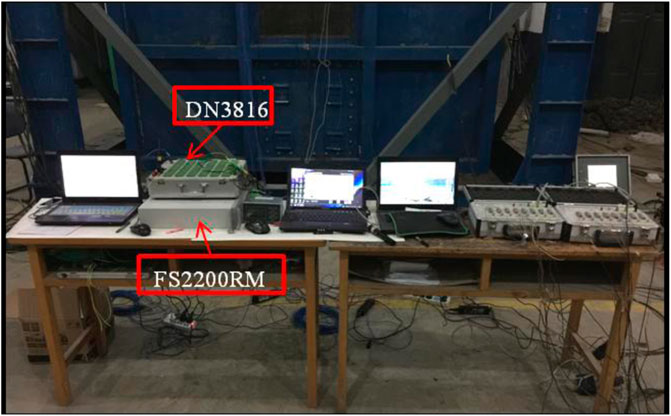
FIGURE 1. Large scale indoor model test loading system.
Foundation Soil Production
The soil sample used in the indoor model test was taken from the silty clay layer of a residential project in Qingdao. The close-up view of the soil sample is shown in Figure 2. After the soil samples are sent to the laboratory, they are filled in layers, rolled, and mechanical vibrating. The vibrating operations are shown in Figure 3. After the soil sample is evenly vibrated, it is sprinkled with water and covered with mulendle layers of film. After standing for about 30 days, the pile pressure test is officially carried out. Before the indoor pile pressure test, a series of indoor geotechnical tests were carried out according to the “Standard for Geotechnical Test Methods” (GB/T 50123-1999) [18], and the related physical and mechanical parameters were determined. The specific parameters are shown in Table 1.
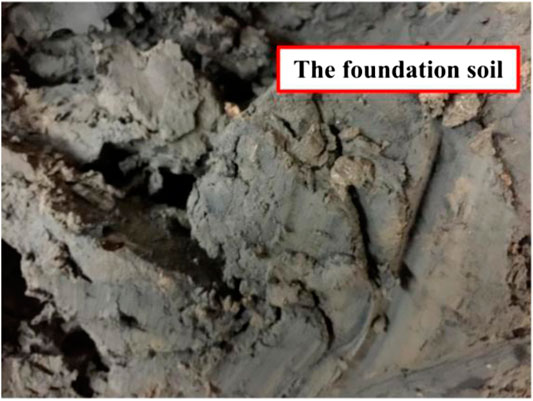
FIGURE 2. Close-up view of the ground foundation soil.
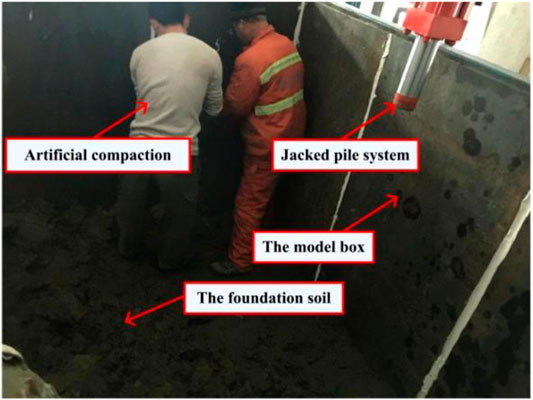
FIGURE 3. Grounding of foundation soil.

TABLE 1. Physical and mechanical parameters of soil samples.
Model Pile
In this indoor test, a total of 2 jacked pile tests with different diameter model piles were carried out. the ends of the two model piles are connected to the ends of the pipe piles with hexagon socket head bolts to form a closed mode.
The two piles are made of aluminum with the same material. According to the existing research, it is feasible to analyze the mechanical characteristics of pile foundation by using aluminum model pile in laboratory test. Duan [19]. simulated the mechanical characteristics of Marine fan pile foundation under vertical load by indoor test of aluminum pile. Tang Shidong [20] studied the influencing factors of pile lateral friction by installing strain gauges in aluminum piles.
In this test, the parameters of model pile are determined by the similarity theory. Large steel piles are 3–6 m in diameter and 30–50 m in length [21]. In this paper, according to the prototype pile, the pile length is 40 m, the pile diameter is 5.6 m, the elastic modulus is 210 GPa, and the Poisson’s ratio is 0.3. In order to satisfy the load similarity ratio, the geometric similarity ratio was determined to be 40, the elastic modulus similarity ratio was 2.9, and the Poisson’s ratio similarity ratio was 1. The test piles were made of aluminum pipe piles TP1 and TP2 with an elastic modulus of 72 GPa, Poisson’s ratio of 0.3, diameter and length of 140 and 1000 mm, respectively. The specific parameters of the model pipe piles are shown in Table 2.

TABLE 2. Model pipe pile parameter table.
Introduction and Installation of Sensors
Introduction of Fiber Grating Sensor
The fiber grating sensor used in the experiment is the JMFSS-04 sensitized miniature fiber grating sensor (hereinafter referred to as FBG sensor) produced by Shenzhen Testing Technology Co., Ltd., which is mainly composed of FC connector, fiber grating, clamping sleeve and pigtail, such as shown in Figure 4A. Some specific parameters of the FBG sensor are shown in Table 3. The center wavelength of the sensor is not listed in the table.
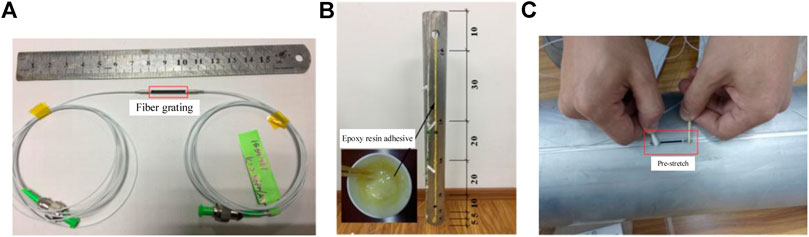
FIGURE 4. FBG sensor installation. (A) Sensitization miniature FBG sensor (B) FBG sensor spacing (C) Pre-stretch.

TABLE 3. sensitization micro FBG sensor parameter table.
The Layout of Fiber Grating Sensor
The model piles TP1 and TP2 in this experiment are all grooved and embedded with 6 FBG sensors. The specific installation process is as follows:① A shallow groove with a width of 2 mm and a depth of 2 mm was opened on the surface of the pipe pile. ② Wipe the installation location of the FBG sensor with alcohol and cotton balls. ③ The FBG sensors are numbered 1#∼6# sequentially from the pile end to the pile top, and the distribution form is dense at the end and sparse at the top. The sensor spacing is shown in Figure 4B. ④ Pre-tension the FBG sensor for about 2 nm and fix it with 704. The operation process is shown in Figure 4C. ⑤ After scrubbing the FC connector of the FBG sensor with alcohol and cotton balls, connect it to the FS2200RM fiber grating demodulator to detect its survival rate. The result shows that all survived. Finally, epoxy resin is used to encapsulate the surface of the pile so that the surface is flush with the pile body.
Pile Top Pressure Sensor
The pressure sensor is mainly used to measure the pile pressure during the pile jacking process. Its specific parameters are shown in Table 4. The sensor is easy to install and does not need to be tightly connected with the model pile. It only needs to be aligned before starting the pile jacking. Just place the center of the quasi-pile top horizontally on the top of the pile, as shown in Figure 5.

TABLE 4. Pile top pressure sensor parameters.
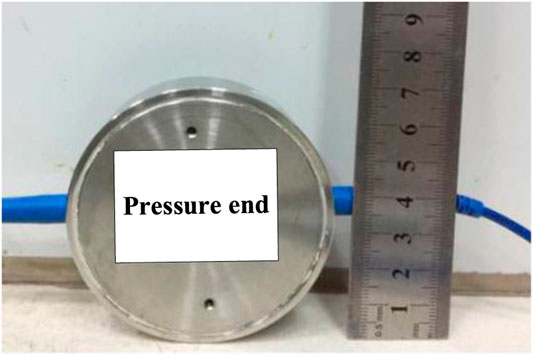
FIGURE 5. Pile top pressure sensor.
Indoor Pile Jacking Test
After 30 days of consolidation for the remodeled soil sample of the foundation, the excess pore pressure gradually dissipated and the effective stress increased. Through a series of indoor geotechnical tests, the soil sample has been tested to meet the test requirements, and the pile jacking test can be carried out.
Test Plan
In order to ensure the smooth progress of the test and real-time monitoring of the load change law of the pile jacking process, such as pile pressure and pile end resistance, the following Table 5 test plan is proposed.
TABLE 5. Test pile test plan table.
Selection of Stake
According to the “Technical Specification for Building Pile Foundations” (JGJ 94-2008) [22], the minimum center distance of foundation piles is 4D (D: pile diameter), the two sets of model pipe piles in this experiment are all arranged in the center of the model box, and the center of the pile is 1400 mm from the boundary of the model box, which meets the above requirements, and the boundary effect can be ignored [23].
Experimental Procedure
The specific steps of pile jacking test are as follows: ① The hydraulic jack on the loading beam is moved to the designated pile position through the electronic control system. ② urn on the system host and control the jack to rise to a certain height through the oil pump. Put the test pile upright on the pile to be pressed, and use a magnetic box level to adsorb on the surface of the pipe pile to determine whether the pipe pile is vertical to prevent eccentric compression. ③ After confirming that the pipe pile is upright, pressurize again through the system host to control the oil pump, so that the hydraulic jack is slowly and uniformly lowered until it stops pressurizing when it is about to touch the top of the model pile. ④ Connect the transmission lines of each FBG sensor and pile top pressure sensor to their corresponding collection instruments in turn. ⑤ After confirming that the connection is correct and the parameters have been adjusted, data collection will be carried out before the formal pile jacking test. ⑥ In view of the limited stroke of the hydraulic jack, the entire pile jacking process is completed in two times, with a pause in the middle to increase the falling height of the jack. The pile jacking process is shown in Figure 6.
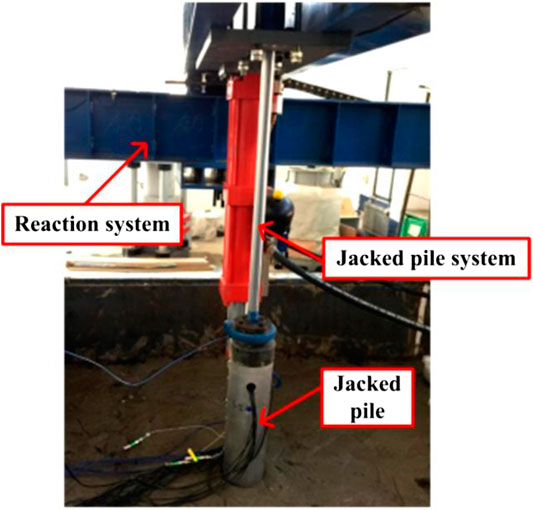
FIGURE 6. Pile jacking process.
FBG Sensor Data Processing
In order to study the influence of different diameters on the pile side resistance, In this sample, the FBG sensor is pasted on the surface of the pile and the wavelength difference of the optical fiber measured by the FS2200RM fiber grating demodulator during the pile jacking process. According to the wavelength difference, the unit resistance of the pile side is calculated by Eqs 1, 2.
The expression of the strain change value is as follows:
where:
The expression of the axial force N during the pile jacking process is as follows:
where:
The expression of the unit resistance of the pile side during pile jacking is as follows:
where:
Test Results and Analysis
Analysis of Pile Pressure During Pile Jacking
The pile pressure in the process of pile jacking is mainly measured by the pile top pressure sensor. Aiming at the cohesive soil environment of this experiment, in order to better observe the influence of pile diameter on the pile pressure during pile jacking, plot the curve of the pressure of the test piles TP1 and TP2 with the depth of the pile during the entire pile jacking process, as shown in Figure 7.
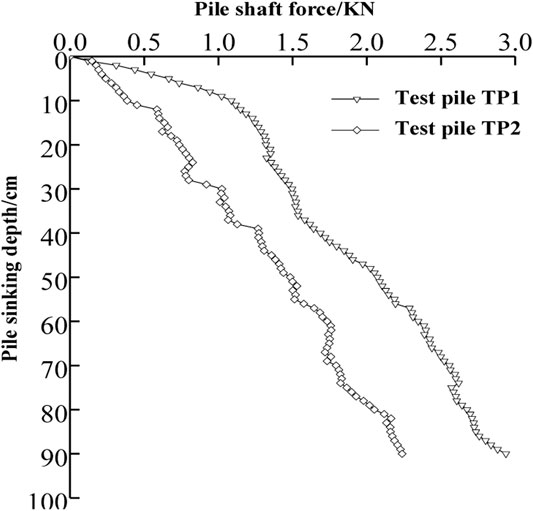
FIGURE 7. Variation of pile force during pile jacking.
It can be seen from Figure 7 that the pile pressure of the two test piles increases approximately linearly with the increase of the pile jacking depth. The pile pressure of the test pile TP1 is always greater than that of the test pile TP2 throughout the pile jacking process, Mainly because the larger the pile diameter, the larger the contact area between the pile body and the clay, the greater the compaction of the soil around the pile, and the compacted pile end soil and the soil around the pile cause the pile pressure to increase continuously. When the pile jacking depth reaches the maximum, the final pressure of the large-diameter test pile TP1 is 2.94 kN, and the final pressure of the small-diameter test pile TP2 is 2.24 kN. Through comparison, it can be found that the final pressure of the test pile TP1 is 31% higher than that of the test pile TP2, indicating that the pile diameter has a greater influence on the final pressure. The main reason is that different pile diameters affect both the pile end resistance and the pile side resistance.
Analysis of Pile End Resistance During Pile Jacking
The pile end 1# sensor can be used to measure the change law of the pile end resistance of each test pile during the pile jacking process. The change trend of the pile end resistance of different test piles during the pile jacking process reflects the influence of the size of the pile diameter on the load transfer mode. The change in pile end resistance during the process is shown in Figure 8, and the percentage of pile end resistance in the pile pressure at different pile jacking depths is shown in Figure 9.
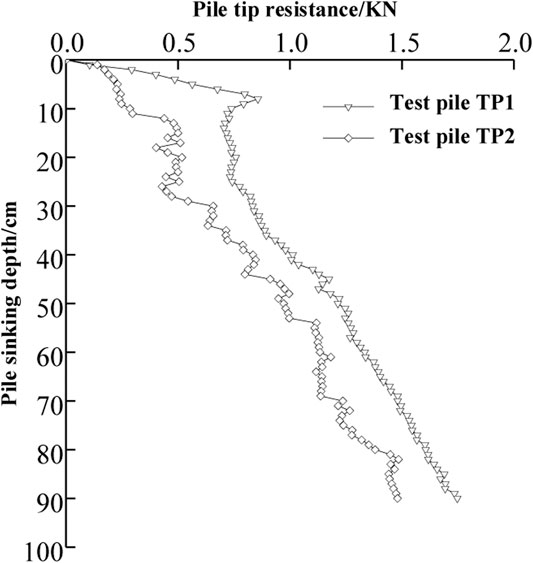
FIGURE 8. Change of pile end resistance during pile jacking.
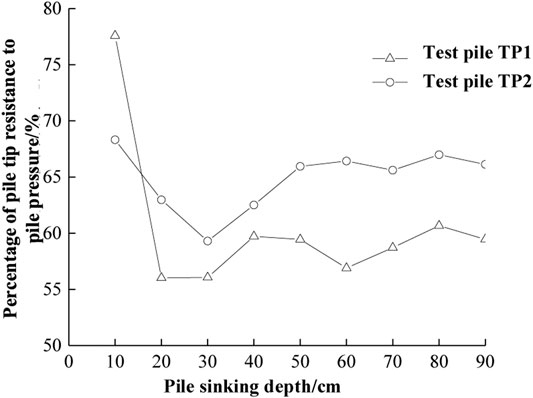
FIGURE 9. Pile end resistance as a percentage of the pile force.
It can be seen from Figures 8, 9 that during the entire pile jacking process, the pile end resistance of the two pipe piles showed a gradual increase with the increase of the pile jacking depth. When the pile jacking depth is less than 10 cm, the pile end resistance of the two test piles increases rapidly, and the phenomenon of test pile TP1 is more obvious. The value can reach 0.793 kN, accounting for 77.59% of the pile pressure. The pile end resistance of test pile TP2 The growth rate of TP1 is smaller than that of TP1, but the percentage of pile pressure is far more than 65%; The reason for the analysis may be that in the early stage of pile jacking, the test pile disturbs the soil around the shallow pile a lot, the pile body is not in close contact with the surrounding soil, the soil squeezing effect is not obvious, and the side resistance of the pile has not been well exerted. Most of the pile pressure is borne by the pile end. Because the pile diameter of the test pile TP1 is large, the disturbance range of the shallow pile surrounding soil is large, and the pile side resistance is small, so the pile end resistance growth rate is large. piles TP1 and TP2 becomes slower, especially in the range of 10 cm∼30 cm, the pile end resistance of the test pile TP1 increases from 0.793 kN to 0.827 kN, and the test pile TP2 Increased from 0.248 kN to 0.545 kN, the increase is relatively small, especially when the pile jacking depth is 30 cm, the ratio of the pile end resistance to the pile pressure of the two test piles reaches the minimum 56.07% and 59.30%; The reason for the analysis may be that as the penetration depth increases, the contact area between the pile and the soil increases, and the compaction effect of the pile on the surrounding soil makes the side resistance of the pile gradually play from top to end, so the increase rate of the pile end resistance becomes slow. Throughout the pile jacking process, the pile end resistance of the test pile TP2 is always smaller than that of the test pile TP1. The reason is that although the pile end form of the two test piles is the same as the pile length, the test pile TP2 has the smallest pile diameter and the pile-soil interaction area is small. When the pile jacking depth reaches 90 cm, the end resistance of the test pile TP3 is 1.75 kN, the end resistance of the test pile TP2 is 1.48 kN, and the pile end resistance of the test pile TP1 accounts for 59.5% of its pressure. The test pile TP2 The end resistance of the piles accounted for 66.2% of the pile pressure, and the end resistance of the large-diameter test pile was 18% higher than that of the small-diameter pile; It shows that the pile jacking process of cohesive soil, the pile end resistance of the two groups of different pile diameters accounts for a large percentage of the pile pressure force, and the pile end resistance bears most of the load. The side resistance increases within a certain value range.
Analysis of Pile Side Resistance During Pile Jacking
Using FBG sensors at different positions of the pile body, using FS2200RM fiber grating demodulator to collect different wavelength differences, using Eqs 1–3 to convert, pile side resistance of each test pile changes with the pile jacking depth The curve is shown in Figure 10.
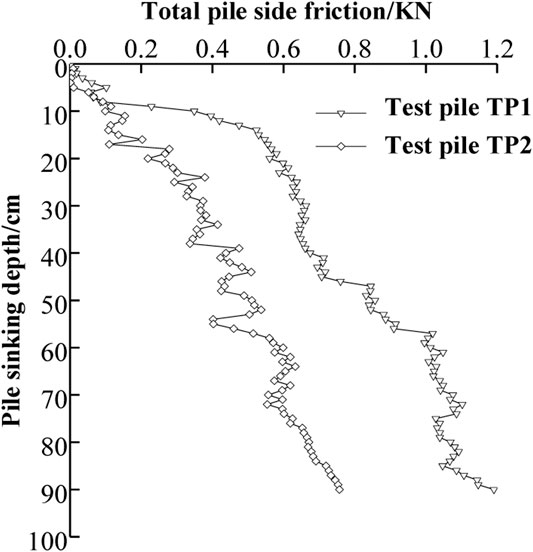
FIGURE 10. Variation of the side resistance of the total pile during pile jacking.
It can be seen from Figures 10, 11 that: on the whole, the pile side resistance of each test pile gradually increases with the increase of the pile jacking depth, which is consistent with the research results of Rao et al. [24] and Alawneh et al. [25]. It is analyzed that with the increase of the pile jacking depth, the contact area between the pile body and the soil increases, and the lateral pressure of the soil around the pile gradually increases, which makes the pile side resistance increase. In the range of 10 cm of pile jacking depth, the value of pile side resistance is very small, basically not exceeding 0.1 kN, and the ratio of side resistance to pile pressure is the smallest. This is mainly because the shallow soil body shakes more strongly during the pile jacking process, and the test pile with a larger pile diameter has a larger impact range, resulting in a certain gap between the pile and the soil, and the contact is no longer tight, as a result, the side resistance of pile in shallow soil is small. When the penetration depth is more than 10 cm, the side resistance of large diameter test pile is much greater than that the small diameter test pile at the same pile jacking depth, And at the pile jacking depth of 30 cm, the side resistance accounts for the highest proportion of the pile pressure. The test pile TP1 is about 44%, and the test pile TP2 is about 41%. The ratio of pile side resistance to pile pressure with small pile diameter is about 10% less than that of the test pile with large pile diameter; The reason may be that the diameter of the test pile TP2 is small, the contact area between the pile body and the soil is small, and the degree of side resistance is lower than that of the test pile TP1, which makes the value of the pile side resistance lower. And when the pile jacking depth reaches 90 cm, the side resistance of the test pile TP1 is 1.19 kN, and the ratio of pile side resistance to pile pressure is 40.54%. The side resistance of the test pile TP2 is 0.76 kN and the ratio of pile side resistance to pile pressure is 33.87%. Compared with the test pile TP2, the side resistance of TP1 is 57% higher, and the ratio of pile side resistance to pile pressure is 6.67% higher. It shows that the diameter is an important factor that affects the side resistance of the pile, because the larger the diameter of the pile, the larger the surface area of the pile in contact with the surrounding soil. The more obvious the compaction of the soil around the pile during the pile jacking process, the greater the lateral pressure, The value of pile side resistance is correspondingly large. For piles that rely on friction to carry the load, the effect of increasing the diameter of the pile body is more significant.
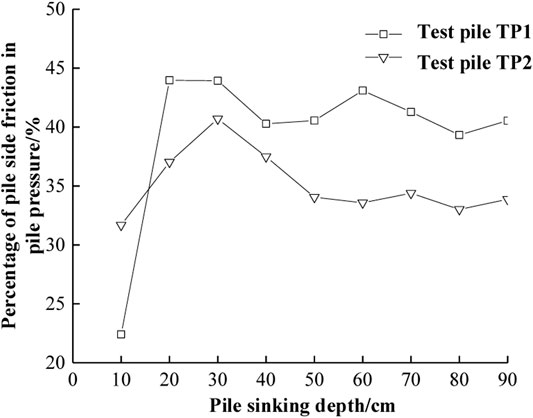
FIGURE 11. The side resistance of the pile as a percentage of the pile force.
Analysis of Axial Force Results of Test Pile
Through Eqs 1, 2, the axial force distribution curves of the two test piles during the entire pile jacking process can be obtained, as shown in Figure 12.
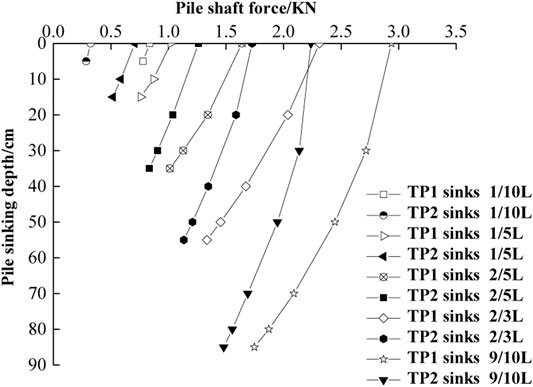
FIGURE 12. Axial force distribution diagram of each test pile body.
It can be seen from Figure 12 that the axial force distribution of the test piles TP1 and TP2 is similar: at different pile jacking depths, the axial force of the pile body decreases with the increase of the pile jacking depth. The deceleration rate of the test pile TP2 is greater than that of the test pile TP1. And the slope of the axial force distribution curve along the pile body gradually decreases, which is consistent with the research results of Murthy et al. [26] and Cooke et al. [27]; It shows that the side resistance of the pile plays a role from top to end, and the resistance gradually increases along the pile body. The axial force is the smallest at the pile end and the side resistance is the largest. The reason may be: under different penetration depths, as the pile jacking depth gradually increases, the lateral pressure of the soil around the pile gradually increases, Make the bond between the soil particles and the pile body closer, thereby increasing the friction between the pile and the soil, And the process of load transmission down the pile body continuously overcomes the resistance and spreads to the surrounding soil through it. The increase of the pile side resistance makes the axial force decrease larger, so the slope of the pile shaft axial force curve is smaller. In addition, by comparing the two test piles with different pile diameters at the same jacking depth, it can be found that the axial force of the test pile TP1 is larger than that of the test pile TP2, and the two test piles have increased with the penetration depth, the same jacking The axial force at the depth of the pile gradually increases. The reason for the analysis may be that the greater the pile jacking depth, the greater the gravity stress of the soil on the pile body, so the axial force gradually increases, The smaller the pile diameter and the larger the length of the test pile, the smaller the contact area between the pile end and the soil during the pile jacking process, the smaller the compressive rigidity of the test pile, and the smaller the pressure, so the same pile jacking depth test pile TP2 pile The body axial force is smaller than the test pile TP1. At the maximum penetration depth, the axial force of the test pile TP1 is 1.75 kN, and the axial force of the test pile TP2 is 1.48 kN. The test pile TP1 is 18% larger than the test pile TP2. It shows that the pressure of the pile with a large diameter is large, and the axial force of the pile body is also large.
Analysis of the Unit Resistance Result of the Test Pile Side
Assuming that the side resistance of each test pile is evenly distributed along the pipe pile body, the midpoint between the upper and lower adjacent FBG sensors is intercepted as the unit side resistance corresponding to the depth of the section. The unit side resistance distribution diagram of the test piles TP1 and TP2 As shown in Figure 13.
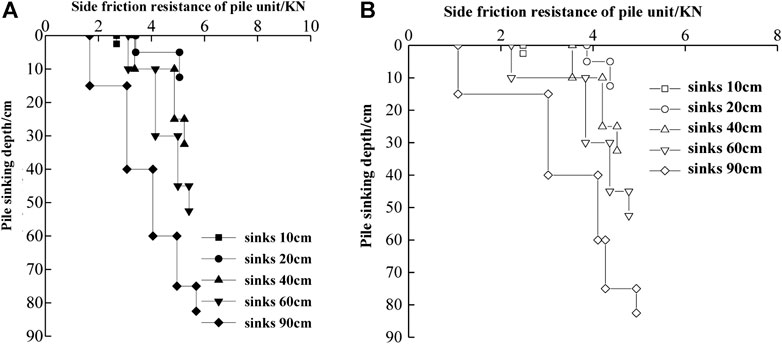
FIGURE 13. Distribution of side resistance of each test pile body. (A) Test pile TP1 (B) Test pile TP2.
t can be seen from Figure 13 that the variation trend of unit side resistance of test piles TP1 and TP2 is similar under different penetration depths, That is: the unit side resistance increases unevenly with the increase of the pile jacking depth, and the overall distribution is that the upper soil layer is small and the lower soil layer is large. The reason may be that in the early stage of pile jacking, the pile disturbs the soil greatly, and the contact between the pile and the soil around the pile is not close. At this time, although the unit side increases, the increase is small, and the penetration depth of the pile gradually increases. The horizontal lateral pressure provided by the soil around the pile is large, so the unit side resistance is gradually exerted, the slope of the curve is large, and the axial force of the pile body reaches the maximum value at the maximum penetration depth. By comparing the distribution of unit side resistance at the same jacking depth of each test pile, it can be found that as the penetration depth increases, the unit side resistance gradually decreases, that is, there is a “degradation effect” in the side resistance [28]. The reason for the analysis may be: the greater the penetration depth, the disturbance of the upper soil layer is much greater than that of the lower soil layer, which increases the contact gap between the soil around the upper pile and the test pile, resulting in a gradual decrease in pile side resistance. The other reason is that before the pile is put into the soil, the pile body is relatively rough; after the pile is put into the soil, the relative roughness is reduced due to the fine clay particles filling the convex and concave surface of the pile body, resulting in a reduction in the friction angle, so the pile side resistance is degraded. And at the same pile jacking depth, the unit side resistance value of the test pile TP1 is larger than that of the test pile TP2. The reason is that the pile diameter of the test pile TP1 is large, so the unit friction area between the pile and the soil is large, so the value is larger. By comparing the distribution of unit side resistance of each test pile at the maximum penetration depth, it is found that the value of test pile TP1 is 5.69 kN, the value of test pile TP2 is 4.94 kN, and the unit side resistance of the test pile TP1 is 15% higher than that of the test pile TP2, which means that the pile-soil contact area is small during the process of pile jacking of the small diameter test pile, so the unit side resistance is low.
Analysis of Stress Behavior During Pile Jacking
In order to study and analyze the total stress state of the two model pipe piles in the process of pile jacking, Figure 14 is drawn.
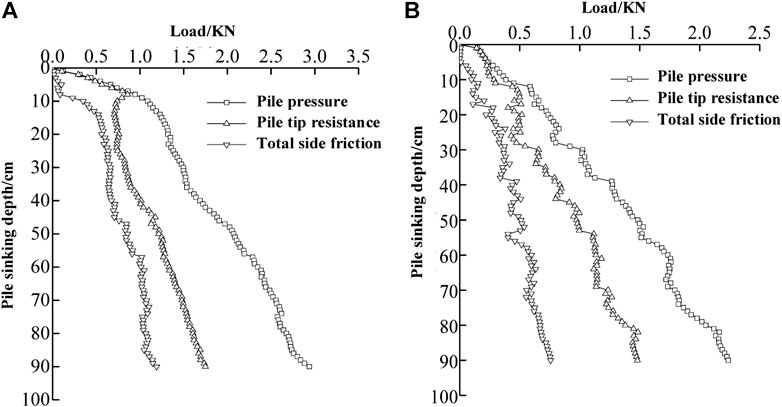
FIGURE 14. Load curve of the entire pile of test piles. (A) Test pile TP1 (B) Test pile TP2.
It can be seen from Figure 14 that the pile pressure and pile end resistance during the whole process of pile jacking of the two test piles gradually increase with the increase of pile jacking depth, which is consistent with the research results of Chan et al. [28]. And when the pile jacking depth is less than 10 cm, the pile pressure is equal to the pile end resistance; it can also be seen from the figure that the overall change trends of the test piles TP1 and TP2 are similar, but in terms of value, the pile pressure, pile end resistance and the pile side resistance of TP1 are larger than the test pile TP2; the main reason is that the test piles TP1 and TP2 have the same length of 1000 mm, and both are closed pipe piles. At the same pile jacking speed, the two test piles Similar trends; However, due to the large diameter of the test pile TP1, during the pile jacking process, the contact area between the pile body and the soil around the pile is large, and the lateral pressure of the soil is large, resulting in a large proportion of the pile side resistance in the pile pressure.
Conclusion
Aiming at the cohesive soil environment, this paper compares the bearing performance of model test piles with different pile diameters through indoor jacked pile tests, and draws the following conclusions:
The pressure, end resistance, and side resistance of the two test piles of different diameters increase approximately linearly with the increase of the pile jacking depth; at the end of the pile jacking, the pressure of the test pile TP1 is higher than that of TP2 31%; in terms of pile end resistance, the test pile TP1 accounted for 59.5% of pile pressure, the test pile TP2’s pile end resistance accounted for 66.2% of pile pressure, and pile end resistance of the two test piles accounted for the percentage of the pile pressure Both exceed 50%, that is, the jacked pile of cohesive soil, and the pile end resistance bears most of the load;
At the end of the pile jacking, the side resistance of the test pile TP1 is 1.19 kN, the pile side resistance of the test pile TP2 is 0.76 kN, and the test pile TP1 is 57% higher than the test pile TP2, It is shown that the diameter is an important factor affecting the exertion of pile side resistance.
The axial force distribution of the test piles TP1 and TP2 are similar. Under different penetration depths, the pile side resistance continues to play from top to end, which causes the pile shaft axial force to continue to decrease as the pile jacking depth increases and the axial force distribution The slope of the curve gradually decreases; at the maximum penetration depth: the axial force of test pile TP1 shaft with a larger pile diameter is 18% larger than the test pile TP2 with a smaller pile diameter.
As the penetration depth increases, the unit side resistance at the same pile jacking depth gradually decreases, that is, there is a “degeneration effect” in the side resistance.
The law is found in homogeneous clay soil with specific moisture content. The variation laws of pile compression force, pile tip resistance, pile shaft axial force and pile lateral friction resistance obtained in this paper can provide reference for the study of pile driving mechanism in homogeneous clay and layered clay.
Data Availability Statement
The original contributions presented in the study are included in the article/Supplementary Material, further inquiries can be directed to the corresponding author.
Author Contributions
Writing: XL; Methodology: YH; Review: YW and SS; Funding: MZ; Supervision: DM.
Funding
This work was supported by the National Natural Science Foundation of China (51708316, 51778312), the China Postdoctoral Science Foundation Funding (2018M632641); the Shandong Provincial Postdoctoral Innovation Program of China (201903043).
Conflict of Interest
The authors declare that the research was conducted in the absence of any commercial or financial relationships that could be construed as a potential conflict of interest.
References
1. Doherty P, Gavin K, Gallagher D. Field investigation of base resistance of pipe piles in clay. Proc Inst Civ Eng - Geotech Eng (2010) 163(1):13–22. doi:10.1680/geng.2010.163.1.13
2. Zhang LM, Wang H. Field study of construction effects in jacked and driven steel H-piles. Géotechnique (2009) 59(1):63–9. doi:10.1680/geot.2008.t.029
3. Han F, Ganju E, Salgado R, Prezzi M. Comparison of the load response of closed-ended and open-ended pipe piles driven in gravelly sand. Acta Geotech (2019) 14(6):1785–803. doi:10.1007/s11440-019-00863-1
4. Paik K, Salgado R. Determination of bearing capacity of open-ended piles in sand. J Geotech Geoenviron Eng (2003) 129(1):46–57. doi:10.1061/(asce)1090-0241(2003)129:1(46)
5. Zhang Z, Wang YH. Examining setup mechanisms of driven piles in sand using laboratory model pile tests. J Geotech Geoenviron Eng. (2015) 141(3):04014114. doi:10.1061/(asce)gt.1943-5606.0001252
6. Lehane BM, Lim JK. Set-up of pile shaft friction in laboratory chamber tests. Int J Phys Modell Geotech (2014) 14(2):21–30. doi:10.1680/ijpmg.13.00017
7. Lehane BM, White DJ. Friction fatigue on displacement piles in sand. Géotechnique (2004) 54(10):645–58. doi:10.1680/geot.2004.54.10.645
8. Klotz EU, Coop MR. An investigation of the effect of soil state on the capacity of driven piles in sands. Géotechnique (2001) 51(9):733–51. doi:10.1680/geot.2001.51.9.733
9. Yuan B, Sun M, Xiong L, Luo Q, Pradhan SP, Li H. Investigation of 3D deformation of transparent soil around a laterally loaded pile based on a hydraulic gradient model test. J Build Eng (2020) 28(3):101024. doi:10.1016/j.jobe.2019.101024
10. Gao L, Gong Y, Liu H, Ji B, Xuan Y, Ma Y. Experiment and numerical study on deformation measurement of cast-in-place concrete large-diameter pipe pile using optical frequency domain reflectometer technology. Appl Sci (2018) 8(9):1450. doi:10.3390/app8091450
11. Tang L, Wang K, Deng L, Yang G, Chen J, Jin L. Axial loading behaviour of laboratory concrete piles subjected to permafrost degradation. Cold Reg Sci Technol (2019) 166:102820. doi:10.1016/j.coldregions.2019.102820
12. Li G, Yu Q, Ma W, Mu Y, Li X, Chen Z. Laboratory testing on heat transfer of frozen soil blocks used as backfills of pile foundation in permafrost along Qinghai-Tibet electrical transmission line. Arabian J Geosci (2015) 8(5):2527–35. doi:10.1007/s12517-014-1432-9
13. Tan M, Zhou N, Cheng Y, Wang J, Zhang W, Zou D. A temperature-compensated fiber Bragg grating sensor system based on digital filtering for monitoring the pantograph–catenary contact force. Proc Inst Mech Eng Part F J Rail Rapid Transit (2018) 233(2):095440971878614. doi:10.1177/0954409718786143
14. Weng X, Zhan J, Lou Y, Zhan J. Application of fiber bragg grating strain sensors to a centrifuge model of a jacked pile in collapsible loess. Geotech Test J (2016) 39(3):20150076. doi:10.1520/gtj20150076
15. Yuan B, Sun M, Wang Y, Zhai L, Luo Q, Zhang X. Full 3D displacement measuring system for 3D displacement field of soil around a laterally loaded pile in transparent soil. Int J Geomech (2019) 19(5):04019028. doi:10.1061/(asce)gm.1943-5622.0001409
16. Pei HF, Yin JH, Zhu HH, Hong CY, Jin W, Xu DS. Monitoring of lateral displacements of a slope using a series of special fibre Bragg grating-based in-place inclinometers. Meas Sci Technol (2012) 23(2):025007. doi:10.1088/0957-0233/23/2/025007
17. Kou HL, Yu F, Liu T. Strain monitoring on PHC pipe piles based on fiber bragg grating sensors. J Perform Constr Facil (2019) 33(2). doi:10.1061/(asce)cf.1943-5509.0001266
18.People’s Republic of China Industry Standards Writing Group. GB/T 50123-1999 geotechnical test method standards. Beijing, China: China Planning Press (1999).
19. Duan N. Mechanical characteristics of monopile foundation in sand for offshore wind turbine. (Doctoral thesis). London (UK): UCL University College London (2016).
20. Ye ZH, Zhou J, Tang SD. Model test on pile bearing behaviors in clay under different pile tip conditions. J Tongji Univ Nat Sci Ed (2009) 37(6):733–7.
21. Yu J, Huang MS, Zhang CR. Model tests and analysis of single piles with two different diameters subjected to cyclic lateral loadings in clay. Rock Soil Mech (2016) 37(4):973–80. doi:10.16285/smj.r.2016.04.009
22.People’s Republic of China Industry Standards Writing Group. Technical specifications for building pile foundation: JGJ 94-2008. Beijing, China: China Building Industry Press (2008).
23. Elkady A, Lignos DG. Full-scale testing of deep wide-flange steel columns under multiaxis cyclic loading: loading sequence, boundary effects, and lateral stability bracing force demands. J Struct Eng (2018) 142(2):04017189. doi:10.1061/(asce)st.1943-541x.0001937
24. Alawneh AS. Modelling load-displacement response of driven piles in cohesionless soils under tensile loading. Comput Geotechnics (2005) 32(8):578–86. doi:10.1016/j.compgeo.2005.11.003
25. Heerema EP. Predicting pile driveability: heather as an illustration of the “friction fatigue theory”. In: SPE European Petroleum Conference. London, UK: Society of Petroleum Engineers (1978), Vol. 1:413–22.
26. Murthy DS, Robinson RG, Rajagopal K. Formation of soil plug in open-ended pipe piles in sandy soils. Int J Geotech Eng (2018) 1–11. doi:10.1080/19386362.2018.1465742
27. Cooke RW, Price G, Tarr K. Jacked piles in London Clay: a study of load transfer and settlement under working conditions. Géotechnique (1979) 29(2):113–47. doi:10.1680/geot.1979.29.2.113
Keywords: fiber bragg grating sensor, jacked pile, different pile diameter, force state, model test
Citation: Wang Y, Sang S, Liu X, Huang Y, Zhang M and Miao D (2021) Model Test of Jacked Pile Penetration Process Considering Influence of Pile Diameter. Front. Phys. 9:616410. doi: 10.3389/fphy.2021.616410
Received: 12 October 2020; Accepted: 26 January 2021;
Published: 08 April 2021.
Edited by:
Liang Ren, Dalian University of Technology, ChinaReviewed by:
Ziguang Jia, Dalian University of Technology, ChinaGuang-Dong Zhou, Hohai University, China
Copyright © 2021 Wang, Sang, Liu, Huang, Zhang and Miao This is an open-access article distributed under the terms of the Creative Commons Attribution License (CC BY). The use, distribution or reproduction in other forums is permitted, provided the original author(s) and the copyright owner(s) are credited and that the original publication in this journal is cited, in accordance with accepted academic practice. No use, distribution or reproduction is permitted which does not comply with these terms.
*Correspondence: Yonghong Wang, aG9uZzc5ODZAMTYzLmNvbQ==