 Lianku Xie
 Daiyu Xiong1
 Qinglei Yu
- 1School of Resources and Civil Engineering, Northeastern University, Shenyang, China
- 2BGRIMM Technology Group, Beijing, China
- 3College of Science, Wuhan University of Science and Technology, Wuhan, China
Long-hole blasting in mines is likely to cause strong vibration of surficial infrastructure, greatly damage the rock mass surrounding goaf near explosion center, and possibly induce blast vibration disasters. In this article, an improved method for multihole blasting seismic wave prediction is proposed to estimate far-field blast vibration. In this method, the fundamental vibration waveforms are firstly measured through the field blast with a single deck at an underground pilot area. The fundamental vibration waveforms are then used to simulate the vibration waveforms for a single-deck case in the production blast by considering the difference of the equivalent distances from the production blast site and the pilot area to the surface measuring point. The vibration waveforms for the single-deck case are linearly superposed to predict the possible vibration waveforms in production blast with multiple long holes and decks according to the designed delay time between decks. Based on these predicted waveforms, the blast vibration can be estimated and the blast design can be optimized to determine a rational delay time in accordance with the vibration limit. The proposed method was applied in pillar recovery of Hongling Polymetallic Mine to optimize the long-hole blast design to manage blast vibration. The rational delay time for the 716 production blast design was recommended as 26 ms. The practice showed that the blast vibration induced by the 716 production blast has been managed, and the predicted and the measured waveforms agree well. It provides an effective method for multihole blast design to control blast vibration.
Introduction
Long-hole blasting has many advantages for mining engineering, such as a large blasting scale, a large volume of caved ore, and lower specific charge. However, if the long-hole blasting is not well controlled, it is likely to cause a strong vibration of surface constructions and greatly disturb the rock mass surrounding goaf. It may even cause issues between local residents and the enterprise, which seriously influences mining production. Therefore, increasing attention has been paid to the influence of blast vibration.
In recent years, many attempts have been made on blast vibration theories, analysis methods, and vibration control. A series of techniques and methodologies have been proposed to manage blast vibration. Yang et al. [1–4] developed a multiple-seed waveform (MSW) vibration model that considered the screening effect of an earlier firing hole on vibration from a later firing hole and the waveform change caused by the distance between the seed waves and the production blast. This model is suitable for near-field and far-field blast vibration simulations. Wu et al. [5] and Zhang et al. [6] systematically studied analytical prediction theory and control methodology of blast vibration. Li et al. [7] studied the influencing factors of blast vibration attenuation and the attenuation law of seismic wave energy. Ling et al. [8, 9] used the time-energy analysis method based on wavelet transforms to separate each deck wave from the measured delay blast vibration signals and obtained a rational millisecond delay time by waveform superposition of these single-deck waves with different delay time to control blast vibration disasters. Agrawal and Mishra et al. [10] proposed a new empirical approach of simplified signature hole analysis (SSHA) for the multihole blast design to predict production blast-induced ground vibrations, up to 15% more accuracy in the prediction of blast vibrations. Zhong et al. [11, 12] and Gao et al. [13] studied the impact of blast vibration duration and millisecond delay time on blast vibration disaster and proposed a vibration duration prediction formula with signal energy and an optimization method of millisecond delay time. Yang et al. [14], Zhao et al. [15], Chen et al. [16], and Qiu et al. [17] studied the time-frequency characteristics of blast vibration waves and the relationship between the energy distribution and frequency band based on linear superposition analysis of the single-deck blast vibration waves. Lou et al. [18], Duan et al. [19], and Zhang et al. [20] analyzed the theoretical hypothesis and technical status of delay blasting and proposed a rational millisecond delay time that should fully use the explosive energy after two-deck (or multideck) blasting. Monjezi et al. [21], Hajihassani et al. [22], Shang et al. [23], and Zhou et al. [24] used artificial neural networks or optimized neural networks to predict ground vibration induced by blasting. Azimi [25] used intelligence committee machines (ICM) based on genetic algorithm to predict the seismic wave intensity generated by bench blasting in an open-pit mine, which is more accurate and reliable than those predicted previously by empirical formulas and neural network models. The above studies about blast vibration theories and vibration reduction provide useful references for controlling the blast vibration effect of underground long-hole blasting.
In mining practice, the underground mining environment and surrounding rock mass are very complex and the delay time is very short, usually tens of milliseconds, so it is difficult to determine a rational delay time for long-hole blasting to control blast vibration. For the above theory and methods, obtaining basic blasting parameters for applications is difficult. In this article, a method for multihole blasting seismic wave prediction was proposed to determine a rational delay time for multihole blasting, which is based on the fundamental vibration waveforms from a single-deck blast test. It was used to guide the blast design for pillar recovery in Hongling Polymetallic Mine to manage blast vibration.
Underground Mining Situation of Hongling Polymetallic Mine
Hongling Polymetallic Mine is a skarn-type deposit mainly composed of Fe and Zn. The stopes are firstly excavated using the open-stope method; then, the pillars are completely recovered using long-hole blasting. The blasted ore is mucked out under overburden. At present, the mine development levels are 755 and 705 m, the production levels are 805 m and above, and exploitation at the 905 m level and above has been finished. The rest of the ore is mainly in barrier pillars and crown pillars. The present mine layout is shown in Figure 1. After many years of mining, numerous mined-out stopes have been exposed for a long time. They become unstable due to stress disturbance and are prone to collapse with weak layers, fracture zones, or structural planes. The vibration of surface constructions is obvious when pillars are completely blasted with long holes. It is necessary to study the control measurements of blast vibration to solve the contradiction between overall blasting ore pillars and blast vibration limit to reduce the harmful effects, which is of great significance for resource recovery, the extension of mine life, and the protection of surface and subsurface constructions.
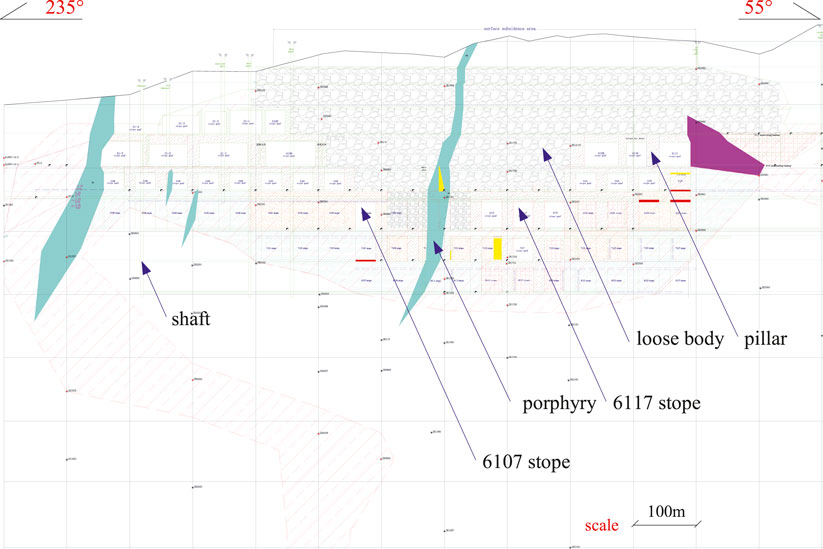
FIGURE 1. Longitudinal projection map of the present mining situation.
Multihole Blasting Seismic Wave Prediction Method
Simulation of the Vibration Waveforms for the Single-Deck Case
When using MSW vibration model [1] in practice, it is very difficult to obtain the basic blast parameters that the model needs and the test work for basic parameters is very much and relatively complicated. In fact, the screening effect of an earlier firing hole on vibration from a later firing hole is not obvious for far-field blast vibration modeling. On this basis, an improved method for multihole blasting seismic wave prediction is proposed based on the fundamental blast vibration waveforms, which contains advantages of the MSW vibration model and improves the shortcomings of the single-seed waveform model that waveforms are superimposed linearly without considering the waveform transformation factors. The fundamental blast vibration waveform data are collected from monitoring the single-deck blast at the underground pilot area. The measuring points are usually set on the ground surrounding surface constructions.
The fundamental vibration waveforms are then used to simulate the vibration waveforms for the single-deck case in the production blast. Firstly, the fundamental vibration waveforms as an input signal with the time domain are processed by fast Fourier transform (FFT) to determine the frequency domain
where
Seismic Wave Prediction in Production Blast with Multiple Holes and Decks
The vibration waveforms for the single-deck case are used by linear superposition to predict the vibration waveforms in production blast at a similar wave propagation path. Production blast vibration waves are considered to be superposed by a certain number of single-deck blast vibration waves, which are mutually interfering and superposed. The superposition process of blast vibration waveforms can be assumed to be represented by a linear system and expressed by the following formula:
where
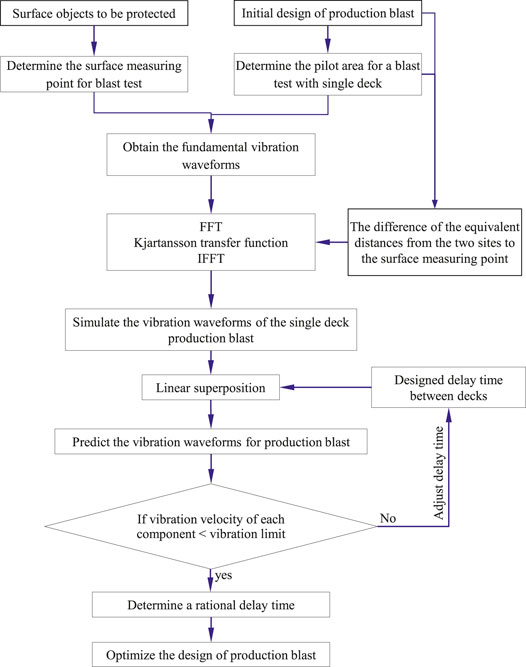
FIGURE 2. Flowchart of seismic wave prediction for multihole blasting.
A program has been developed in MATLAB 7.0 to implement this calculation process automatically. Using this method, we can simulate the blast vibration of multihole blasting with different delay time to find a rational delay time to reduce the harmful effects of the blast. The advantage of this method is that the single-deck blast vibration waveforms used in this method imply the information of blasting conditions, explosive properties, and geological conditions, and using these waveforms to predict the vibration waveforms of multihole blasting does not need a large number of vibration tests.
Charge Weight for Long-Hole Blasting
Vibration Velocity Model of Long-Hole Blasting
The blast vibration velocity of a particle is mainly affected by the charge weight and the distance from the explosion center to the monitoring points. The peak particle vibration velocity (
where
For complicated conditions, the coefficients in Eq. 4 should be determined based on a large amount of data of blast vibration. Therefore, nine blast vibration monitoring tests were carried out using the Mini-Blast I. Six monitoring points were set on a straight line near the surface buildings according to the rule of “dense in the vicinity and sparse in the distance” and three more monitoring points were added underground near the substation and explosive magazine. The arrangement of the monitoring points and the blasting centers is shown in Figure 3.
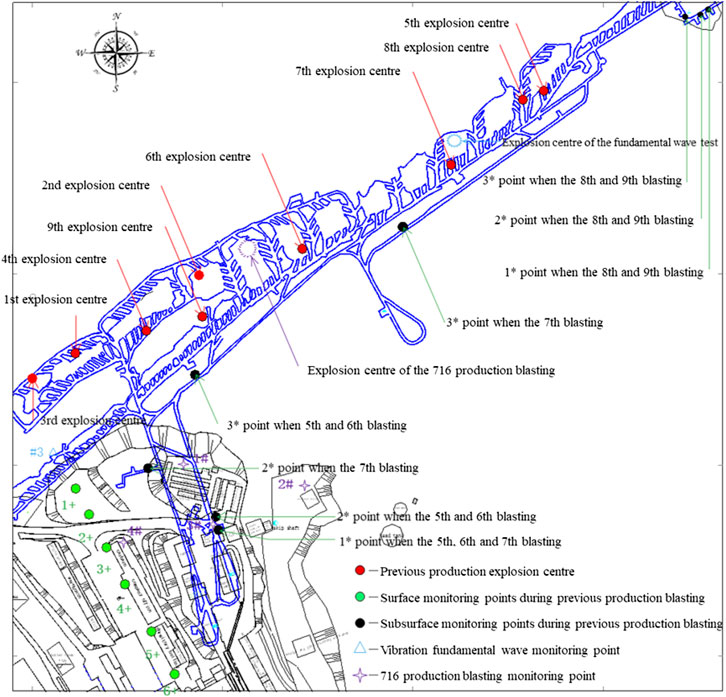
FIGURE 3. Distribution of the monitoring points and explosion centers in the subsurface and on the surface.
Through monitoring, 93 groups of data were collected from nine surface blast vibration tests by a Mini-Blast I blast vibration tester. Using the monitoring data, we fitted the relationship between the scaled distance and the particle vibration velocity. Then, a vibration velocity model including three components (longitudinal L, transverse T, and vertical V) was established. The transverse vibration velocity is dominant and Figure 4 shows the transverse vibration velocity model.
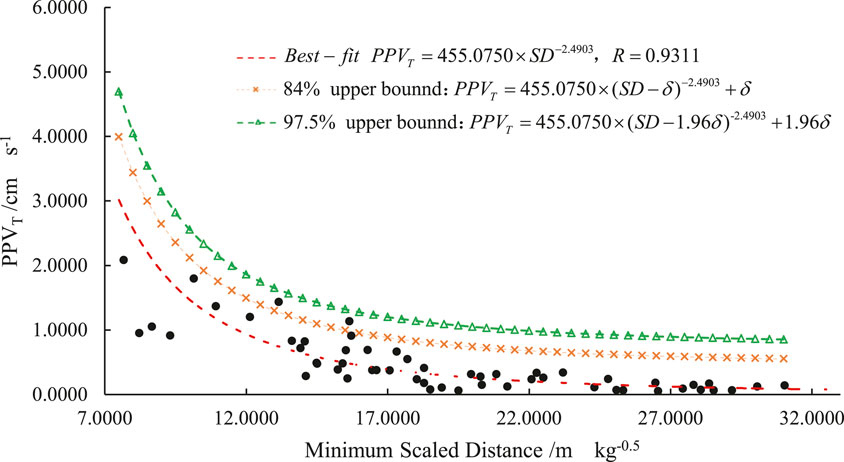
FIGURE 4. The relationship between the transverse component of vibration velocity (PPVT) and the scaled distance.
Maximum Charge Weight Determination
On the ground of Hongling Polymetallic Mine, there exist bunkhouses, office buildings, and skip shafts. According to the Safety Regulations for Blasting (GB6722-2014) (It was proposed and managed by the former State Administration of Work Safety and revised by the former China Society of Engineering Blasting. It is a mandatory standard and was implemented on July 1, 2015.), these buildings are considered general civil buildings. Besides, there are also some makeshift houses. Therefore, The main vibration frequency of the transverse component is allowed to range from 5 to 50 Hz, and the corresponding allowable vibration velocity is 0.45–0.90 cm/s. The upper limit of 0.90 cm/s is selected for the surface buildings of Hongling Polymetallic Mine. Using the transverse vibration velocity model with the upper confidence limit of 84% in Figure 4, we obtained the recommended maximum single-deck charge weight at different distances for the blast of pillar recovery in Hongling Polymetallic Mine, as shown in Table 1. Besides, the vibration limit may be adjusted according to the protection levels of buildings.
TABLE 1. Maximum single-deck charge weight recommended at different distances.
Fundamental Vibration Waveforms Measurement
The Pilot Area Selection and Blast Design
The pilot area for the fundamental blast vibration waveforms stands in a peach-shaped pillar (as shown in Figures 1, 3) of stope No. 6117 at the 805 m level and stope No. 6117 and its neighbor stopes (stope No. 6115 and stope No. 6199) have been mined out. At the 855 m level, the stope No. 5117 and pillars above the pilot area have been exploited, and the overburden has fallen into the bottom of stope No. 5117. At the 755 m level, stope No. 7117 below the pilot area has also been mined out.
In the blast design for the fundamental vibration waveform, the No. 2 rock emulsion explosive is used, fan-shaped long holes are drilled upward, and the pillar is designed to be blasted row by row using the mined-out stope No. 6117 as free surface. The blastholes are set to be two rows and 42 blastholes in total, and the hole depth is about 7–19 m. The primary explosive is placed at the bottom of the holes for a reversed blasting. 42 XA digital electronic detonators are used, which can set the initiation time in the range of 0–6,000 ms. The charge weight of a single deck and the initiation time are shown in Table 2.
TABLE 2. Single-deck charge weight and initiation time.
Five monitoring points surrounding the surface buildings were set to carry out blast vibration tests. The Mini-Blast I was used to record the time-history curves of seismic waves. An appropriate trigger level and acquisition time duration were set by estimating the maximum vibration velocity before the test to collect vibration data accurately. The vibration monitoring point arrangement is shown in Table 3.
TABLE 3. Vibration monitoring point arrangement.
Test Results Analysis
The test data of blast vibration are shown in Table 4. The time-history curves of the seismic wave at monitoring point #3 are shown in Figure 5. According to Table 4 and Figure 5, the maximum vibration velocity occurred at the first wave peak when the single-deck charge weight is 515 kg and the delay time is 0 ms. The blast vibration waveforms of monitoring point #3 with the 3,084 ms duration were selected as the fundamental vibration waveforms because the monitoring point P3 is close to the main building in the mine area. These waveforms were input into the developed program in MATLAB 7.0 to predict vibration waveforms of multihole blast with different delay time.
TABLE 4. The blast vibration data.
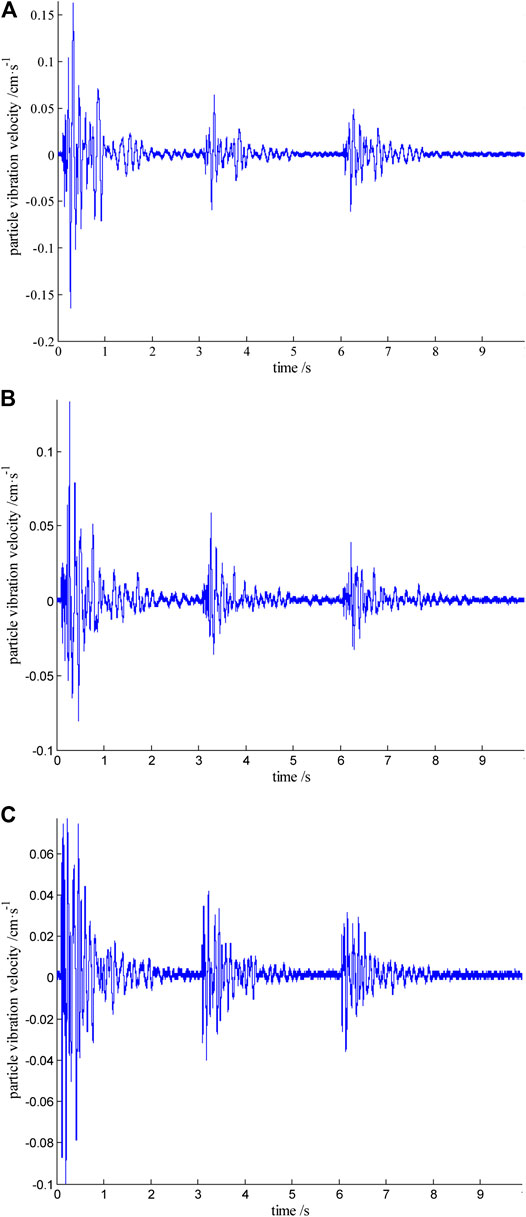
FIGURE 5. Vibration velocity curves at monitoring point #3. (A) Longitudinal component. (B) Transverse component. (C) Vertical component.
Application in Pillar Recovery
General Conditions
The proposed method is applied in a production blast (716 production blast) for pillar recovery, which is located between the crown of stope No. 6107 and the barrier pillar between stope No. 6107 and stope No. 6109 at the 805 m level, as shown in Figures 1, 3. The volume of the crown and barrier pillars is 45306 m3. A blast pattern with long holes was designed to completely blast the pillars. The overall blasting can quickly deal with the mined-out stopes to eliminate the potential safety hazard and also obtain a large amount of ore volume for mucking out at the bottom structure.
The crown and the barrier pillars were uniformly charged and blasted. This fan-shaped blast design had 55 rows and 992 blastholes in total. The No. 2 rock emulsion explosive was charged with 218 decks in total. The total charge weight was 48396 kg, in which the maximum charge weight of a single deck was 498 kg, and 181746 t of ore would be exploited in this blast. XA digital electronic detonators were used for initiation and millisecond delay initiation was implemented for different decks in the same row. Monitoring point #1 at the bunkhouses is the closest point to the center of production blasting, with a straight line distance of 349 m. The maximum charge weight of a single deck was 425 kg, which is less than the permitted 430 kg in Table 1.
Delay Time Optimization
The fundamental blast vibration waveforms, determined in Test Results Analysis, were adopted to predict the blast vibration waveform of four monitoring points for the 716 production blast near the office building using the proposed method. Figure 6 shows the maximum particle vibration velocity of monitoring point #4 predicted under different delay times. According to the category of protection objects and the corresponding allowable particle vibration velocity for safety, the safety factor is considered to be 1.5, so the controlled vibration velocity of monitoring point 4# at the office building is set to be 0.45/1.5 = 0.300 cm/s as the vibration limit (the red line in Figure 6). Based on the analysis of the predicted blast vibration waveforms of monitoring point #4, when the delay time was set to be 20–22, 25–27, 29–33, and 76–86 ms, the peak particle vibration velocity of the three components is less than 0.300 cm/s (see Figure 6). These delay times could be taken as the rational delay time for monitoring point #4. The rational delay time of another three monitoring points is shown in Table 5. Taking the intersection for the delay time of monitoring points #1, #2, #3, and #4, we determined the delay time to be 26̴28 ms and 33 ms for the 716 production blast. The delay time should be as short as possible to improve the size of blasted ore pieces by making full use of the explosive energy [1]. Therefore, the recommended delay time for the 716 production blast was 26 ms.
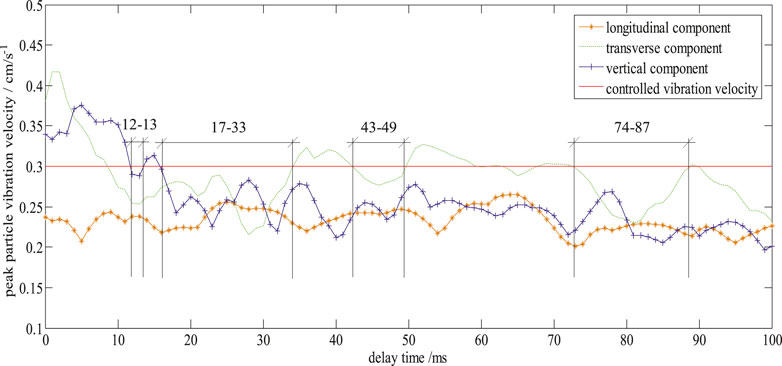
FIGURE 6. The maximum particle vibration velocity of monitoring point #4 under different delay time.
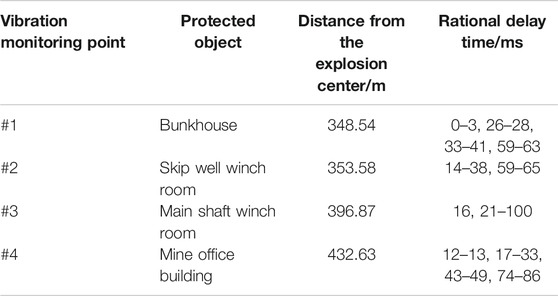
TABLE 5. Rational delay time for the monitoring points.
Comparison Between Predictions and Measurements
Figure 7 shows the comparison o between the predicted and measured vibration waveforms for monitoring point #4. According to the blast vibration monitoring test, the duration of the blast vibration measured at monitoring point #4 in the office building is 7.658 s, and the measured values of the peak particle vibration velocity for the longitudinal, transverse, and vertical components are 0.261 cm/s, 0.251 cm/s, and 0.271 cm/s (Figures 7B,D,F), respectively. The predicted value is basically consistent with the measured value, and the predicted blast vibration waveforms are similar to the measured blast vibration waveforms (Figure 7). The peak particle vibration velocity of other monitoring points is also within the vibration limit (Figure 8). The management of blast vibration disasters is realized.
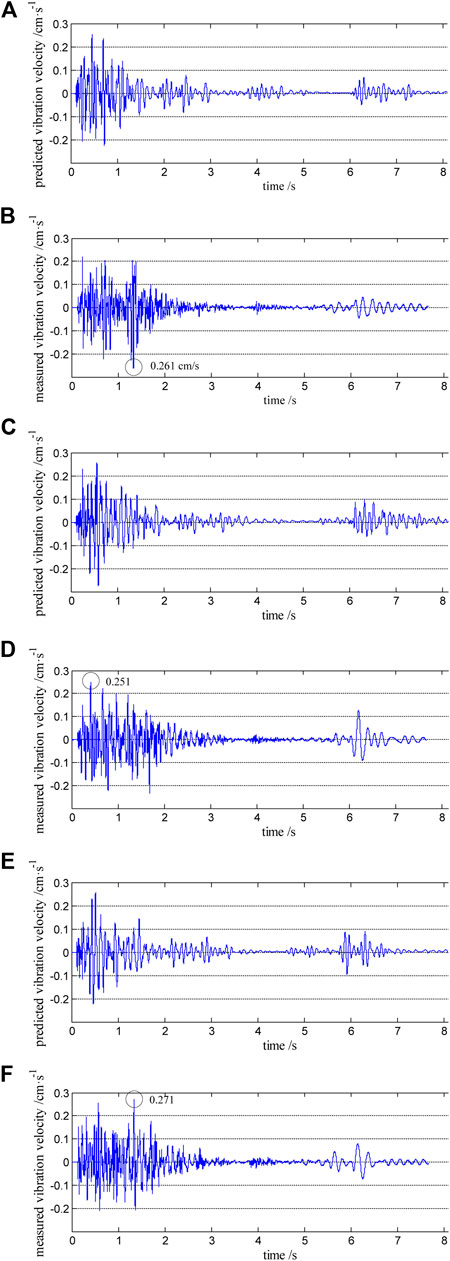
FIGURE 7. Predicted and measured vibration waveforms of monitoring point #4. (A) Predicted longitudinal component. (B) Measured longitudinal component. (C) Predicted transverse component. (D) Measured transverse component. (E) Predicted vertical component. (F) Measured vertical component.
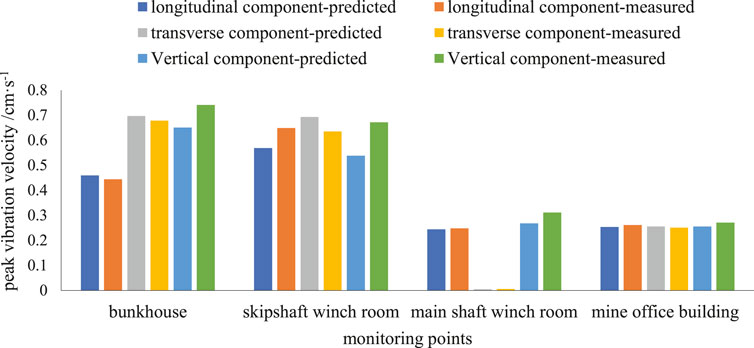
FIGURE 8. Predicted and measured peak vibration velocity at the monitoring points.
Figure 9 shows the comparison between the predicted and measured spectrum maps of monitoring point #4. The dominant frequencies of the predicted vibration wave are within 9–10 Hz, and the energy peaks are distributed in the range of 4–23 Hz (Table 6). The dominant frequencies of the measured vibration wave are within 8–10 Hz and energy peaks are distributed in the range of 4–30 Hz (Table 6.). The predicted and measured frequencies and energy peak agree well, as shown in the figure.
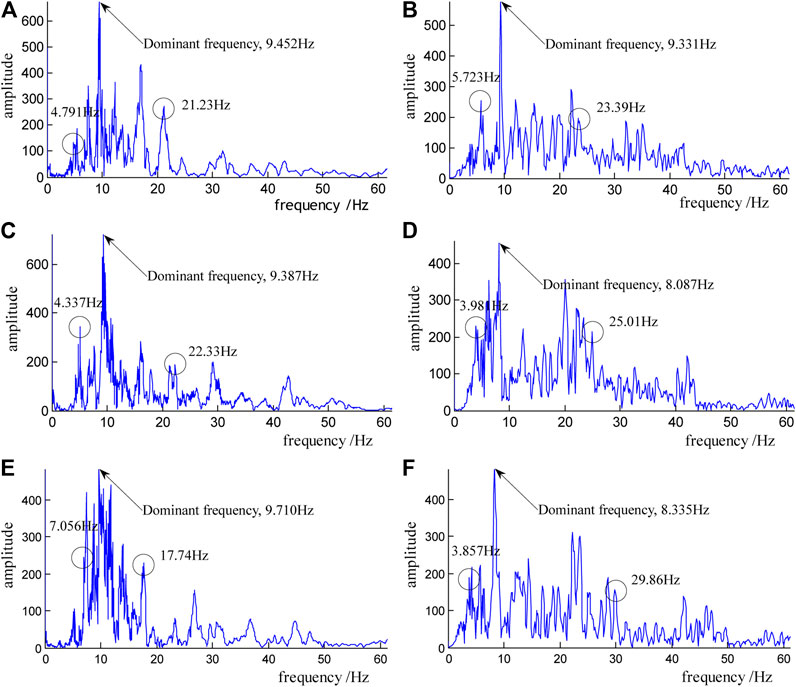
FIGURE 9. Comparison between the predicted and measured spectrum maps of monitoring point #4. (A) Predicted longitudinal component. (B) Measured longitudinal component. (C) Predicted transverse component. (D) Measured transverse component. (E) Predicted vertical component. (F) Measured vertical component.
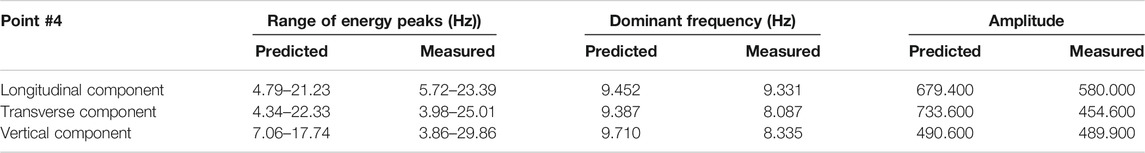
TABLE 6. Comparison of between the predicted and measured amplitude and frequency of point #4.
Conclusion
In this article, an improved method for long-hole blasting seismic wave prediction has been proposed to estimate the far-field blast vibration effect. It is based on the fundamental blast vibration waveforms from a single-deck blast test. The method was used to guide the blast design for pillar recovery of the Hongling Polymetallic Mine. The following conclusions are drawn:
(1) In the proposed method, the blast vibration waveform from a single-deck blast at the pilot area is used as fundamental vibration waveforms and the Kjartansson transfer function is adopted to consider the difference of the blast conditions between the pilot area and production blast area, which make it easy for engineering applications, comparing with the MSW model. This method can predict peak particle vibration velocity, rational delay time between decks, duration of blast vibration, and time-frequency domain information of multihole blasting.
(2) The proposed method was used to optimize the delay time of the blast design for pillar recovery of the Hongling Polymetallic Mine. It is found that the rational delay time has one or more values, even a time range. A minimum value, 26 ms, is selected as the rational delay time for the 716 production blast.
(3) The monitoring data of the 716 production blast showed that the predicted value of the maximum particle vibration velocity is very close to the measured value, the predicted blast vibration waveforms are similar to the measured blast vibration waveforms, and the peak particle vibration velocity stays within the vibration limit. The contradiction between the mass blasting for pillar recovery and the management of blast vibration is effectively solved. It also proved that the proposed method is feasible and reliable, easily applied in engineering practice.
Data Availability Statement
The raw data supporting the conclusions of this article will be made available by the authors, without undue reservation.
Author Contribution
All authors listed have made a substantial, direct, and intellectual contribution to the work and approved it for publication.
Funding
This work was partially supported by the National Natural Science Foundation of China-Joint Fund of Xinjiang (Grant No. U1903216), the National Key Research and Development Program of China (Grant No. 2016YFC0801602), and the National Natural Science Foundation of China (Grant Nos. 51904210 and 52074060).
Conflict of Interest
The author LX was employed by BGRIMM Technology Group.
The remaining authors declare that the research was conducted in the absence of any commercial or financial relationships that could be construed as a potential conflict of interest.
Acknowledgments
The authors also gratefully thank Cheng Wang of Shandong Gold Nonferrous Mining Group Co., Ltd., Wenbo Wang of Wuhan University of Science and Technology, and Zhuo Dong of Dalian University of Technology for their support and help in the process of mine blasting vibration tests and data analysis.
References
1. Yang R, Wiseman T, Scovira DS. Multiple Seed Waveform (MSW) vibration model and some case studies. Ijmme (2011) 3(2):124–40. doi:10.1504/ijmme.2011.042427
2. Yang R, Scovira DS. “A model for near and far-field blast vibration based on multiple seed waveforms and transfer functions,” in 36th Conference explosives and blasting technique, February, 2010, Orlando, Florida (2010).
3. Yang R, Lownds M. Modeling the effect of delay scatter on peak particle velocity of blast vibration using a multiple seed waveform vibration model. Blasting and Fragmentation (2011) 5(3):31–45. https://www.researchgate.net/publication/311923105
4. Yang R, Patterson N, Scovira DS. “An integrated approach of signature hole vibration monitoring and modeling for quarry vibration control. in: 9th international symposium on rock fragmentation by blasting; 2009 Aug; Granada, Spain (2009)–13:17.
5. Wu L, Rao YA, Huang CB. Synthetic study on the methods of blast vibration prediction and control. Hydrogeology Eng Geology (2004) (Suppl. 1):136–40. doi:10.16030/j.cnki.issn.1000-3665.2003.s1.030
6. Zhang ZY, Yang NH, Lu WB, Zhao G, Shi FQ. Progress of blast vibration control technology in China. Blasting (2013) 30(2):25–32. doi:10.3963/j.issn.1001-487X.2013.02.006
7. Li HT, Lu WB, Shu DQ, Yang XG, Yi CP. Study of energy attenuation law of blast-induced seismic wave. Chin J Rock Mech Eng (2010) 29 (Suppl. 1):3364–9. CNKI:SUN:YSLX.0.2010-S1-113
8. Ling TH, Li XB, Wang GY. A study on initiative control of blast vibration damages. Rock Soil Mech (2007) 28(7):1439–42. doi:10.16285/j.rsm.2007.07.029
9. Ling TH, Li XB. Time-energy analysis based on wavelet transform for identifying real delay time in millisecond blasting. Chin J Rock Mech Eng (2004) 23(13):2266–70. doi:10.3321/j.issn:1000-6915.2004.13.026
10. Agrawal H, Mishra AK. An innovative technique of simplified signature hole analysis for prediction of blast-induced ground vibration of multi-hole/production blast: an empirical analysis. J Int Soc Prev Mitigation Nat Hazards (2020) 100(8):111–32. doi:10.1007/s11069-019-03801-2
11. Zhong DW, He L, Cao P, Zhang K. Analysis of blast vibration duration and optimizing of delayed time for millisecond blasting. Explos Shock Waves(2016) 36(5):703–9. doi:10.11883/1001-1455(2016)05-0703-07
12. Zhong DW, He L, Cao P, Zhang K. Experimental study of reducing vibration intensity based on controlled blasting with precise time delay. J China Coal Soc (2015) 40.(Suppl. 1):107–12. doi:10.13225/j.cnki.jccs.2014.1447
13. Gao FQ, Hou AJ, Yang XL, Yang J. Analysis of blast vibration duration based on dimension theory. Metal Mine (2010) 411:143–5. CNKI:SUN:JSKS.0.2010-09-041
14. Yang NH, Zhang L. Blast vibration waveform prediction method based on superposition principle. Explos Shock Waves (2012) 32(1):84–90. doi:10.3969/j.issn.1001-1455.2012.01.015
15. Zhao MS, Liang KS, Yu DY, Ren SF. Effect of decks on time frequency characteristics of blast vibration signals. J China Coal Soc (2012) 37(1):55–61. doi:10.13225/j.cnki.jccs.2012.01.007
16. Chen SH, Yan YF, Qi GF, Zhang X.K, Zhang W. Analysis of influence factors of interference vibration reduction of millisecond blasting. Rock Soil Mech (2011) 32(10):3003–8. doi:10.16285/j.rsm.2011.10.035
17. Qiu XY, Shi XZ, Zhou J, Huang D, Chen X. On vibration reduction effect of short millisecond blasting by high-precision detonator based on HHT energy spectrum. Explos Shock Waves (2017) 37(1):107–13. doi:10.11883/1001-1455(2017)01-0107-07
18. Lou XM, Zhou WH. Selection of delayed time in millisecond blasting of open-pit mining. Nonferrous Metals (Mining Section) (2015) 67(4):82–8. doi:10.3969/j.issn.1671-4172.2015.04.019
19. Duan HF, Hou YB. Mechanism of millisecond blasting in open-pit mine and selection of millisecond time. Nonferrous Metals (Mining Section) (2003) 55(6):24–6. doi:10.3969/j.issn.1671-4172.2003.06.010
20. Zhang GX, Yang J, Lu HW. Research on seismic wave interference effect of millisecond blasting. Eng Blasting (2009) 15(3):17–21. doi:10.3969/j.issn.1006-7051.2009.03.004
21. Monjezi M, Hasanipanah M, Khandelwal M. Evaluation and prediction of blast-induced ground vibration at Shur River Dam, Iran, by artificial neural network. Neural Comput Applic (2013) 22:1637–43. doi:10.1007/s00521-012-0856-y
22. Hajihassani M, Jahed Armaghani D, Marto A, Tonnizam Mohamad E. Ground vibration prediction in quarry blasting through an articial neural network optimized by imperialist competitive algorithm. Bull Eng Geol Environ (2014) 74:873–86. doi:10.1007/s10064-014-0657-x
23. Shang YH, Nguyen H, Bui X-N, Tran Q-H, Moayedi H. A novel artificial intelligence approach to predict blast-induced ground vibration in open-pit mines based on the firefly algorithm and artificial neural network. Nat Resour Res (2019) 29:1–15. doi:10.1007/s11053-019-09503-7
24. Zhou J, Asteris PG, Armaghani DJ, Pham BT. Prediction of ground vibration induced by blasting operations through the use of the Bayesian Network and random forest models. Soil Dyn Earthq Eng (2020) 139, 106390. doi:10.1016/j.soildyn.2020.106390
25. Azimi Y. Prediction of seismic wave intensity generated by bench blasting using intelligence committee machines. Int J Eng (2019) 32(4):617–27. doi:10.5829/IJE.2019.32.04A.21
26. Kjartansson E. Constant Q-wave propagation and attenuation. J Geophys Res (1979) 84:4737–48. doi:10.1029/jb084ib09p04737
Keywords: blast vibration, fundamental wave, seismic wave prediction, vibration velocity model, rational delay time interval
Citation: Xie L, Xiong D, Yang T, He L and Yu Q (2021) A Method for Multihole Blasting Seismic Wave Prediction and Its Application in Pillar Recovery. Front. Phys. 9:569453. doi: 10.3389/fphy.2021.569453
Received: 04 June 2020; Accepted: 28 January 2021;
Published: 25 March 2021.
Edited by:
Longjun Dong, Central South University, ChinaReviewed by:
Yousef Azizi, Institute for Advanced Studies in Basic Sciences (IASBS), IranJian Zhou, Central South University, China
Ju Ma, Central South University, China
Copyright © 2021 Xie, Xiong, Yang, He and Yu. This is an open-access article distributed under the terms of the Creative Commons Attribution License (CC BY). The use, distribution or reproduction in other forums is permitted, provided the original author(s) and the copyright owner(s) are credited and that the original publication in this journal is cited, in accordance with accepted academic practice. No use, distribution or reproduction is permitted which does not comply with these terms.
*Correspondence: Qinglei Yu, eXVxaW5nbGVpQG1haWwubmV1LmVkdS5jbg==