 Nikita Penkov
 Nadezda Penkova
- 1Institute of Cell Biophysics RAS, Federal Research Center Pushchino Scientific Center for Biological Research of the Russian Academy of Sciences, Pushchino, Russia
- 2Institute of Theoretical and Experimental Biophysics, Russian Academy of Sciences, Pushchino, Russia
In this work, based on the method of infrared emission spectroscopy, the study of emission spectra of interferon-gamma (IFNγ) solution in a mixture or surrounded by three low-concentration solutions (IFNγ, antibodies to IFNγ, glycine buffer) or water control was performed. First of all, the solutions of low concentrations themselves were studied. It was shown that low-concentration solutions of IFNγ and antibodies to IFNγ had lower emission intensity in three spectral bands near 800, 1,300 and 2000 cm−1 compared to water control. Glycine buffer solution had a radiation level indistinguishable from that of the control. In this work, the effect of adding these low-concentration solutions to IFNγ (1 mg/ml) was compared to the effect of adding water control to IFNγ. All solutions or water were added in 10% (v/v). It was found that adding each of the three test solutions induced an increase in the radiation intensity of the IFNγ solution in the spectral range of 400–1700 cm−1 (compared to the IFNγ solution with control spike). It was also tested whether the radiation of the studied low-concentration solutions surrounding the IFNγ solution (1 mg/ml) affected the IFNγ radiation. The measurement results were compared to the data obtained for IFNγ surrounded by water control. All three solutions were found to exert a distant effect on the IFNγ solution (1 mg/ml), which was manifested in a decrease in the intensity of its radiation near 1,000 and 1,500 cm−1 compared to the control solution of IFNγ. Thus, the emission spectra of low-concentration aqueous solutions were measured for the first time, and differences in the emission spectra of the IFNγ solution depending on low-concentration additives and the environment were shown. The paper interprets the observed differences and discusses possible mechanisms underlying the observed phenomena.
Introduction
In the paper [1], a new approach to the IR emission spectroscopy of water protein solutions is proposed. It was demonstrated that the approach possessed ultrahigh sensitivity and could be used for a multidimensional analysis of the structure of protein solutions. In this paper, the developed method was used for the study of water protein solutions (interferon-gamma (IFNγ), antibodies to interferon-gamma (Ab to IFNγ)) and glycine buffer (GB) at low concentration. The issue of sensitivity when dealing with low concentrations is of utmost importance, in particular, given the fact that some studies [2–7] have revealed the effects observed in protein solutions at low concentrations that can hardly be explained directly by the properties of protein and the solvent, i.e., water. Furthermore, the present study analyzed the properties of the protein (IFNγ) dissolved in the above-mentioned solutions at low concentration. Such experiment served as an extension to the studies of the impact of low-concentration solutions of substances on high-concentration solutions of the same substances [8–13]. These studies demonstrated that solutions of the substances at ultralow concentration could specifically modify the physical and/or functional properties of the solution of the same substance (or solution of the interacting substance) at high concentration when mixed. As there is a good reason to believe that solutions of the substances have specific electromagnetic emission, by which they can affect other molecules or biological systems [14], we intended to test a hypothesis whether aqueous solution with high concentration could specifically “perceive” the emission of the ambient solution [15] and thus modify its properties. To evaluate the viability of the hypothesis, the properties of IFNγ surrounded by the above-mentioned solutions at low concentrations, but without their interaction, were analyzed (i.e., the distant interaction through a vessel wall was assessed).
The study purpose was to detect emission of the solutions with low concentration of protein and amino acid, to compare emission spectra of various low-concentration solutions and to analyze the effect (direct and distant) of such solutions on the protein (IFNγ).
Materials and Methods
Measurement of Emission Spectra
The study used IR emission spectroscopy. Vacuum IR Fourier transform spectrometer Vertex 80v (Bruker, Germany) was used for the measurement of spectra. The sample emission was recorded using MCT-detector refrigerated with liquid nitrogen. The sample was placed into focus of an external emission source with a black body background at the boiling point of nitrogen. Thus, high sensitivity to sample emission and low level of background emission was achieved. The method is detailed in [1].
Treatment of Emission Spectra
After measurement, emission spectra were treated. Actually, in addition to emission from the samples, background emission also plays a role; it should be taken into account that liquid sample emission may be partially absorbed by the cuvette window. Therefore, each emission spectrum measured was corrected as follows:
Is–corrected emission spectrum of the test solution; Iexp–emission spectrum of solution measured in the cuvette on a cold background (not corrected); Iw–emission spectrum of the cuvette window on a cold background; Ts–the sample transmission spectrum; Tw–the cuvette window transmission spectrum.
Figure 1 illustrates correction of spectrum according to the formula Eq. 1.
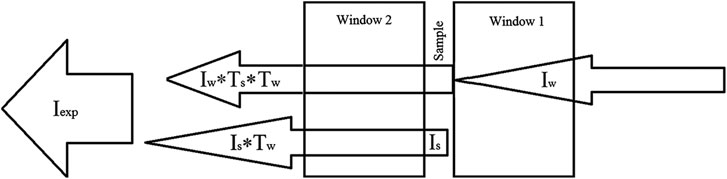
FIGURE 1. Illustration of emission fluxes in the measurement system clarifying corrective transformation Eq. 1.
The term Iw × Ts × Tw of formula Eq. 1 allows the role of background emission passing through window 1 (Iw) weakened by the passage through a sample layer (Iw × Ts) and window 2 (Iw ×Ts × Tw) to be subtracted from the emission spectrum measured. Denominator Tw in transformation Eq. 1 accounts for the fact that sample emission weakens passing through a cuvette output window. The study did not considered the effect of the other two windows from KRS-5 (spectrometer input window and detector window) and spectrometer beam splitter from KBr located between the sample cuvette and the detector (see [1]) to investigate their role in emission and absorption. Emission and absorption of the windows and the beam splitter were not taken into account since all samples were compared in terms of emission spectra measured with their unchanged presence. The transmission spectra of Ts and Tw were measured using the same spectrometer, but in a standard configuration, i.e., placing the cuvette with the sample in the sample compartment.
Test Samples
Aqueous solutions at low concentration were obtained from recombinant human interferon-gamma (IFNγ) (provided blinded by OOO “NPF “Materia Medica Holding”, Russia) with molecular weight of 16.8 kDa in phosphate-buffer saline (pH 7.4), at 0.44 mg/ml; antibodies to IFNγ (Ab) (manufactured by AB Biotechnology Limited, United Kingdom) in glycine buffer (рН 7.2) at 2.3 mg/ml; glycine buffer (GB) (рН 7.2) at 2.3 mg/ml (manufactured by Sigma-Aldrich, United States). The solutions were produced by serial dilution of the initial substances in water with vigorous shaking at each step with the theoretical concentration reduction of at least 1024 times (ultrahigh dilutions). Water subjected to similar dilution process (hereinafter–control water) was used as a control. All dilutions were prepared by OOO “NPF “Materia Medica Holding” in sterile glass vials closed with lids (Glastechnik Gräfenroda, Germany). The solutions were uncoded after the results of the experiment had been obtained.
Furthermore, the effect (direct and distant) of low-concentration solutions on IFNγ in phosphate-buffer saline (pH 7.4) (OOO “NPF “Materia Medica Holding”, Russia) at 1 mg/ml was investigated. The protein at this concentration was stored in polypropylene Eppendorf microtubes.
Deionized water with a conductivity of 18.3 MΩ*cm obtained using a Milli-Q unit (Merck Millipore, Germany) was only used for preparation of solutions and cuvette washing.
Experimental Design
(1) Solutions with ultra-diluted IFNγ, Ab to IFNγ and GB were used to evaluate the potential of emission spectroscopy for studying solutions with very low concentrations. Emission spectra of these solutions were compared to those of control water.
(2) To investigate the direct effect of low-concentration solutions on IFNγ, 10v% of each test sample in polypropylene Eppendorf microtube was added to 20 µL of the IFNγ solution 1 mg/ml. This means that the final IFNγ concentration in the test solutions was 0.9 mg/ml. Emission spectra of such mixtures were compared to emission spectrum of IFNγ, to which 10v% control water was added.
(3) To investigate the distant effect of low-concentration solutions on IFNγ, 10v% milli-Q water in polypropylene Eppendorf microtube was added to 20 µL of the IFNγ solution (1 mg/ml) (IFNγ concentration was 0.9 mg/ml). Thereafter, Eppendorf tube with the IFNγ solution (0.9 mg/ml) was immersed in 5 ml of the test solution (in a Glastechnik Gräfenroda glass vial, Germany) for 1 h, and then IFNγ emission spectrum was recorded. All Spectra Were Measured at 25°С.
Statistical Analysis and Comparison of Samples With Control Water
The measurement of spectra of each sample was made in six replicas, then mean emission spectrum and 95% confidence interval were calculated as frequency functions. Further, sample emission spectra were compared to that of the control to detect statistically significant differences between them. Comparison was performed using the following formula:
where Ms,c(ν) are mean values of the sample and the control water emission intensity at ν frequency, CIs,c is the 95% confidence intervals corresponding to this frequency. The differences are deemed to be potentially significant at the estimated value of d exceeding 0 (i.e., where confidence intervals do not overlap). As the data are frequency function, graphical form of function d(ν) presentation is easy to use for their comparison.
Results
Further, the term “statistical significance” denotes the positive result of formula Eq. 2, and not the smallness of the probability of an accidental occurrence of such or even more extreme value. Though emission spectra were measured within wave numbers from 400 to 7,500 cm−1, statistically significant differences between the spectra compared could not be detected in any of the study cases for wave numbers >2,300 cm−1. Therefore, spectra >2,400 cm−1 are not presented.
Figure 2A shows emission spectra of three study solutions. Emission spectra clearly show two main maximums corresponding to libration (∼700 cm−1) and bending (∼1,650 cm−1) bands of water emission. Description of the nature of these emission bands is given in [1] demonstrating that emission occurs due to the water molecule transfer from excited vibration levels with non-zero population at this temperature to the ground level. In addition to the two bands specified being typical of all aqueous solutions, one can see the differences in the spectra shown. Above all, on average, the control spectrum is more intensive compared to the other three spectra. Figure 2B shows paired comparisons of the test solutions with the control solution in terms of their emission spectra according to formula (2).
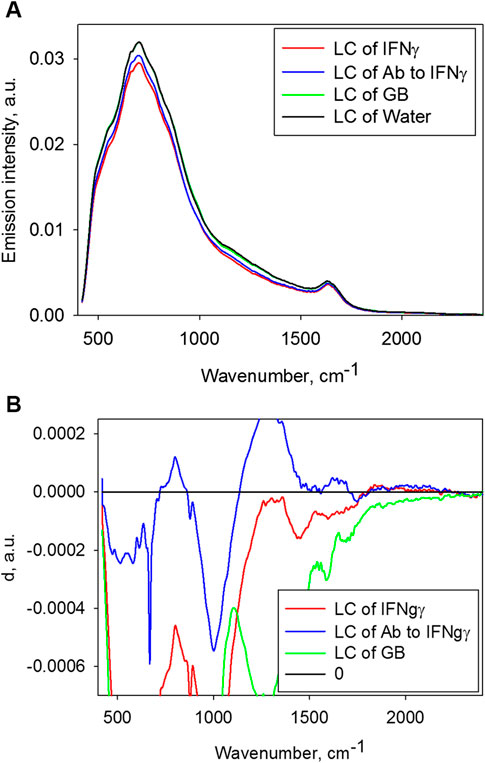
FIGURE 2. (A) Emission spectra of the test samples. (B) Comparison of emission spectra of the test solutions with the control according to formula (2).
Therefore, though the typical protein bands were not detected, the presence of the substance in starting solutions (up to the reduction in their concentration by serial dilution with active mixing) generally reduced emission intensity (Figure 2A). As for the statistically relevant differences between the-low concentration solutions and control water, the Ab to IFNγ solution shows significantly lower emission intensity close to 800, 1,250, 1,600 and 2000 cm−1, the IFNγ solution–at about 2000 cm−1, which is shown in Figures 2A and 2B. Thus, the solutions of both study proteins demonstrated reduced emission intensity at 2000 cm−1, which is not expressed in the case of control water. In addition, statistically significant differences between the solution with low GB concentration and control water were not detected.
Figure 3A shows emission spectra of IFNγ 1 mg/ml supplemented with 10v% test solutions or control. In this case, it is noteworthy that control water emission spectrum has lower intensity compared to the spectra of three samples. This means that IFNγ apparently reacts specifically to very low concentrations of the substances, and its conformation is modified in a way suggesting an increase in emission. Figure 3B shows their paired comparison. Interestingly, solutions with low concentrations of both proteins increase IFNγ emission by 1,200 cm−1 compared to the effect of control water, whereas GB does not cause such changes. Despite this, all three study solutions of the substances at low concentration increase IFNγ emission within 400–1750 cm−1, with maximum peaks of about 750 and 1700 cm−1. This is due to glycine (including the one contained in proteins) or due to amino acids or nonspecific role of any substance in starting solution subject to serial dilution.
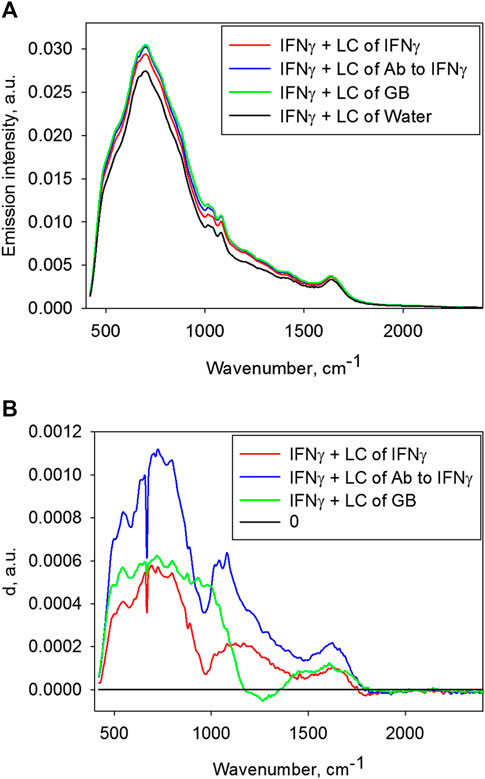
FIGURE 3. (A) Emission spectra of the IFNγ 1 mg/ml solutions supplemented with the 10v% test samples or the control. (B) Paired comparisons of emission spectra of the IFNγ 1 mg/ml solutions supplemented with the 10v% test samples for detecting statistically significant differences from the IFNγ 1 mg/ml solution supplemented with the control according to formula (2).
Figure 4A shows emission spectra of the IFNγ 1 mg/ml solution after its incubation surrounded by the test solutions and control water (distant exposure). Figure 4B shows paired comparisons of emission spectra of these IFNγ solutions compared to IFNγ surrounded by control water.
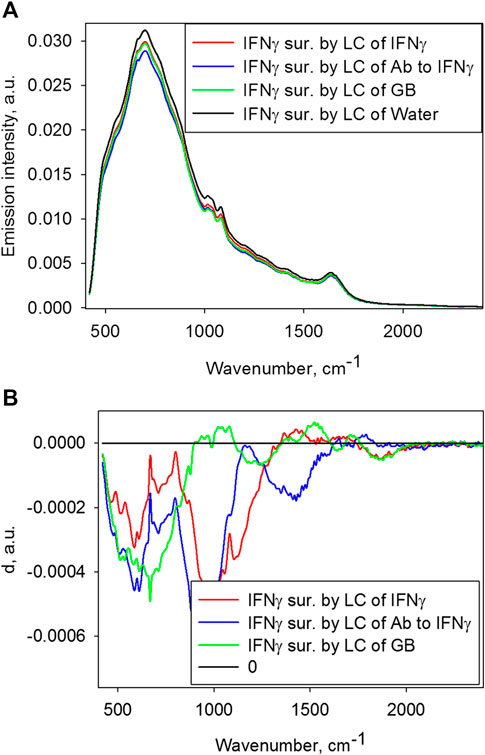
FIGURE 4. (A) Emission spectra of the IFNγ 1 mg/ml solutions surrounded by each test sample and the control. (B) Paired comparisons of emission spectra of the IFNγ 1 mg/ml solutions surrounded by the test samples and the control for detecting statistically significant differences according to formula (2).
Generally, IFNγ exposure to all three low-concentration solutions with reduces IFNγ emission intensity compared to IFNγ exposure to control water; this is apparently due to modified energy of its condition and, therefore, its conformation.
According to Figure 4B, there is a difference between the non-contact effect of all three solutions on IFNγ and the effect of control water on IFNγ, and different solutions exhibit effects of various frequencies in spectra.
Discussion
Figures 2B, 3B, and 4B provide evidence of differences in emission spectra of the samples obtained using low-concentration solutions of IFNγ, Ab, GB and control water. Differences in emission spectra may be due to differences in composition or structure of emitting object, or difference in the energy of the measured systems (e.g., temperature differences or forced modification in level population). Temperature of solutions was stabilized with high accuracy, therefore, differences in energy are unlikely.
Let us consider a variant of difference in 1) composition and 2) structure of the test solutions. 1) There seem to be no any differences between the composition of solutions at very low concentrations (with ultrahigh dilution of the starting substance up to 1024 times) and water prepared using a similar dilution technique (control water) as the starting substance is no longer found in solutions with very low concentrations. However, as shown in the study [16] where the starting solution contains a protein component, the concentration of the starting components in the solution obtained by serial dilution might not correlate with the estimated concentrations due to flotation. Such solutions may contain residual amounts (traces) of baseline proteins that may become denatured due to dilutions with intensive succussion. This, in turn, may result in peculiarities of emission spectra not fully correlating with the starting spectra of proteins in native condition. 2) Another reason for the differences between all test solutions may be the modification of properties of the water exposed to intensive mechanical exposure. Long-lasting effects after such exposure were demonstrated in the studies [17, 18]. Apparently, in the presence of additional molecules in water and under mechanical impact, water structuredness and its physical-chemical properties are generated differently compared to pure water. However, to make sure that the differences in the emission spectra are due to these reasons, additional investigations are required to determine typical changes in emission spectra of solutions exposed to mechanical effects and in the presence of denatured forms of protein.
Fundamental interpretation is also possible. First, it should be stressed that we are dealing with the mid-IR range, the frequencies of which correspond to intramolecular or intermolecular vibrations of molecules. As emission spectra of water protein solutions are measured, emission bands of water and protein molecules may be expected. The whole range of frequencies analyzed may be divided into intervals, each of which corresponds to specific types of vibrations. Several typical frequency intervals may be distinguished for water molecules (Figure 5 in [1]): librational vibrations 400–1,500 cm−1, bending vibrations 1,500–1800 cm−1 and combination of librational + bending vibrations 1900–2,600 cm−1. Also, the range from 500 to 1700 cm−1 records numerous typical emission bands of protein molecules (Figure 8 in [1]). Thus, differences recorded in emission spectra at certain frequencies may be attributed to a specific type of molecular changes. High emission intensity of one sample compared to another one suggests higher population of levels at the corresponding frequencies and vice versa.
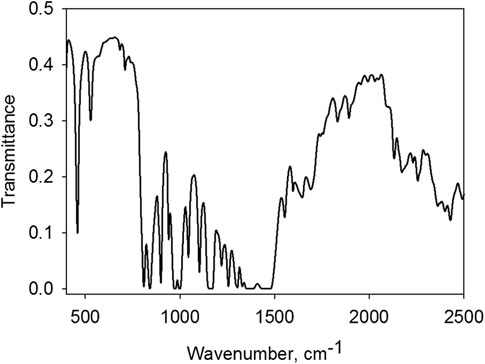
FIGURE 5. Tube wall transmission (polypropylene).
Based on this, we may attempt to interpret the detected differences in the sample emission spectra. Figure 2 suggests that low-concentration solution of Ab to IFNγ shows lower emitting power compared to control water. Therefore, the Ab to IFNγ solution may show lower population of levels found in energy region of librational and bending vibrations of water molecules. The Ab to IFNγ solution also demonstrates lower emitting power within the band of approximately 2000 cm−1, which is consistent with lower population of simultaneously bending and librational water levels. The latter confirms two individual conclusions on lower population of each of these levels. As for solution with low concentration of IFNγ, lower population of bending and f librational + bending levels may also be concluded, and no significant reduction in librational levels has been reported. This may be due to wide variance and inadequate number of repeated experiments.
As shown in Figure 3, addition of each 10% (v/v) sample to the IFNγ 1 mg/ml solution results in increased emission intensity within 400–1800 cm−1 compared to water spike. This means that if we continue to use the proposed interpretation, all three spikes increase population of librational and bending levels. It is noteworthy that addition of low-concentration protein solutions (IFNγ and Ab) results in an expressed increase in population within 1,000–1,100 cm−1 typical of protein (see Figure 8 in [1]), i.e. these two solutions somehow activate intramolecular vibrations in protein molecules. Meanwhile, GB solution did not cause such increased population, i.e. activation of intramolecular protein vibrations. The previously shown effect of solutions with low concentrations on the properties of the starting substance or a substance interacting with the starting one (see the Introduction, Refs. [8–13]) was confirmed in this study.
Nonetheless, the explanations do not provide a clear insight into the mechanisms but rather transfer discussion from the issue of intensity differences to the issue of vibration level population differences. Generally, discussing the modification of properties of solutions due to high dilutions features the generation of nano-sized objects [19, 20] possessing some properties. In this case, it is difficult to present such structures characterized by higher or lower population of vibration levels of water or protein molecules. Apparently, the matter may deal with a new theory of aqueous solutions that might explain redistribution of energies between vibration levels of the molecules.
The most uncommon result was obtained for IFNγ solutions exposed to the distant effect of other solutions. Figure 4 demonstrates changes in emission spectra of the IFNγ solution secondary to environmental impact of each of the three test solutions (IFNγ, Ab to IFNγ, GB) compared to control water. IFNγ solution surrounded by solution with ultralow IFNγ concentration shows reduced emission within 1,300–1700 cm−1, which may be attributed to environmentally reduced population of vibration levels of protein molecules and/or librational and bending levels of water. IFNγ solution surrounded by solution with low concentration of Ab to IFNγ shows lower emission intensity within 1,600–1800 cm−1, which may testify to lower population of levels of bending water vibrations. IFNγ solution surrounded by solution with low GB concentration shows reduced emission intensity at about 1,000, 1,500 and supposedly 2,200 cm−1, which, in terms of proposed interpretation, implies reduced population of librational and bending levels, and their combination. Therefore, all test solutions impact IFNγ solution; however, ultrahigh dilutions of IFNγ modify population of the protein molecule levels, while other solutions cause changes in level populations of the water molecules only. In other words, IFNγ acted as a molecule “sensitive” to surrounding by high dilution of the original substance, which is generally consistent with the conclusions made in [15]. We suggest that distant action may play a certain role in the development of the modifying effect of high dilutions on the original substance. Such effect is described in [8–13].
The principal issue in interpretation is to understand how solutions without direct mixing may affect each other. As the study demonstrates emission in solutions with very low concentrations, we may suggest that emission of one solution can modify the properties of another one resulting in changes in its emission. Furthermore, the literature reports that THz excitation of water emission is induced by impulse laser (coherent electromagnetic field) [21]. However, such hypothesis is inconclusive as spectral transmission of the tube is relatively low in the region of emission of aqueous solutions (Figure 5); in addition, at such absorption, the tube material emits as a gray body. Nevertheless, it is noteworthy that all IFNγ samples tested were placed into similar tubes, and while all the effects of low-concentration solutions on IFNγ were compared to the effect of control water on IFNγ, the role of proper emission of the tubes was leveled out, and the differences in emission between IFNγ solutions in various environments were recorded by
It should also be noted that the differences shown in Figure 4B are relatively small compared to Figures 2B and 3B. Therefore, it is unclear whether the scope of statistical data is sufficient and whether the differences reported could be random outliers. These data are the most difficult to explain, so further investigation could be required. At any rate, even small changes in the patterns described are promising in revealing the previously unknown mechanisms of interactions in aqueous solutions. Eventually, it may be of interest in a wide range of scientific disciplines from fundamental physics to applied fields, such as medicine.
In this work, the emission spectra of solutions were measured in the mid-IR frequency range. It is obvious that the wider the spectral range, the more complete information on the substance structure can be obtained [22]. The expansion of the spectral range toward higher frequencies is problematic due to the need to heat the sample [1]. The expansion into the low-frequency region (far IR range) is quite possible. To do this, one only needs to select the appropriate spectral elements: windows and a high-performance beam splitter, as well as a cooled detector, such as a silicon bolometer. Far-IR emission spectra can provide additional information on the intermolecular structure and hydrate shells [23–25].
Conclusion
This paper is the first one to describe the measurement of emission spectra of ultrahigh dilutions of protein (IFNγ, Ab to IFNγ) and amino acid (glycine) solutions (the so-called ‘low concentrations’). It was demonstrated that there were differences in emission spectra of these solutions compared to control water. The differences were detected in emission spectra of the IFNγ 1 mg/ml solutions spiked with solutions with low concentrations compared to similar IFNγ solutions spiked with control water and between each other. The Difference was found between emission spectra of IFNγ surrounded by low-concentration solutions s and emission spectra of IFNγ surrounded by control water; meanwhile, emission spectrum depends on specific surrounding solution. Therefore, it was demonstrated that IFNγ was sensitive to spiking of solution with low IFNγ or Ab to IFNγ concentrations produced by ultrahigh dilution technology as well as to distant effect of the same solution. Three potential explanations for the differences in emission spectra of the solutions were proposed: the effect of dissolution technique on structural properties of the solution; the changes in population of vibration levels of water and protein molecules; the effect of emission of one solution on the properties of the other one. However, further investigation is required for conclusive determination of the actual mechanisms underlying the processes observed.
Data Availability Statement
The raw data supporting the conclusions of this article will be made available by the authors, without undue reservation.
Author Contributions
Conceptualization, NiP; methodology, NiP; software, NiP and NaP; validation, NiP; formal analysis, NiP and NaP; investigation, NiP and NaP; resources, NiP; data curation, NiP; writing—original draft preparation, NiP and NaP; writing—review and editing, NiP; visualization, NiP and NaP; supervision, NiP; project administration, NiP; funding acquisition, NiP All authors have read and agreed to the published version of the manuscript.
Funding
The authors disclosed receipt of the following financial support for the research, authorship, and/or publication of this article: the study was funded by OOO “NPF “MATERIA MEDICA HOLDING”, Moscow, Russia.
Conflict of Interest
The authors declare that they personally and independently conducted research on the contract between Institute of Cell Biophysics RAS, Federal Research Center “Pushchino Scientific Center for Biological Research of the Russian Academy of Sciences” and OOO “NPF “Materia Medica Holding”. The solutions at low concentration (ultrahigh dilutions) were provided by OOO “NPF “Materia Medica Holding”. Different versions of highly diluted antibodies to IFN-γ are the substances (single or one among other components) for commercial drugs produced or produced and marketed by OOO “NPF “MATERIA MEDICA HOLDING”. Patents on this substance belong to OOO “NPF “MATERIA MEDICA HOLDING”.
Acknowledgments
This work was conducted using the equipment of Optical Microscopy and Spectrophotometry core facility, ICB RAS, Federal Research Center “Pushchino Scientific Center for Biological Research of the Russian Academy of Sciences” (http://www.ckp-rf.ru/ckp/670266/).
References
1. Penkov N, Penkova N. Measurement of the emission spectra of protein solutions in the infrared range. Description of the method and testing using solution of human interferon gamma as an example. Front Phys (2020) 8: 615917. doi:10.3389/fphy.2020.615917
2. Tarasov SA, Gorbunov EA, Don ES, Emelyanova AG, Kovalchuk AL, Yanamala N, et al. Insights into the mechanism of action of highly diluted biologics. J Immunol (2020) 205(5):1345–54. doi:10.4049/jimmunol.2000098
3. Kardash EV, Ertuzun IA, Khakimova GR, Kolyadin AN, Tarasov SA, Wagner S, et al. Dose-response effect of antibodies to S100 protein and cannabinoid receptor type 1 in released-active form in the light-dark test in mice. Dose Response (2018) 16(2):1559325818779752. doi:10.1177/1559325818779752
4. Don ЕS, Emelyanova AG, Yakovleva NN, Petrova NV, Nikiforova MV, Gorbunov EA, et al. The phenomenon of released-activity. Reply on comment on Don et al.: dose-dependent antiviral activity of released-active form of antibodies to interferon-gamma against influenza A/California/07/09(H1N1) in murine model. J Med Virol (2017) 89(5):1127–30. doi:10.1002/jmv.24759
5. Gariboldi S, Palazzo M, Zanobbio L, Dusio GF, Mauro V, Solimene U, et al. Low dose oral administration of cytokines for treatment of allergic asthma. Pulm Pharmacol Therapeut (2009) 22(6):497–510. doi:10.1016/j.pupt.2009.05.002
6. Castiglioni S, Miranda V, Cazzaniga A, Campanella M, Nichelatti M, Andena M, et al. Femtograms of interferon-γ suffice to modulate the behavior of jurkat cells: a new light in immunomodulation. Int J Mol Sci (2017) 18(12):2715. doi:10.3390/ijms18122715
7. Uberti F, Morsanuto V, Ghirlanda S, Ruga S, Clemente N, Boieri C, et al. Highly diluted acetylcholine promotes wound repair in an in vivo model. Adv Wound Care (2018) 7(4):121–33. doi:10.1089/wound.2017.0766
8. Penkov NV. Peculiarities of the perturbation of water structure by ions with various hydration in concentrated solutions of CaCl 2, CsCl, KBr, and KI. Phys Wave Phenom (2019) 27:128–34. doi:10.3103/S1541308X19020079
9. Pschenitza M, Gavrilova ES, Tarasov SА, Knopp D, Niessner R, Epstein OI. Application of a heterogeneous immunoassay for the quality control testing of release-active forms of diclofenac. Int Immunopharm (2014) 21:225–30. doi:10.1016/j.intimp.2014.04.029
10. Aguejouf O, Malfatti E, Belon P, Doutremepuich C. Time related neutralization of two doses acetyl salicylic acid. Thromb Res (2000) 100:317–23. doi:10.1016/s0049-3848(00)00336-4
11. Marotta D, Marini A, Banaudha K, Maharaj SV, Jonas WB. Nonlinear effects of glutamate and KCl on glutamate toxicity in cultured rat cerebellar neurons. Int J Neurosci (2003) 113:491–502. doi:10.1080/00207450390162245
12. Belougne-Malfatti E, Aguejouf O, Doutremepuich F, Belon P, Doutremepuich C. Combination of two doses of acetyl salicylic acid: experimental study of arterial thrombosis. Thromb Res (1998) 90:215–21. doi:10.1016/s0049-3848(98)00051-6
14. De Ninno A, Pregnolato M. Electromagnetic homeostasis and the role of low-amplitude electromagnetic fields on life organization. Electromagn Biol Med (2017) 36:115–22. doi:10.1080/15368378.2016.1194293
15. Alberto F, Mario L, Sara P, Settimio G, Antonella L. Electromagnetic information delivery as a new tool in translational medicine. Int J Clin Exp Med (2014) 7:2550–6.
16. Bunkin NF, Shkirin AV, Ninham BW, Chirikov SN, Chaikov LL, Penkov NV, et al. Shaking-induced aggregation and flotation in immunoglobulin dispersions: differences between water and water-ethanol mixtures. ACS Omega (2020) 5:14689–701. doi:10.1021/acsomega.0c01444
17. Penkov NV. Temporal dynamics of the scattering properties of deionized water. Phys Wave Phenom (2020) 28:135–9. doi:10.3103/S1541308X20020132
18. Gudkov SV, Penkov NV, Baimler IV, Lyakhov GA, Pustovoy VI, Simakin AV, et al. Effect of mechanical shaking on the physicochemical properties of aqueous solutions. Int J Mol Sci (2020) 21:8033. doi:10.3390/ijms21218033
19. Chikramane PS, Kalita D, Suresh AK, Kane SG, Bellare JR. Why extreme dilutions reach non-zero asymptotes: a nanoparticulate hypothesis based on froth flotation. Langmuir (2012) 28:15864–75. doi:10.1021/la303477s
20. Bunkin NF, Shkirin AV, Penkov NV, Chirikov SN, Ignatiev PS, Kozlov VA. The physical nature of mesoscopic inhomogeneities in highly diluted aqueous suspensions of protein particles. Phys Wave Phenom (2019) 27:102–12. doi:10.3103/S1541308X19020043
21. Jin Q, Yiwen E, Williams K, Dai J, Zhang XC. Observation of broadband terahertz wave generation from liquid water. Appl Phys Lett (2017) 111:071103. doi:10.1063/1.4990824
22. Fiedler J, Boström M, Persson C, Brevik I, Corkery R, Buhmann SY, et al. Full-spectrum high-resolution modeling of the dielectric function of water. J Phys Chem B (2020) 124:3103–13. doi:10.1021/acs.jpcb.0c00410
23. Penkov NV, Shvirst NE, Yashin VA, Fesenko EE. [On singularities of molecular relaxation in water solutions]. Biofizika (2013) 58:933–41. doi:10.1134/S000635091306016X
24. Penkov N, Yashin V, Fesenko E, Manokhin A, Fesenko E. A study of the effect of a protein on the structure of water in solution using terahertz time-domain spectroscopy. Appl Spectrosc (2018) 72:257–67. doi:10.1177/0003702817735551
Keywords: infrared, infrared spectroscopy, emission spectroscopy, protein solutions, aqueous solution, emission of protein, emission of solution, interferon-γ
Citation: Penkov N and Penkova N (2020) Analysis of Emission Infrared Spectra of Protein Solutions in Low Concentrations. Front. Phys. 8:624779. doi: 10.3389/fphy.2020.624779
Received: 01 November 2020; Accepted: 26 November 2020;
Published: 18 December 2020.
Edited by:
Nikolai F. Bunkin, Bauman Moscow State Technical University, RussiaReviewed by:
Iver Hakon Brevik, Norwegian University of Science and Technology, NorwayMartiros Khurshudyan, Tomsk State University of Control Systems and Radio‐electronics, Russia
Copyright © 2020 Penkov and Penkova. This is an open-access article distributed under the terms of the Creative Commons Attribution License (CC BY). The use, distribution or reproduction in other forums is permitted, provided the original author(s) and the copyright owner(s) are credited and that the original publication in this journal is cited, in accordance with accepted academic practice. No use, distribution or reproduction is permitted which does not comply with these terms.
*Correspondence: Nikita Penkov, bnZwZW5rb3ZAcmFtYmxlci5ydQ==