 Ilya V. Baimler
 Andrey B. Lisitsyn2
 Dmitriy A. Serov
 Sergey V. Gudkov
- 1Prokhorov General Physics Institute of the Russian Academy of Sciences, Moscow, Russia
- 2V. M. Gorbatov Federal Research Center for Food Systems of Russian Academy of Sciences, Moscow, Russia
- 3Institute of Cell Biophysics of the Russian Academy of Sciences, PSCBR RAS, Moscow, Russia
The study investigates the spectra of acoustic signals generating during the optical breakdown of colloidal solutions of iron nanoparticles. A characteristic form of the acoustic spectrum has been experimentally established, a distinctive feature of which is the presence of signals from an expanding and collapsing gas bubble. It is shown that the amplitude and area of these acoustic signals depend on the concentration of nanoparticles in the irradiated colloid. The effect of the concentration of nanoparticles on the bubble lifetime corresponding to the time interval between the acoustic spectrum signals corresponding to the birth and cavitation of a gas bubble has been studied.
Introduction
Almost simultaneously with the emergence of the first works on the study of optical breakdown in gases, works devoted to the acoustics of optical breakdown began to appear [1–3]. The study of shock waves continued after the start of the study of optical breakdown in liquid media [4–6]. The main distinguishing feature of optical breakdown in liquid media should be considered the intense interaction of the breakdown plasma with the environment. On acoustic spectra, this interaction manifests itself in the form of signals of cavitation gas bubbles formed after the liquid boils up. In particular, the moments of the formation of cavitation bubbles and the moments of their collapse are quite well distinguishable in the acoustic spectrum. The processes of formation of cavitation bubbles and their propagation in a liquid during laser breakdown are also well investigated [7–9]. In the existing models describing the life of cavitation bubbles, it is assumed that the size of the bubble from the moment of its birth increases monotonically until a certain moment, and then sharply decreases [10–12]. The lifetimes of cavitation bubbles are usually tens of microseconds, and their sizes vary within a few microns. It is known that the dynamics of cavitation bubbles is influenced by various parameters, including the temperature of the liquid [13] and its viscosity [14]. However, it is still unknown how the impurities dissolved in the liquid affect the formation and life of cavitation bubbles.
In recent studies on the acoustics of laser breakdown, it was shown that, in addition to cavitation bubbles, the concentration of impurities dissolved in a liquid has a significant effect on the shape of the acoustic spectrum [15]. At present, the acoustic spectra of optical breakdown on individual nanoparticles have not been studied. There are only indirect data that suggest that, in the presence of nanoparticles, changes in the characteristics of acoustic spectra are possible due to the dynamics of the formation of cavitation gas bubbles. In this work, the acoustic spectrum of optical breakdown in a liquid on individual metal nanoparticles is obtained for the first time. It was established for the first time that the characteristics of the acoustic spectrum during optical breakdown largely depend on the concentration of nanoparticles in the medium. It was found that an important characteristic of the acoustic spectrum of optical breakdown in a liquid on individual metal nanoparticles is the collapse time of cavitation bubbles (or its lifetime).
Methods
Iron nanoparticles were obtained using the technique of laser ablation of a metal target in water. A detailed description of this technique can be found in [16]. The resulting colloidal solutions of iron nanoparticles were analyzed in a CPS disk centrifuge. This method is based on the principle of sedimentation in environments with variable density. The details of the method have been described earlier [17]. The shape and topology of the surface of nanoparticles was investigated using transmission electron microscopy [18]. The nanoparticles obtained by ablation have a spherical shape and a unimodal size distribution with an average diameter of d = 35 ± 7 nm.
A schematic view of the experimental setup is shown in Figure 1. Radiation of a Nd: YAG laser (λ = 1,064 nm, τ = 10 ns, ν = 10 kHz, ε = 2 mJ) was focused using a galvano-mirror system in the center of a glass cuvette filled with an aqueous solution of Fe nanoparticles and could move with speed 3,000 mm/s along a line 10 mm long inside the cuvette. Irradiation took place at various concentrations of Fe nanoparticles in the range from n = 104 pcs/ml to n = 1012 pcs/ml. The irradiation time was 2 min.
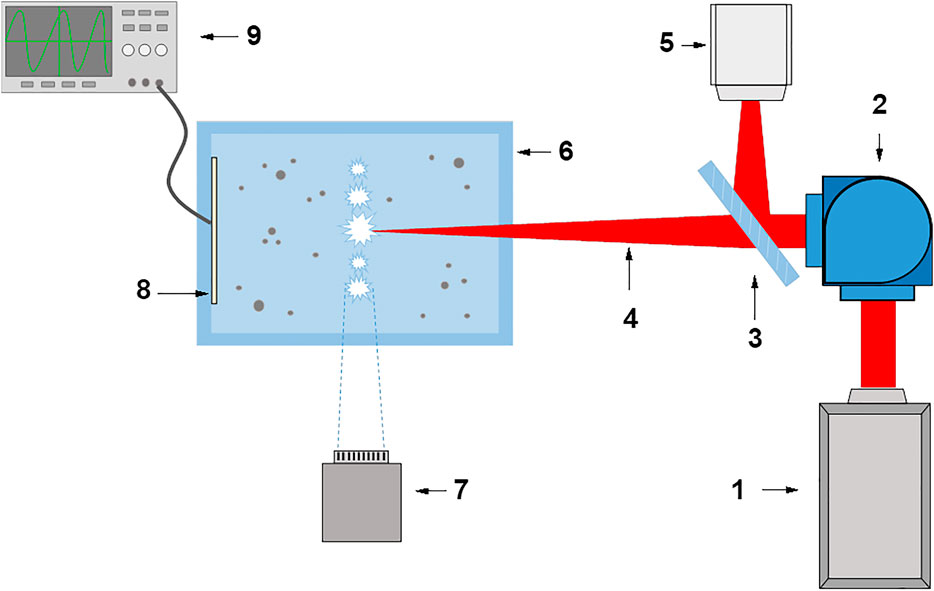
FIGURE 1. Scheme of the experimental setup: 1 Nd: YAG laser (λ = 1,064 nm, τ = 10 ns, ν = 10 kHz, ε = 2 mJ); 2 Galvano-mirror system; 3 Reflective mirror; 4 Laser radiation; 5 Pin photodiode; 6 Cuvette with an aqueous solution of Fe nanoparticles; 7 Pin photodiode; 8 Film piezoelectric sensor; 9 Digital oscilloscope.
The acoustic spectrum of laser breakdown was recorded using a film piezoelectric sensor connected to a digital oscilloscope (GW Instek GDS-72204E). The sensor was attached to the inner wall of the cuvette so that the plane of the film was parallel to the scanning line of the laser radiation. The sensor area is about 1 cm2. Simultaneously with the acoustic signals, the plasma light signals were recorded using a pin photodiode directed along the line of movement of the laser beam and a digital oscilloscope.
The signal from the laser radiation was recorded using a pin photodiode and a reflecting mirror (0.64%). The reflecting mirror was positioned at an angle of 45° relative to the laser radiation propagation line. Thus, a small part of the radiation fell on the pin photodiode, while the main part of the radiation was focused inside the cuvette.
The photodiodes were synchronized with the oscilloscope so that the laser signal triggered the digital oscilloscope sweep. Thus, the simultaneous recording of the acoustic signal, the light signal of the plasma, and the signal from the laser radiation were made.
To analyze the data, the LaserCav program was developed in the Pascal programming language (Lasarus IDE). The algorithm determines the position of light and acoustic pulses in time in relation to synchronization pulses, the amplitude of light and sound pulses. Next, the program calculates the statistical parameters of a specific experiment: the total number of sync pulses, the total number of acoustic pulses, the average amplitude of acoustic pulses, the average integral amplitude (area under the curve) of the acoustic pulse, the average delay of the acoustic pulse, the probability of generating the first, second and third acoustic impulses, the total number light pulses from plasma, the average delay of the light pulse, the average integral amplitude (area under the curve) of the light pulse. The program interface provides for the construction of correlation graphs for various parameters of the detected pulses. The data were analyzed using GraphPad Prism eight and Excel software and were presented as means ± SEM. Data from at least three independent experiments were used for averaging.
Results and Discussion
Figure 2A shows the life stages of a cavitation gas bubble from the moment of its formation to the moment of collapse, compared with the typical acoustic spectrum and signals from pin diodes obtained in the experiment, Figures 2B,C. It follows from the figure that a single laser breakdown is characterized by an acoustic signal consisting of two peaks, which correspond to various physical processes. The first peak is responsible for thermal expansion and the formation of a cavitation area filled with water vapor. This cavity then forms a cavitation bubble. Over time, the cavitation bubble begins to grow in size. Upon reaching a certain size, a sharp decrease in the size of the bubble occurs; the bubble collapses.
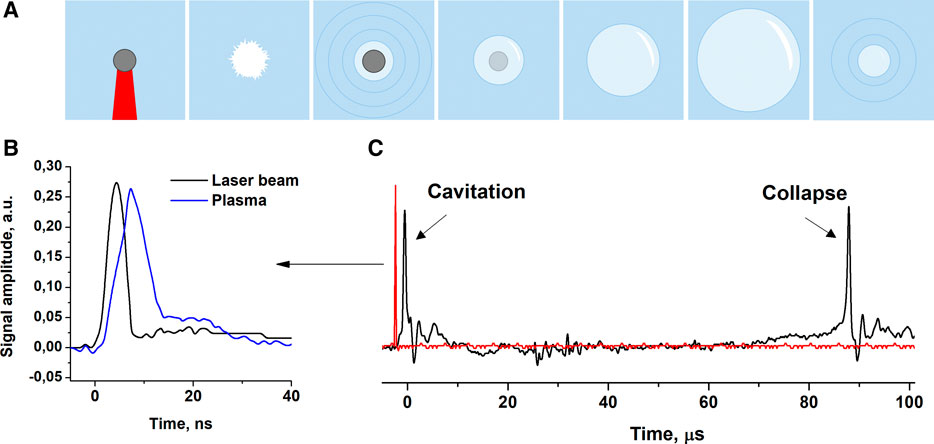
FIGURE 2. (A) Schematic representation of the development of a cavitation bubble after an optical breakdown of a colloidal solution of nanoparticles, (B) signals of laser radiation and breakdown plasma, (C) acoustic spectrum recorded during cavitation and collapse.
According to the results presented (Figure 2), the laser breakdown process occurs as follows. At the initial moment, laser radiation hits a metal nanoparticle and is actively absorbed. Intensive heating of the nanoparticle material and breakdown plasma occurs. After the end of a laser pulse with a duration of 10 ns, the signal coming from the breakdown plasma reaches its maximum and then begins to decay within the next 10 ns. It is found out that from the moment of registration of the laser signal to the moment of registration of the acoustic signal, approximately 2 μs passes. Certain time after the formation of the cavitation bubble, the second signal is recorded on the oscilloscope. The time between two acoustic signals is described by the bubble collapse time. Figure 2C, it follows that the bubble collapse time is approximately 90 μs.
Figure 3 shows the results of experiments on the irradiation of aqueous solutions of iron nanoparticles of various concentrations. In the experiments, the dependence of the areas and amplitudes of acoustic signals of cavitation and collapse on the concentration of nanoparticles was studied. The figure shows the values of the signal areas and amplitudes averaged over 10 experiments. As can be seen from the results presented (Figures 3A,B), the values of the areas and amplitudes of cavitation and collapse correlate quite well with each other at concentrations ranging from 104 pcs/ml to 108 pcs/ml. With an increase in concentration to 1013 pcs/ml, the amplitude and area of the cavitation signals begin to grow, while the amplitude and area of the signals associated with the collapse of bubbles, on the contrary, monotonically decreases. Comparison of the amplitudes of cavitating and collapsing signals (Figure 3C) shows that with an increase in the concentration of nanoparticles in solution, the ratio of the amplitude of collapse to the amplitude of cavitation monotonically decreases from 0.8 at a concentration of 104–105 pcs/ml to 0.15 at a concentration of 1013 pcs/ml.
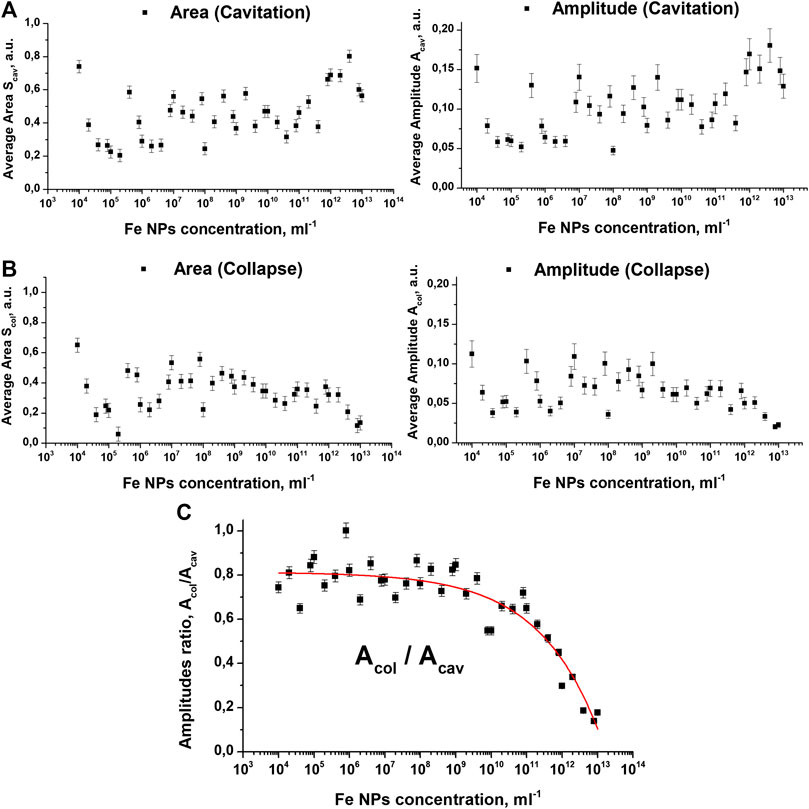
FIGURE 3. Dependence of the areas and amplitudes of acoustic signals on the concentration of Fe nanoparticles in the case of: (A) cavitating gas bubbles; (B) collapsing gas bubbles and (C) the ratio of the amplitudes of the acoustic signals.
In the experiments, the dependence of the bubble collapse time on the amplitude of the cavitation signal was also investigated. The research results are shown in Figure 4A). It is established that with an increase in the amplitude of the cavitation signal, there is a monotonic increase in the time during which the gas bubble collapses, Figure 4B). The dependence of the amplitude of the acoustic signal of cavitation on the concentration of nanoparticles obtained during the experiment and the dependence of the collapse time on the value of the amplitude of cavitation makes it possible to plot the dependence of the time of collapse on the concentration of nanoparticles, Figure 4C.
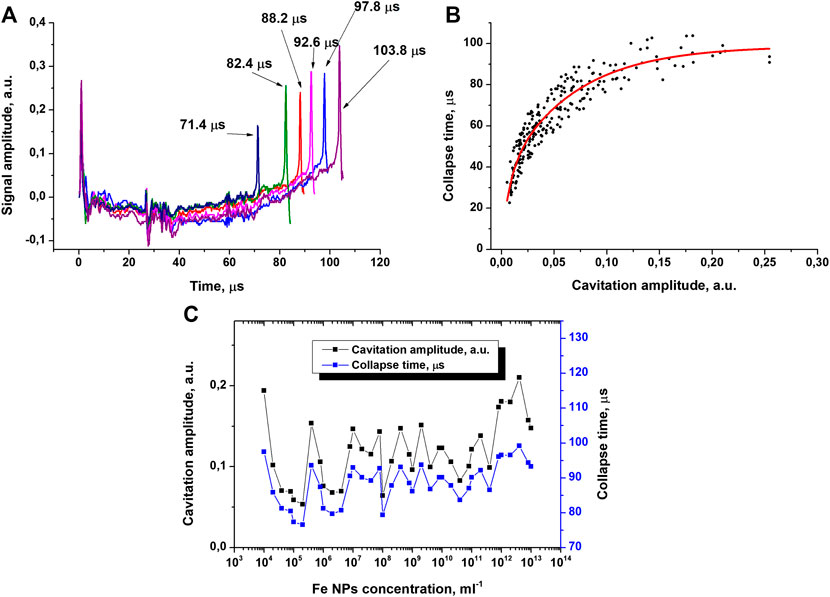
FIGURE 4. (A) Acoustic spectra of laser breakdowns with different bubble lifetimes (n = 6); (B) Dependence of the bubble lifetime on the signal amplitude (n = 9), (C) Dependence of the cavitation signal amplitude and the gas bubble lifetime on the concentration of nanoparticles (n = 3).
Experimental results show that the presence of various concentrations of impurities in a solution can significantly affect the course of processes accompanying the laser breakdown of colloidal solutions of nanoparticles. It is worth pointing out the general trend observed in various experiments on measuring acoustic signals. At low concentrations of nanoparticles (n = 103–108 pcs/ml), very few breakdowns of the colloidal solution are observed. In this case, a small number of particles are encountered in the path of propagation of laser radiation. Usually, at these concentrations, a single breakdown occurs per one laser pulse. In this case, the amplitudes and areas of cavitation and collapsing signals in the spectrum do not differ significantly. However, a fairly large spread in the amplitudes and areas of acoustic signals is observed, which indicates that the breakdown is most likely of a probabilistic nature and occurs on particles of different sizes, located at different distances from the focus, etc. In other words, the impurities are far enough away from each other, and the value of the energy absorbed by the particles can vary greatly, which ultimately leads to significant differences in the acoustic spectrum. The amplitudes of the acoustic signals of collapsing bubbles are proportional to the size of the bubble before the moment of collapse. From the moment of formation, the cavitating bubble begins to expand. In the case of low concentrations of nanoparticles, the bubble lifetime is limited from below only by the laser radiation frequency. Consequently, the collapsing bubble manages to reach its maximum size during its entire lifetime before collapsing. It should be noted that these regularities persist when colloidal solutions are irradiated for tens of minutes. This correlates with a number of facts known from the literature. So the rate of generation of hydrogen peroxide did not change for 1 h during the optical breakdown of the colloidal solution of gold nanoparticles [15]. Similar results were obtained for the hydroxyl radical, one of the main products of water decomposition during optical breakdown [19].
On the other hand, at higher particle concentrations (n = 109–1013 pcs/ml), an increase in the area and amplitude of cavitating signals is observed, but at the same time, a simultaneous decrease in the area and amplitude of the collapse is presented. In this case, the probability of an optical breakdown on a nanoparticle becomes close to 100%. In this case, more than one breakdown can sometimes occur per laser pulse. In the case when the average distance between particles becomes sufficiently small, breakdowns can form, uniting several nanoparticles. In such cases, both the size of the formed breakdown plasma and the size of the subsequent cavitation cavity increase, which ultimately leads to an increase in the intensity of acoustic signals. An increase in the area and amplitude of cavitation signals at high concentrations (n = 1011–1012 pcs/ml) is presumably associated precisely with the high probability of breakdown, the close arrangement of particles (i.e., centers of breakdown formation), and the ability of individual breakdowns to combine with each other. At a high concentration of nanoparticles in the caustic of the laser beam, several optical breakdowns can occur. Obviously, the signal caused by cavitation will be one. This is due to the fact that the laser pulse time is several nanoseconds, which is much higher than the resolution of our system. In this case, the signals of bubble collapse will occur at different times and we will detect them.
With an increase in the intensity of cavitating signals at high concentrations, the intensity of the collapse signals should also increase. However, this effect is not observed experimentally. It follows from Figure 3 that at high concentrations of nanoparticles (n = 1011–1012 pcs/ml), the bubble lifetime does not exceed 100 μs, but the amplitude of cavitation signals continues to increase. This may be since, in the case of high concentrations, cavitation bubbles are formed in a nonequilibrium medium and can be influenced by numerous neighboring breakdowns, nanoparticles, neighboring collapsing bubbles, etc. These factors can have a significant impact on the process of expansion of the cavitation bubble and lead to an earlier collapse.
It should be noted that the fundamental results we have obtained make it possible to obtain new data on the processes occurring during the optical breakdown of the medium on individual nanoparticles and other nanoobjects [20–22]. The data obtained can in the future form the basis of a new acoustic method for rapid assessment of the concentration of nanoparticles in a solution. Moreover, we believe that in the future, the conducted acoustic study will make it possible to quickly and accurately investigate the processes occurring during optical breakdown in liquids.
Conclusion
In this work, we investigated the acoustic spectra of shock waves formed at the moments of cavitation and the collapse of gas bubbles during the optical breakdown of colloidal solutions of Fe nanoparticles. The effect of the concentration of nanoparticles on the shape of acoustic spectra is shown experimentally. At low concentrations of nanoparticles (n = 103–108 pcs/ml), acoustic signals of cavitation and collapse are well correlated with each other. A fairly strong scatter in the values of amplitudes and areas with varying concentrations in this range is due to the probabilistic nature of the breakdown. At high concentrations of impurities (n = 109–1013 pcs/ml), cavitating signals are characterized by increased intensity, presumably due to an increase in the breakdown probability and the ability of several breakdowns to combine into larger ones. The lifetime of cavitating bubbles monotonically increases with increasing cavitation amplitude. However, at high concentrations, cavitation bubbles are in a nonequilibrium medium, as a result of which their lifetime decreases with increasing concentration. In other words, it has been shown that the physicochemical properties of the structural components of solutions (for example, the lifetime of cavitation bubbles) can differ significantly depending on the level of solutes (for example, nanoparticles), which can explain the previously shown differences in the properties of the solvent in highly concentrated and highly diluted solutions. In general, the physicochemical properties of aqueous solutions change non monotonically as the stock solution is diluted.
Data Availability Statement
The raw data supporting the conclusions of this article will be made available by the authors, without undue reservation.
Author Contributions
IB and SG conducted experiments. IB, AL, and SG participated in the processing of the results and their discussion. DS and MA developed software. IB and SG participated in writing the text of the manuscript.
Funding
This work was supported by a grant of the Ministry of Science and Higher Education of the Russian Federation for large scientific projects in priority areas of scientific and technological development (Grant No. 075-15-2020-775).
Conflict of Interest
The authors declare that the research was conducted in the absence of any commercial or financial relationships that could be construed as a potential conflict of interest.
Acknowledgments
The authors are grateful to the Center for Collective Use of the GPI RAS for the equipment provided.
References
1. Raĭzer YP. Breakdown and heating of gases under the influence of a laser beam. Sov Phys Usp (1966) 8(5):650
2. Daiber JW, Thompson HM. Laser‐driven detonation waves in gases. Phys. Fluids (1967) 10(6):1162–9 doi:10.1063/1.1762258
3. Gross RA. Strong ionizing shock waves. Rev Mod Phys (1965) 37(4):724 doi:10.1103/RevModPhys.37.724
4. Bell CE, Landt JA. Laser‐induced high‐pressure shock waves in water. Appl Phys Lett (1967) 10(2):46–8 doi:10.1063/1.1754840
5. Fujimoto JG, Lin WZ, Ippen EP, Puliafito CA, Steinert RF. Time-resolved studies of Nd:YAG laser-induced breakdown. Plasma formation, acoustic wave generation, and cavitation. Invest Ophthalmol Vis Sci (1985) 26(12):1771–7
6. Vogel A, Busch S, Parlitz U. Shock wave emission and cavitation bubble generation by picosecond and nanosecond optical breakdown in water. J Acoust Soc Am (1996) 100(1):148–65 doi:10.1121/1.415878
7. Kim D, Ye M, Grigoropoulos CP. Pulsed laser-induced ablation of absorbing liquids and acoustic-transient generation. Appl Phys A (1998) 67(2):169–81 doi:10.1007/s003390050756
8. Newhouse VL, Mohana Shankar P. Bubble size measurements using the nonlinear mixing of two frequencies. J Acoust Soc Am (1984) 75(5):1473–7 doi:10.1121/1.390863
9. Vogel A, Lauterborn W, Timm R. Optical and acoustic investigations of the dynamics of laser-produced cavitation bubbles near a solid boundary. J Fluid Mech (1989) 206:299–338 doi:10.1017/S0022112089002314
10. Gilmore FR. The growth or collapse of a spherical bubble in a viscous compressible liquid. Pasadena, CA: California Institute of Technology (1952).
11. Brennen CE. Cavitation and bubble dynamics. Cambridge, England: Cambridge University Press (2014).
12. Denner F. The Gilmore-NASG model to predict single-bubble cavitation in compressible liquids//Ultrasonics Sonochemistry. Ultrason Sonochem (2020) 70:105307 doi:10.1016/j.ultsonch.2020.105307
13. Liu X, Hou Y, Liu X, He J, Lu J, Ni X. Oscillation characteristics of a laser-induced cavitation bubble in water at different temperatures. Optik (2011) 122(14):1254–7 doi:10.1016/j.ijleo.2010.08.010
14. Shen Y, Yasui K, Zhu T, Ashokkumar M. A model for the effect of bulk liquid viscosity on cavitation bubble dynamics. Phys Chem Chem Phys (2017) 19(31):20635–40 doi:10.1039/C7CP03194G
15. Simakin AV, Astashev ME, Baimler IV, Uvarov OV, Voronov VV, Vedunova MV, et al. The effect of gold nanoparticle concentration and laser fluence on the laser-induced water decomposition. J Phys Chem B. (2019) 123 (8):1869–80 doi:10.1021/acs.jpcb.8b11087
16. Baimler I, Simakin A, Uvarov O, Volkov M, Gudkov S. Generation of hydroxyl radicals during laser breakdown of aqueous solutions in the presence of Fe and Cu nanoparticles of different sizes. Phys Wave Phenom (2020) 28:107–10 doi:10.3103/S1541308X20020028
17. Nadler M, Mahrholz T, Riedel U, Schilde C, Kwade A. Preparation of colloidal carbon nanotube dispersions and their characterisation using a disc centrifuge. Carbon (2008) 46:1384–92 doi:10.1016/j.carbon.2008.05.024
18. Chernov AS, Reshetnikov DA, Kovalitskaya Yu A, Manokhin AA, Gudkov SV. Influence of wideband visible light with an padding red component on the functional state of mice embryos and embryonic stem cells. J Photochem Photobiol, B (2018) 188:77–86 doi:10.1016/j.jphotobiol.2018.09.007
19. Barmina EV, Gudkov SV, Simakin AV, Shafeev GA. Stable products of laser-induced breakdown of aqueous colloidal solutions of nanoparticles. J Laser Micro Nanoeng (2017) 12:254–7 doi:10.2961/jlmn.2017.03.0014
20. Babenko VA, Bunkin NF, Sychev AA. Effect of an optical breakdown on the stimulated Raman scattering in water in the field of picosecond laser pulses. J Exp Theor Phys (2019) 128:664–71 doi:10.1134/S1063776119040071
21. Babenko VA, Bunkin NF, Sychev AA, Suyazov NV. Plasmon enhanced low frequency stimulated Raman scattering in water due to optical breakdown in gas nanobubbles. J Optic (2019) 22:015401 doi:10.1088/2040-8986/ab56aa
Keywords: laser radiation, nanoparticles, acoustic signals, cavitation, collapse, optical breakdown
Citation: Baimler IV, Lisitsyn AB, Serov DA, Astashev ME and Gudkov SV (2020) Analysis of Acoustic Signals During the Optical Breakdown of Aqueous Solutions of Fe Nanoparticles. Front. Phys. 8:622791. doi: 10.3389/fphy.2020.622791
Received: 29 October 2020; Accepted: 24 November 2020;
Published: 23 December 2020.
Edited by:
Nikolai F. Bunkin, Bauman Moscow State Technical University, RussiaReviewed by:
Krishna Bharat Lankamsetty, University of Delhi, IndiaTatiana A. Mishchenko, Lobachevsky State University of Nizhny, Novgorod, Russia
Copyright © 2020 Baimler, Lisitsyn, Serov, Astashev and Gudkov. This is an open-access article distributed under the terms of the Creative Commons Attribution License (CC BY). The use, distribution or reproduction in other forums is permitted, provided the original author(s) and the copyright owner(s) are credited and that the original publication in this journal is cited, in accordance with accepted academic practice. No use, distribution or reproduction is permitted which does not comply with these terms.
*Correspondence: Sergey V. Gudkov, s_makariy@rambler.ru