- 1Julius Center for Health Sciences and Primary Care, University Medical Center Utrecht, Utrecht University, Utrecht, Netherlands
- 2BioISI—Biosystems & Integrative Sciences Institute, Faculdade de Ciências, Universidade de Lisboa, Lisboa, Portugal
SARS-CoV-2 has established itself in all parts of the world, and many countries have implemented social distancing as a measure to prevent overburdening of health care systems. Here we evaluate whether and under which conditions containment of SARS-CoV-2 is possible by isolation and contact tracing in settings with various levels of social distancing. To this end we use a branching process model in which every person generates novel infections according to a probability distribution that is affected by the incubation period distribution, distribution of the latent period, and infectivity. The model distinguishes between household and non-household contacts. Social distancing may affect the numbers of the two types of contacts differently, for example while work and school contacts are reduced, household contacts may remain unchanged. The model allows for an explicit calculation of the basic and effective reproduction numbers, and of exponential growth rates and doubling times. Our findings indicate that if the proportion of asymptomatic infections in the model is larger than 30%, contact tracing and isolation cannot achieve containment for a basic reproduction number
1 Introduction
The novel coronavirus (SARS-CoV-2) has established itself in all parts of the world. There are still no registered vaccines and treatment options to COVID-19 disease remain mainly supportive. Control of virus transmission and associated disease thus depends on preventive measures such as social distancing combined with isolation of infected persons and those that have high likelihood of being infected, for instance because they have been traced as contacts of infected persons [1, 2]. It has become clear that additional measures are needed to control epidemic transmission, for example by using active tracing of contacts in combination with isolation of infected contacts. Also, such measures are important in the context of exit strategies, i.e. once social distancing measures are reduced or lifted, as has been suggested recently [3]. It is unclear how effective such combinations of interventions can be in populations with social distancing in place [4].
To what extent local containment or local slowing down of an epidemic by isolation and contact tracing is successful depends on the fraction of infections that remain asymptomatic or have mild disease, on the infectiousness before the onset of symptoms [5, 6], and on testing rates. It is known that occurrence of asymptomatic infections, a high proportion of transmission occurring before the onset of symptoms, a long delay between case finding and isolation, and high overall transmissibility all factor in negatively in the likelihood that an outbreak can be contained [7–11]. For SARS-CoV-2, evidence indicates that a high fraction of infected persons is infectious before they show symptoms (up to 50%), that a substantial fraction of infections may be asymptomatic or show only mild symptoms (up to 80%), and that the epidemic doubling time in the absence of interventions may be one week or even less [6, 12–18]. On the other hand, it is also reported that with intensive contact tracing it could be possible to trace the majority (>80%) of secondary infections [11, 19].
Here we provide a model-based analysis of the impact of isolation and contact tracing in a setting with various levels of social distancing measures, using varying levels of the effectiveness and timeliness of contact tracing. It is important to consider the impact of each of these interventions in isolation but also in combination, as it is known that each intervention that reduces transmission is expected to increase the effectiveness of additional interventions in a synergistic manner [20]. The current analyses extend and complement our earlier study in which the focus was purely on the impact on delays in testing and tracing of contacts of infected individuals [11]. Here we report effective reproduction number, the (exponential) rate of increase, and the doubling time of the epidemic for scenarios with various combinations of interventions. Considering that the capacity of healthcare systems is limited, it is important to assess which interventions are most effective in slowing down the rate of increase of case numbers during an ongoing outbreak. As it is likely that, on the one hand, isolation and contact tracing will be more effective in close contact settings with well-defined contacts (household) than in the community (commuting, public spaces), while, on the other hand, the potential impact of household interventions on the epidemic could be smaller, we stratify the analyses by transmission setting (henceforth called household and non-household) [9].
2 Methods
2.1 Overview
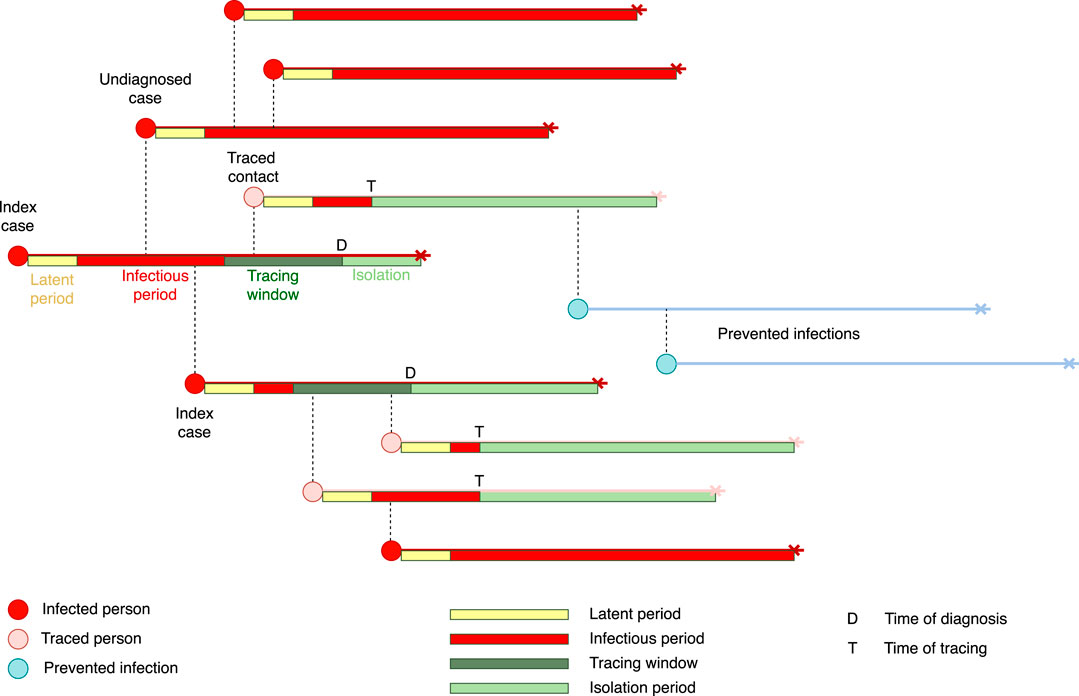
We use a stochastic transmission model based on a model that has been developed earlier [9], and which has been adapted to describe the biological characteristics of SARS-CoV-2 [11]. The model describes an epidemic while the proportion of immunes is low as a branching process. The model does not take into account clustering of infections, small world network effects, or other density dependent effects. Starting from a small set of initially infected individuals, the model calculates the numbers of latently infected persons, infectious persons, and persons that are diagnosed and isolated in time steps of one day. Latent infection, infectivity during the infectious period, and daily contact rates are quantified using distributions taken from the literature (Table 1). We distinguish between household contacts (e.g. housemates, but also other persons with whom contact is regular and close like care takers), and non-household contacts with whom frequency and duration of contact is lower. The two types of contacts differ in the risk of infection, and the delay and effectiveness of tracing and isolation may be different. Intervention effectiveness is determined by the daily probability of being diagnosed during the infectious period (Table 2). Furthermore, intervention effectiveness depends on the delays in tracing household and non-household contacts, respectively, and the proportions of contacts can be found and isolated or quarantined. Here isolation applies to stopping contacts of a person who is diagnosed with COVID-19, while quarantine means that a person who is not yet tested refrains from contacts. We assume that isolation and quarantine are perfect, i.e. that isolated and quarantined persons cannot transmit any longer. See Figure 1 for a schematic description of the transmission and contact tracing process. The model is described by a set of difference equations, and allows for explicit computation of the basic reproduction number
2.2 Natural History of Infection
We assume that the latent period lasts between 1 and 3 days with a given probability per day of moving to the infectious state. Individuals then become infectious for at most 10 days [22]. Infectivity is high at the beginning of the infectious period and decays to low levels during these 10 days (Figure 2A). The probability of symptom onset increases during the first 3 days of the infectious period, thereby influencing the daily probability of diagnosis during the infectious period (see Section 2.4 and Figure 2B). Incubation period distribution and infectivity were fitted to recent estimates by Li et al [15], He et al [23], and Ashcroft et al [24]. The average incubation period in our model was 5.2 days with standard deviation of 3.9 days. An infectious individual makes contacts with household members and persons outside the household. We model the daily number of household contacts with a Poisson distribution, and the numbers of non-household contacts with a negative binomial distribution (Table 1), with parameters based on the average household size in the The Netherlands, and numbers of contacts observed in a contact study in the The Netherlands (Figure 2C) [25]. With the chosen parameters, the mean number of contacts per day is 13.2 with standard deviation of 8.5 days.
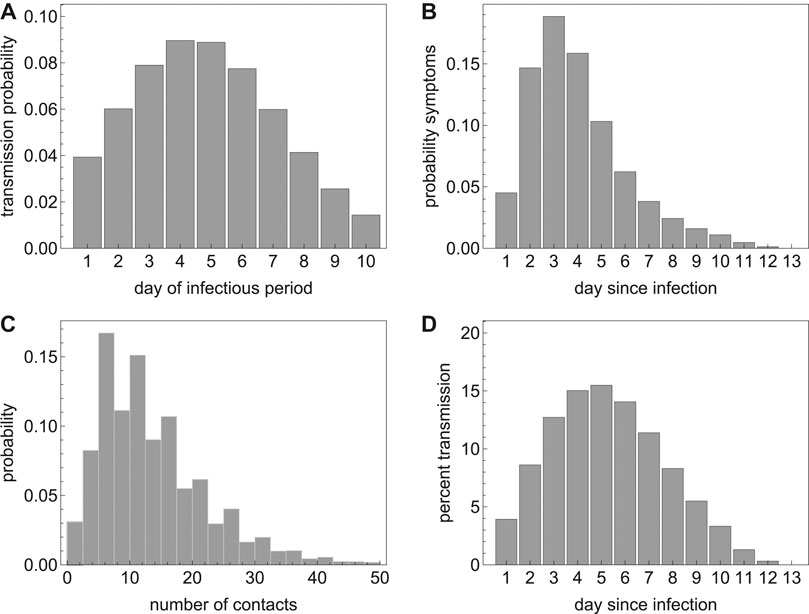
FIGURE 2. (A) The transmission probability per day of the infectious period; (B) the probability of developing symptoms per day since infection; (C) the probability distribution of the number of contacts per day; and (D) percent onward transmission per day since infection.
On each day of the infectious period, an individual makes a number of contacts according to the contact distribution. This number is reduced by a factor describing the probability that the contact person has already been infected during earlier contacts with the index person. Figure 2A shows the probability distribution of transmission upon contact with a susceptible household contact. As contacts with persons outside the household are often less close, and secondary attack rates in non-household contacts are observed to be lower than in household contacts [26], we assume that the transmission probability for these contacts is lower by factor 0.25. For this reduction factor, Figure 2D shows the percentage of onward transmissions per day since becoming infected, e.g. around 40% of transmission occurs in the first 4 days after acquisition of infection, i.e. before the average time of symptoms onset [24].
2.3 Social Distancing
Social distancing can be self-imposed, if people decide to reduce their social contacts during the outbreak, and it can be government-imposed by closing schools, workplaces, and other venues of social gatherings [27]. Here we assume that when social distancing is applied, household contacts remain unchanged, but the mean number of non-household contacts is reduced. This is implemented by a reduction factor in the mean of the negative binomial distribution describing non-household contact numbers. The reduction factor for social distancing was varied between 0 and 95%. In scenarios with social distancing we assumed that 80% of cases are symptomatic or can be ascertained [28]. In surveys during the lock-down in the first wave of SARS-CoV-2 in the The Netherlands, it was shown that the daily number of community contacts was reduced by 71% to around 3.7 per day [29] and after the partial lifting of the measures the number of contacts slowly increased again. Similar decreases in contact numbers during the lock-down in the United Kingdom were reported by [30].
2.4 Diagnosis, Contact Tracing, and Isolation
An infectious person becomes symptomatic with a given probability per day since infection (Figure 2B). For SARS-CoV-2 the probability of developing symptoms is high in the first few days of the infectious period and then declines. If an infected and infectious person has not developed symptoms 10 days after acquisition of the virus, the probability that he/she will still do so is very small. The probability of developing symptoms determines whether he/she will be diagnosed and isolated. The total probability of developing symptoms determines the fraction that remains asymptomatic or otherwise undiagnosed, i.e. if the total probability of developing symptoms is smaller than 1, a proportion of the infected persons will remain undiagnosed and can transmit throughout their infectious period. With the assumed distributions, on average at least half of all potential onward transmissions will have occurred before an infected person is diagnosed and isolated. If diagnosis is delayed, because a person does not get tested immediately at symptom onset, and then it takes time until a test result is available, this proportion will be higher. This delay, i.e. the time between symptom onset until a symptomatic person gets a positive diagnosis, is denoted here as the testing delay. A testing delay is implemented in the model by setting the diagnosis probability to zero for the number of days of delay, and shifting the probability of diagnosis distribution to the right.
If an individual is diagnosed, contacts will be traced. Traced infected persons will be diagnosed and isolated. Tracing goes back in time for a given number of days to trace all contacts of the index case during this time window. There may be a delay before contacts are found and diagnosed, and only a fraction of all contacts may be found. These parameters, tracing delay and tracing coverage, may be different for household and non-household contacts. We assume that all traced infected persons are immediately isolated and cannot transmit any further. In reality, there might be a delay between tracing a contact and its effective isolation, but we interpret the tracing as an ‘effective tracing delay’ that encompasses the time from positive diagnosis of the index case until isolation of the contact. Therefore, the only individuals who will continue transmitting are those who are not found by tracing and are not yet diagnosed. Table 2 shows the parameter values related to diagnosis and contact tracing.
2.5 Baseline Scenario
For assessing the effectiveness of contact tracing and isolation, we use a best case scenario, where all parameters are set to optimistic values. We assume that when a case is diagnosed, he/she will immediately be isolated and this will stop onward transmission completely. Furthermore, we assume that all contacts will be traced, and if found infected will be isolated immediately. We assume that it takes 0 days to find and isolate both household and non-household contacts. The rationale for using these optimistic assumptions as a baseline is that it enables investigation of the maximum contribution contact tracing can provide for achieving containment. We then investigated for various control parameters at which point of diverging from the baseline parameters control of the outbreak will be lost. We also considered more realistic parameter combinations with imperfect contact tracing, in particular including delays and reduced tracing coverages (see also [11]).
2.6 Output Variables
The model allows an explicit calculation of the basic reproduction number
We are interested in the critical tracing coverage, i.e. what proportion of non-household contacts needs to be found and isolated to control the outbreak, for populations with various levels of social distancing. Furthermore, we study the epidemic growth rate (or epidemic doubling time) without and with contact tracing and isolation and various levels of social distancing. In sensitivity analyses, we study how these quantities depend on the testing delay of the index case and on the tracing delay in contact tracing. For example, we assume that household contacts can be traced with a high coverage without delay, but that tracing of non-household contact may take longer and be less complete.
Based on the distributions of the latent and infectious periods and infectivity, we calculate the exponential growth rates and doubling times under various assumptions on the intervention parameters. This gives additional information for situations where the outbreak is not controllable, because intervention measures will lower the growth rate and increase the epidemic doubling time.
We investigated how controllability of the outbreak depends on the fraction of infections that develop symptoms and therefore vary this percentage between 0 and 100%. We then considered combinations of interventions and their impact on the effective reproduction number, growth rate, and doubling time of the epidemic. We varied levels of social distancing, and coverage of tracing of household and non-household contacts. In our analysis for different levels of social distancing we assumed that 80% of infected persons develop symptoms [28, 31].
3 Results
3.1 Basic and Effective Reproduction Numbers
In the baseline scenario without interventions we calibrate the transmission probability such that
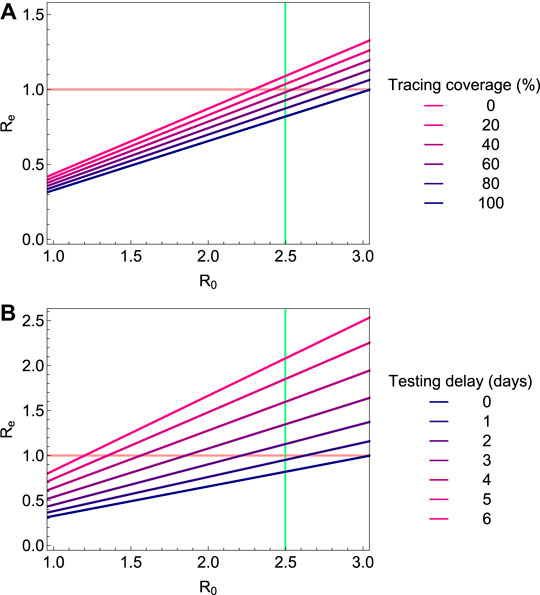
FIGURE 3. The effective reproduction number
3.2 Fraction of Non-household Contacts Needed to Be Traced and Isolated
The question arises how effective contact tracing has to be to keep the outbreak under control if there is a testing delay. We therefore compute the minimum fraction of non-household contacts that need to be traced and isolated (henceforth termed “critical tracing coverage”) to bring
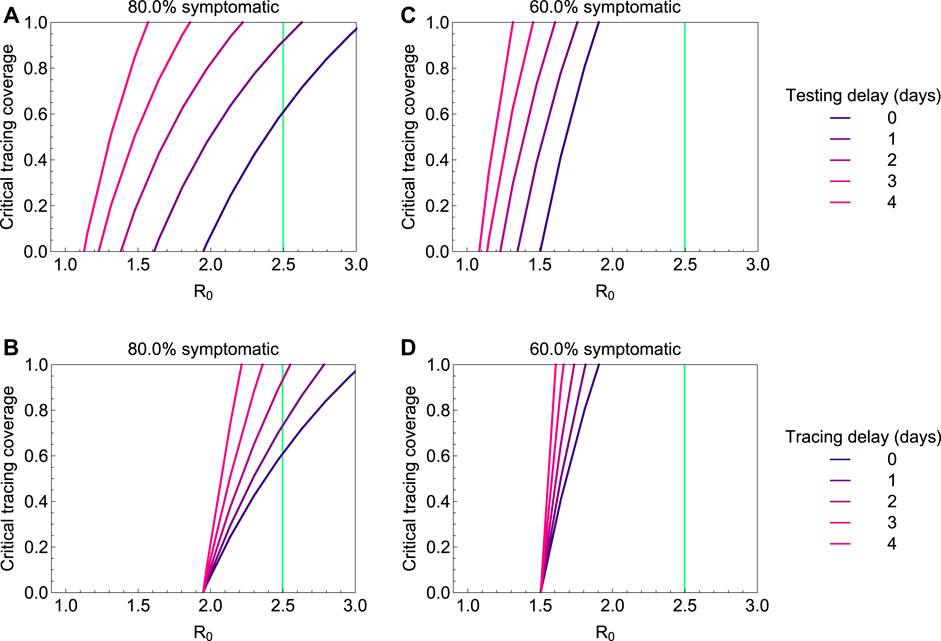
FIGURE 4. The critical tracing coverage for varying values of the basic reproduction number
3.3 Impact of Asymptomatic Cases
Not being diagnosed can be a consequence of not developing symptoms, having only mild symptoms, or any other reason why infected persons might not be identified by healthcare system. We subsume these possible reasons for cases not being ascertained under the term “asymptomatic”. With increasing proportion of asymptomatic cases, the possibility of controlling the outbreak with contact tracing and isolation quickly fades. This is illustrated in Figure 5, in which we plot the critical tracing coverage for non-household contacts for several values of
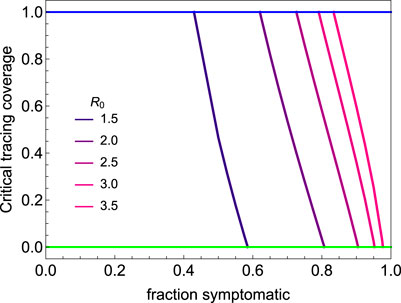
FIGURE 5. The critical tracing coverage for varying percentages of symptomatic infections and values of the basic reproduction number
3.4 Exponential Growth Rates and Doubling Times
If epidemic control is not possible with isolation and contact tracing only, it might still be possible to slow down the epidemic and thereby lower demand for the healthcare system. We find that contact tracing has a significant impact on the epidemic growth rate for short testing delays (Figure 6A) and high coverage of tracing non-household contacts (Figure 6C). Figures 6B,D show the associated epidemic doubling times (see the Supplementary Appendix for details). If 60% of cases are symptomatic and diagnosed, while contact tracing is efficient (i.e. short testing delay and high tracing coverage) the doubling time can be increased to about 15 days. If less than 60% of infections are symptomatic and ascertained, however, the impact of contact tracing on the doubling time is small.
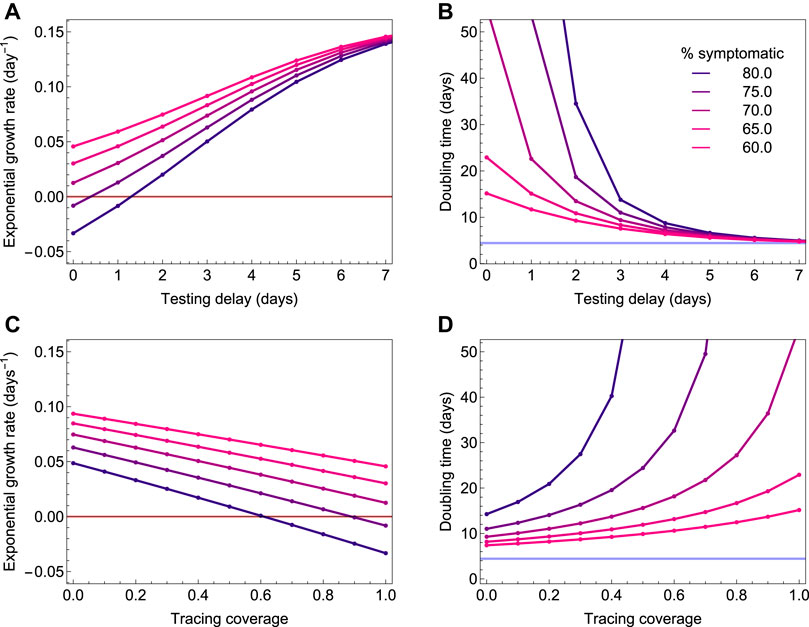
FIGURE 6. The exponential growth rate and associated epidemic doubling time as a function of the testing delay (A and C) and coverage of contact tracing (B and D). The colors depict the fraction of infections that is symptomatic, and which is varied from 60% (pink) to 80% (blue). The outbreak is controlled when the exponential growth rate is smaller than zero (red horizontal line). If 60% of infections are symptomatic, contact tracing and isolation can slow down the epidemic to around 15 days, but they cannot control it, even if there is no diagnosis delay and all non-household contacts are traced.
3.5 Social Distancing and Contact Tracing
Social distancing in theory could reduce the effective reproduction number to below 1, but only if the number of non-household contacts is reduced to near zero. In practice this will be hard to achieve. Additional effort into tracing and isolation of household contacts are then needed to achieve containment. In Figure 7A we consider a scenario in which 80% of infected persons who develop symptoms are tested and isolated, and social distancing is implemented. The figure shows the critical tracing coverage as a function of the reduction of non-household contacts. In the brown area, it is sufficient to trace and isolate household contacts with a coverage above the critical coverage. In the purple area, also non-household contacts need to be traced with a coverage above the critical coverage in addition to tracing and isolating 100% of household contacts. We find that, if social contacts outside the household are reduced by at least 30%, isolating all household contacts is sufficient for control. If non-household contacts are reduced by more than 50%, testing and isolating of cases without tracing is sufficient to bring

FIGURE 7. The critical tracing coverage in a population with social distancing and
In Figure 8, we explore the impact of social distancing on the exponential growth rate and doubling time, again for the scenario with a testing coverage of 80%. The curves show how the exponential growth rate and doubling time are affected by the reduction of non-household contacts, for various coverage levels of tracing household and non-household contacts. Figure 8A shows how the exponential growth rate decreases with increasing level of social distancing, and also how increasing coverage of tracing household and non-household contacts lowers the exponential growth rate. Figure 8B shows the associated doubling times. We consider scenarios of with increasing coverage of contact tracing. First, only household contact are traced with coverage increasing from 0 to 100% in increments of 20% (green to yellow curves in Figure 7); then in addition to tracing 100% of household contacts, an increasing fraction varying from 0 to 100% in increments of 20% of non-household contacts are traced (blue to magenta curves in Figure 7). We find that in situations where control of the epidemic is not possible, i.e. when the reduction of non-household contacts remains lower than about 50%, an effective tracing may help to greatly increase epidemic doubling times.
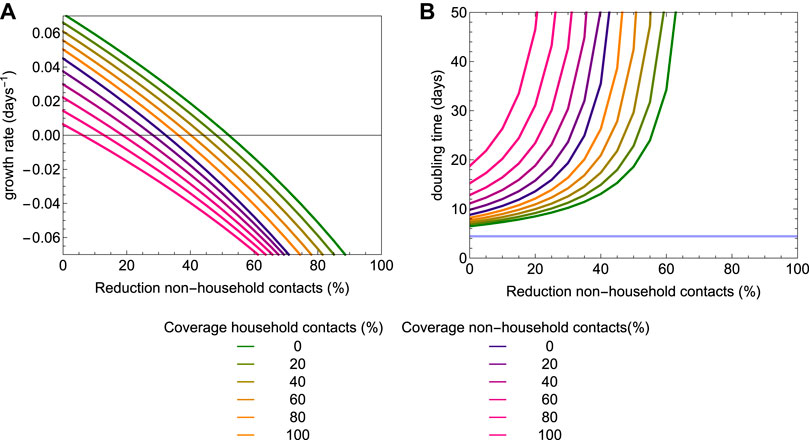
FIGURE 8. The exponential growth rate (A) and epidemic doubling time (B) as a function of the level of social distancing and coverage of contact tracing. Testing coverage is set to 80%. The colors represent different coverage levels of contact tracing. For the lines colored from green to yellow only household contacts are traced and isolated; for the lines colored from blue to magenta, 100% of household contacts are traced and an additional fraction of non-household contacts are traced and isolated.
4 Discussion
Our analyses show that rapid diagnosis and isolation of infections based on COVID-19 disease alone cannot control outbreaks of SARS-CoV-2, but that the addition of tracing and isolation of traced cases could in theory be successful (Figure 3) [3, 11, 19, 34–37]. In practice, however, the potential for containment will be seriously jeopardized by delays and imperfections in the tracing process. Especially delays in diagnosis and isolation, and the existence of asymptomatic and mild infections that contribute to onward transmission could make control difficult. As evidence is mounting that the proportion of asymptomatic and mild cases is large and leads to substantial numbers of unascertained cases, most countries have implemented strategies of social distancing or full lock-downs. Such measures have proven effective earlier during the 2009 influenza pandemic [38, 39]. However, social distancing can never be complete, as healthcare workers and doctors have to continue their work, but also personnel of supermarkets, public transport employees, and others will have contact outside their households. We find that in a situation where 60% of cases are ascertained, social distancing of non-household contacts fails to contain the epidemic even if contacts outside the household are reduced by 80%. In this case, combining the social distancing with tracing and isolation of household contacts may suffice to bring the balance toward containment. If social distancing is less severe, more intensive contact tracing and also tracing of non-household contacts is needed (Figure 7). If social distancing reduces non-household contacts only by 50%, tracing and isolation also of non-household contacts is needed for containment. If this is not possible, for example due to constraints of the public health system, tracing and isolation of household contacts can at least substantially increase the doubling time of the epidemic (Figure 8).
Even though the SARS-CoV-2 pandemic cannot be contained by contact tracing and rapid isolation alone, this does not render contact tracing useless. On the contrary, contact tracing and isolation when used in addition to social distancing, may be the tool needed to make this mix of strategies successful. Our analyses show that isolation and contact tracing when combined with social distancing can contribute to reducing the growth rate and increasing the doubling time of epidemics, thereby buying time, spreading the number of severe cases out over a longer period of time, and potentially also reducing the total number of infections [40]. This will lower peak healthcare demand, alleviate the stress on healthcare systems, and contribute to reducing the burden of disease.
Our analyses of contact tracing add to an earlier study by a more systematic analysis of the relation between key parameters (transmissibility, fraction asymptomatic, fraction of contacts traced, diagnosis delays), and by incorporating household vs. non-household contacts [34]. Household contacts are at a higher risk of becoming infected than non-household contacts as persons in a household will usually have repeated contacts. On the other hand, our analyses show that household infections contribute less to onward transmission than non-household infections simply because the numbers of household contacts are much lower than numbers of other contacts. As a consequence, the effectiveness of isolating non-household contacts is key for a successful contact tracing strategy. Our assumption that asymptomatic cases are as infectious as symptomatic cases may result in an overestimation of the contribution of asymptomatic cases to transmission. This might mean that effectiveness of contact tracing is more favourable than found in our analyses.
A strength of our model is that quantitative information about distributions of the latent and infectious periods, and the infectivity per day of the infectious period can be incorporated easily and detailed, such that if new and better data become available, the analyses can be updated quickly. In particular, the model can incorporate non-standard distributions based on empirical data (e.g. viral load measurements to quantify infectiousness per day).
A limitation of the analyses presented here is that they apply to a situation in which the epidemic is described by a branching process and is growing exponentially. This also applies to another modeling using a (one-type) branching process [34]. Ultimately, as the number of persons who are or have been infected increases, the number of persons that are still susceptible will start to dwindle, and epidemic growth will ultimately come to a halt. Hence, strictly speaking our results apply to the early stages of an epidemic. However, in the present situation, the proportion of the population who is immune for COVID-19 does in general not exceed 10% in most places [41]. In fact, even when the number of infected persons is still relatively small in the early stage of an epidemic it is possible that exponential growth is not observed, for instance due to local depletion of susceptible persons in combination with clustering in contact patterns, spatial effects, and inhomogeneous mixing [42]. However, estimates of the effective reproduction number are independent of the dynamics and give information about the ability of an intervention to slow down epidemic spread. Also, at present it is only in few places in the world where cumulative infection attack rates may have surpassed the 10% level.
In conclusion, our results show that in populations where social distancing is implemented, isolation and contact tracing can play an essential role in gaining control of the COVID-19 epidemic. On their own, none of these strategies are able to contain COVID-19 for realistic parameter settings, but in a combined strategy they can just tip the balance toward containment. These insights provide guidance for policy makers, who will have to decide when and how to release severe lock-down or social distancing measures, and whether additional contact tracing and isolation is then a feasible alternative to keep a resurging epidemic at bay.
Data Availability Statement
Publicly available datasets were analyzed in this study. This data can be found here: https://github.com/mirjamkretzschmar/ContacttracingModel.
Author Contributions
MK, MB, and GR conceived the study. MK designed and programmed the model, and produced output. All authors interpreted the results, contributed to writing the manuscript, and approved the final version for submission.
Conflict of Interest
The authors declare that the research was conducted in the absence of any commercial or financial relationships that could be construed as a potential conflict of interest.
Acknowledgments
We thank Martin Bootsma for help with the estimation procedure. MK acknowledges support from the Netherlands Organization for Health Research and Development (ZonMw; Grant no. 91216062 and Grant no. 10430022010001). GR acknowledges support from the Portuguese Foundation for Science and Technology (FCT; Grant no. 131_596787873).
Supplementary Material
The Supplementary Material for this article can be found online at: https://www.frontiersin.org/articles/10.3389/fphy.2020.622485/full#supplementary-material.
References
1. Anderson RM, Heesterbeek H, Klinkenberg D, Hollingsworth TD How will country-based mitigation measures influence the course of the covid-19 epidemic?. The Lancet (2020) 395(10228):931–4. doi:10.1016/S0140-6736(20)30567-5
2. Bernard Stoecklin S, Rolland P, Silue Y, Mailles A, Campese C, Simondon A, et al. First cases of coronavirus disease 2019 (covid-19) in France: surveillance, investigations and control measures. Euro Surveill (2020) 25(6), 94. doi:10.2807/1560-7917.ES.2020.25.6.2000094
3. Ferretti L, Wymant C, Kendall M, Zhao L, Nurtay A, Abeler-Dörner L, et al. Quantifying sars-cov-2 transmission suggests epidemic control with digital contact tracing. Science (2020) 368(6491):6936. doi:10.1126/science.abb6936
4. Thompson RN, Hollingsworth TD, Isham V, Arribas-Bel D, Ashby B, Britton T, et al. Key questions for modelling covid-19 exit strategies. Proc R Soc B (2020) 287:20201405. doi:10.1098/rspb.2020.1405
5. Lauer SA, Grantz KH, Bi Q, Jones FK, Zheng Q, Meredith HR, et al. The incubation period of coronavirus disease 2019 (covid-19) from publicly reported confirmed cases: estimation and application. Ann Intern Med (2020) 172(9):577–582. doi:10.7326/M20-0504
6. Cheng HY, Jian SW, Liu DP, Ng TC, Huang WT, Lin HH. Taiwan COVID‐9 Outbreak Investigation Team. Contact tracing assessment of COVID‐19 transmission dynamics in Taiwan and risk at different exposure periods before and after symptom onset. JAMA Intern Med (2020). 180(9):1156–1163. doi:10.1001/jamainternmed.2020.2020
7. Fraser C, Riley S, Anderson RM, Ferguson NM Factors that make an infectious disease outbreak controllable. Proc Natl Acad Sci USA (2004) 101(16):6146–51. doi:10.1073/pnas.0307506101
8. Klinkenberg D, Fraser C, Heesterbeek H The effectiveness of contact tracing in emerging epidemics. PLoS One (2006) 1(1):12. doi:10.1371/journal.pone.0000012
9. Kretzschmar M, van den Hof S, Wallinga J, van Wijngaarden J Ring vaccination and smallpox control. Emerg Infect Dis (2004) 10(5):832–41. doi:10.3201/eid1005.030419
10. Müller J, Kretzschmar M, Dietz K Contact tracing in stochastic and deterministic epidemic models. Math Biosci (2000) 164(1):39–64. doi:10.1016/s0025-5564(99)00061-9
11. Kretzschmar ME, Rozhnova G, Bootsma MCJ, van Boven M, van de Wijgert JHM, Bonten MJM Impact of delays on effectiveness of contact tracing strategies for COVID-19: a modelling study. Lancet Public Health (2020) 5(8):e452–e459. doi:10.1016/S2468-2667(20)30157-2
12. Backer JA, Klinkenberg D, Wallinga J Incubation period of 2019 novel coronavirus (2019-ncov) infections among travellers from Wuhan, China, 20–28 January 2020. Euro Surveill (2020) 25(5):62. doi:10.2807/1560-7917.ES.2020.25.5.2000062
13. Chen J Pathogenicity and transmissibility of 2019-ncov-a quick overview and comparison with other emerging viruses. Microb Infect (2020) 22(2):69–71. doi:10.1016/j.micinf.2020.01.004
14. Huang C, Wang Y, Li X, Ren L, Zhao J, Hu Y, et al. Clinical features of patients infected with 2019 novel coronavirus in Wuhan, China. Lancet (2020) 395:497–506. doi:10.1016/S0140-6736(20)30183-5
15. Li Q, Guan X, Wu P, Wang X, Zhou L, Tong Y, et al. Early transmission dynamics in Wuhan, China, of novel coronavirus-infected pneumonia. N Engl J Med (2020) 382:1199. doi:10.1056/NEJMoa2001316
16. Riou J, Althaus CL Pattern of early human-to-human transmission of Wuhan 2019 novel coronavirus (2019-ncov), december 2019 to january 2020. Euro Surveill (2020) 25(4). doi:10.2807/1560-7917.ES.2020.25.4.2000058
17. Rothe C, Schunk M, Sothmann P, Bretzel G, Froeschl G, Wallrauch C, et al. Transmission of 2019-ncov infection from an asymptomatic contact in Germany. N Engl J Med (2020) 382(10):970–971. doi:10.1056/NEJMc2001468
18. Tang B, Wang X, Li Q, Bragazzi NL, Tang S, Xiao Y, et al. Estimation of the transmission risk of the 2019-ncov and its implication for public health interventions. JCM (2020) 9(2):462. doi:10.3390/jcm9020462
19. Keeling MJ, Hollingsworth TD, Read JM The efficacy of contact tracing for the containment of the 2019 novel coronavirus (covid-19). J Epidemiol Community Health (2020) 74(10). 861–866. doi:10.1136/jech-2020-214051
20. Dodd PJ, White PJ, Garnett GP Notions of synergy for combinations of interventions against infectious diseases in heterogeneously mixing populations. Math Biosci (2010) 227(2):94–104. doi:10.1016/j.mbs.2010.06.004
21. Kretzschmar ME, Rozhnova G, van Boven M Isolation and contact tracing can tip the scale to containment of covid-19 in populations with social distancing. medRxiv (2020). Available from: https://www.medrxiv.org/content/ doi:10.1101/2020.03.10.20033738
22. Singanayagam A, Patel M, Charlett A, Bernal JL, Saliba V, Ellis J, et al. Duration of infectiousness and correlation with RT-PCR cycle threshold values in cases of covid-19, England. Euro Surveill (2020) 25(32):2001483. doi:10.2807/1560-7917.es.2020.25.32.2001483
23. He X, Lau EHY, Wu P, Deng X, Wang J, Hao X, et al. Temporal dynamics in viral shedding and transmissibility of covid-19. Nat Med (2020) 26(9):672–675. doi:10.1038/s41591-020-0869-5
24. Ashcroft P, Huisman JS, Lehtinen S, Bouman JA, Althaus CL, Regoes RR, et al. Covid-19 infectivity profile correction. Swiss Med Wkly (2020) 150:20336. doi:10.4414/smw.2020.20336
25. Mossong J, Hens N, Jit M, Beutels P, Auranen K, Mikolajczyk R, et al. Social contacts and mixing patterns relevant to the spread of infectious diseases. PLoS Med (2008) 5(3):e74. doi:10.1371/journal.pmed.0050074
26. Lei H, Xu X, Xiao S, Wu X, Shu Y Household transmission of covid-19-a systematic review and meta-analysis. J Infect (2020) 81(6):979–997. doi:10.1016/j.jinf.2020.08.033
27. Teslya A, Pham TM, Godijk NG, Kretzschmar ME, Bootsma MCJ, Rozhnova G Impact of self-imposed prevention measures and short-term government-imposed social distancing on mitigating and delaying a covid-19 epidemic: a modelling study. PLoS Med (2020) 17(12):1003166. doi:10.1371/journal.pmed.1003166
28. Buitrago-Garcia D, Egli-Gany D, Counotte MJ, Hossmann S, Imeri H, Ipekci AM, et al. Occurrence and transmission potential of asymptomatic and presymptomatic sars-cov-2 infections: a living systematic review and meta-analysis. PLoS Med (2020) 17(9):1003346. doi:10.1371/journal.pmed.1003346
29. Backer JA, Mollema L, Klinkenberg D, van der Klis FR, de Melker HE, van den Hof S, et al. The impact of physical distancing measures against covid-19 transmission on contacts and mixing patterns in The Netherlands: repeated cross-sectional surveys. medRxiv (2020). doi:10.1101/2020.06.30.20143560
30. Jarvis CI, Van Zandvoort K, Gimma A, Prem K, Klepac P, Rubin GJ, et al. Quantifying the impact of physical distance measures on the transmission of covid-19 in the UK. BMC Med (2020) 18(1):1–10. doi:10.1186/s12916-020-01597-8
31. Mizumoto K, Kagaya K, Zarebski A, Chowell G Estimating the asymptomatic proportion of coronavirus disease 2019 (COVID-19) cases on board the Diamond Princess cruise ship, Yokohama, Japan, 2020. Euro Surveill (2020) 25(10):180. doi:10.2807/1560-7917.ES.2020.25.10.2000180
32. Roser M, Ritchie H, Hasell J. Coronavirus pandemic (covid-19). Our World in Data (2020). https://ourworldindata.org/coronavirus.
33. Lurie MN, Silva J, Yorlets RR, Tao J, Chan PA Coronavirus disease 2019 epidemic doubling time in the United States before and during stay-at-home restrictions. J Infect Dis (2020) 222(10):1601–1606. doi:10.1093/infdis/jiaa491
34. Hellewell J, Abbott S, Gimma A, Bosse NI, Jarvis CI, Russell TW, et al. Feasibility of controlling covid-19 outbreaks by isolation of cases and contacts. Lancet Glob Health (2020) 74:109. doi:10.1016/S2214-109X(20)30074-7
35. Salathé M, Althaus CL, Neher R, Stringhini S, Hodcroft E, Fellay J, et al. Covid-19 epidemic in Switzerland: on the importance of testing, contact tracing and isolation. Swiss Med Wkly (2020) 150:20225. doi:10.4414/smw.2020.20225
36. Steinbrook R Contact tracing, testing, and control of covid-19-learning from Taiwan. JAMA Intern Med (2020) 180:1163. doi:10.1001/jamainternmed.2020.2072
37. Sun K, Viboud C Impact of contact tracing on sars-cov-2 transmission. Lancet Infect Dis (2020) 20(8):876–877. doi:10.1016/S1473-3099(20)30357-1
38. Cauchemez S, Ferguson NM, Wachtel C, Tegnell A, Saour G, Duncan B, et al. Closure of schools during an influenza pandemic. Lancet Infect Dis (2009) 9(8):473–481. doi:10.1016/S1473-3099(09)70176-8
39. te Beest DE, Birrell PJ, Wallinga J, De Angelis D, van Boven M Joint modelling of serological and hospitalization data reveals that high levels of pre-existing immunity and school holidays shaped the influenza a pandemic of 2009 in The Netherlands. J R Soc Interface (2015) 12(103):20141244. doi:10.1098/rsif.2014.1244
40. Diekmann O, Heesterbeek H, Britton T. Mathematical Tools for Understanding Infectious Disease Dynamics. Princeton, NJ: Princeton University Press (2013). doi:10.2307/j.cttq9530
41. Vos ER, den Hartog G, Schepp RM, Kaaijk P, van Vliet J, Helm K, et al. Nationwide seroprevalence of sars-cov-2 and identification of risk factors in the general population of The Netherlands during the first epidemic wave. J Epidemiol Commun Health (2020) 23:9530. doi:10.1136/jech-2020-215678
42. Bi Q, Wu Y, Mei S, Ye C, Zou X, Zhang Z, et al. Epidemiology and transmission of covid-19 in shenzhen China: analysis of 391 cases and 1,286 of their close contacts. Lancet Infect Dis (2020) 20(8). 911–919. doi:10.1016/S1473-3099(20)30287-5
Keywords: contact tracing, branching process model, effective reproduction number, exponential growth rate, doubling time, social distancing
Citation: Kretzschmar ME, Rozhnova G and van Boven M (2021) Isolation and Contact Tracing Can Tip the Scale to Containment of COVID-19 in Populations With Social Distancing. Front. Phys. 8:622485. doi: 10.3389/fphy.2020.622485
Received: 28 October 2020; Accepted: 31 December 2020;
Published: 10 February 2021.
Edited by:
Sen Pei, Columbia University, United StatesReviewed by:
Hao Lei, Zhejiang University, ChinaWei Wang, Sichuan University, China
Hongyu Miao, University of Texas Health Science Center at Houston, United States
Copyright © 2021 Kretzschmar, Rozhnova and van Boven. This is an open-access article distributed under the terms of the Creative Commons Attribution License (CC BY). The use, distribution or reproduction in other forums is permitted, provided the original author(s) and the copyright owner(s) are credited and that the original publication in this journal is cited, in accordance with accepted academic practice. No use, distribution or reproduction is permitted which does not comply with these terms.
*Correspondence: Mirjam E. Kretzschmar, bS5lLmUua3JldHpzY2htYXJAdW1jdXRyZWNodC5ubA==
 Mirjam E. Kretzschmar
 Ganna Rozhnova
 Michiel van Boven

