 Yue Lin
 Qinghua Zhong
- Guangdong Provincial Key Laboratory of Optical Information Materials and Technology and Institute of Electronic Paper Displays, South China Academy of Advanced Optoelectronics, South China Normal University, Guangzhou, China
The pointer instrument has the advantages of being simple, reliable, stable, easy to maintain, having strong anti-interference properties, and so on, which has long occupied the main position of electrical and electric instruments. Though the pointer instrument structure is simple, it is not convenient for real-time reading of measurements. In this paper, a RK3399 microcomputer was used for real-time intelligent reading of a pointer instrument using a camera. Firstly, a histogram normalization transform algorithm was used to optimize the brightness and enhance the contrast of images; then, the feature recognition algorithm You Only Look Once 3rd (YOLOv3) was used to detect and capture the panel area in images; and Convolutional Neural Networks were used to read and predict the characteristic images. Finally, predicted results were uploaded to a server. The system realized automatic identification, numerical reading, an intelligent online reading of pointer data, which has high feasibility and practical value. The experimental results show that the recognition rate of this system was 98.71% and the reading accuracy was 97.42%. What is more, the system can accurately locate the pointer-type instrument area and read corresponding values with simple operating conditions. This achievement meets the demand of real-time readings for analog instruments.
Introduction
The pointer instrument has been widely used in traditional industries, such as industrial production and power transmission because of its properties of being simple, reliable, stable, less affected by temperature, strong anti-interference, easy to maintain, and so on, but it does not reserve any digital interface. Therefore, most of them must be read by humans. This method has disadvantages of low accuracy, poor reliability and low efficiency. So, the pointer position of the instrument should be converted into digital signals by sensors to realize automatic meter reading, which is of great significance in the application of unattended substation [1].
In order to solve this problem, many automatic recognition numerical reading algorithms based on computer readings have emerged in recent years. The existing pointer instrument recognition algorithms can be divided into two kinds, traditional algorithms based on digital image processing technology and modern algorithms based on machine learning or deep learning [2]. Traditional algorithms are the foundation of dilation and corrosion, and noise reduction filtering and feature matching of image matrixes must be done to perform target recognition. The common traditional algorithms included a binarization threshold segmentation method based on symmetry for dial recognition, and an improved random sample consensus algorithm for pointer reading recognition [3], but this algorithm had high requirements for picture resolution and relatively high definition. Then, a method of accurately positioning the pointer by the Circle-based Regional Cumulative Histogram method was proposed [4]. The adaptability of this method for complex scenes was poor, and the recognition rate was not high. In addition, a visual inspection method was used to detect the transformed image to get the reading of the pointer meter [5]. And a regional growth method was used to locate the dial area and its center, then the improved center projection method was used to perform scale marking and boundary detection by the dial image [6]. Such algorithms based on computer vision and machine learning have poor portability and general versatility. Modern algorithms are machine learning techniques which are used to build and simulate neural networks for analytical learning. From a statistical point of view, this method can predict the distribution of data, learn a model from the data and then use the model to predict new data. So, we can carry out data classification without too much related knowledge [7, 8]. Then, the Mask-RCNN was used to divide the meter dial and the pointer area, the line fitting and angle reading method was used to calculate the pointer reading [9]. The requirement of the instrument placement position in these algorithms was relatively high. At the same time, Faster R-CNN was used to detect the position of the target instrument, and reading by feature correspondence and perspective transformation [10]. However, it had a high requirement for system operation performance. Mask R-CNN was also used to detect key points of tick marks and pointers, then used the intersection of circle and straight line to calculate the reading [11], but the algorithm was complex, and computationally intensive.
Therefore, we proposed a pointer type instrument intelligent reading system based on CNN. The system used a histogram normalization algorithm for image brightness optimization and contrast enhancement, and then YOLOv3 feature recognition algorithm was used to detect a panel area in an image and the corresponding area was saved as a feature image. Then, a multilayer convolution neural network was introduced to read the numerical prediction. The system mainly includes four algorithms: histogram normalization transformation, dial gray-scale transformation, YOLOv3 feature recognition, and convolutional neural network reading prediction, which can accurately locate the panel area and read corresponding numerical values.
System Design Principle
Histogram Normalization Transformation
The electrician and electric pointer meters are often placed in some special rooms, and the surrounding light environment is complicated so that the quality of the surveillance images is low contrast and has a poor image clarity. Since the gray value distribution of image pixels conforms to the law of probability and statistics distribution, the image is preprocessed by the histogram normalization transformation to realize the balanced distribution of image gray levels for improving image contrast and optimizing image brightness [12]. The row of the input image I is r and the column is c. And I(r, c) is the gray value of input image I in row r and column c, O(r, c) is the gray value of output image O in row r and column c. The minimum gray value of I is Imin and the maximum value is Imax. The minimum gray value of O is Omin and the maximum value is Omax. Then relationship among them is shown in Eq. (1).
And it can be converted to Eq. (2).
The process is called histogram normalization transformation. At the same time, O(r, c) can be calculated as Eq. (3), α and β are weight and bias variate.
Therefore, Eq. (4) can be obtained.
As a result, histogram normalization transformation is a linear transformation method to automatically select α and β. General order Omin = 0, Omax = 255, thenEq. (4) can be converted to Eq. (5).
Dial Gray-Scale Transformation
Most of the panel area of pointer meters is a relatively simple color, either black or white. In order to reduce the amount of computation, image data can be transformed into grayscale. According to the importance of three primary colors, and the sensitivity of human eyes to different colors, the three components of color are given weighted averages by different weights [13], and it can be carried out by Eq. (6) to obtain a grayscale image, where i and j represent coordinates of horizontal and vertical of images, R(i, j), G(i, j) and B(i, j) respectively represent components of a points in row i and column j of three primary colors.
You Only Look Once 3rd Feature Recognition
There are two common features in recognition algorithms. One involves candidate regions, and then the region of interest (ROI) is classified, and location coordinates are predicted. This kind of algorithm is called two-stage feature recognition algorithm [14]. Another is one-stage detection algorithm, which needs one network to generate the ROI and predict the category, such as the YOLOv3 feature recognition algorithm [15]. Compared with the two-stage feature recognition algorithm, YOLOv3 uses a single network structure to predict object category and location for generating candidate regions, and each real box of YOLOv3 only corresponds to a correct candidate area [16]. These features provide YOLOv3 with less computation and a faster detection speed, which is more suitable for porting to an embedded computing platform due to weak computing performance.
A standard network structure of YOLOv3 has 107 convolutional layers. The first 74 are based on the Darknet-53 network layer and serve as the main network structure. The 75th to 107th layers are the feature interaction layers, which realizes local feature interaction by means of convolution kernel [17]. Because the target operating platform is an embedded platform, and recognition characteristics of pointer meters are relatively obvious, a simplified version of YOLO network structure YOLOv3 Tiny was used as a network structure by us. Its network structure is shown in Figure 1, CONV was a convolution operation, POOL was a pooling operation, and UPSAMPLE was an up sample operation. To reduce computation, the input layer used color images which was resized to a width of 640 pixels and height of 640 pixels, and the YOLO Layer was used as the output layer. Although YOLOv3 Tiny network only retained 24 convolutional layers, it still retained two YOLO network layers, which greatly reduced the amount of computation and still ensured the accuracy of model recognition [18, 19].
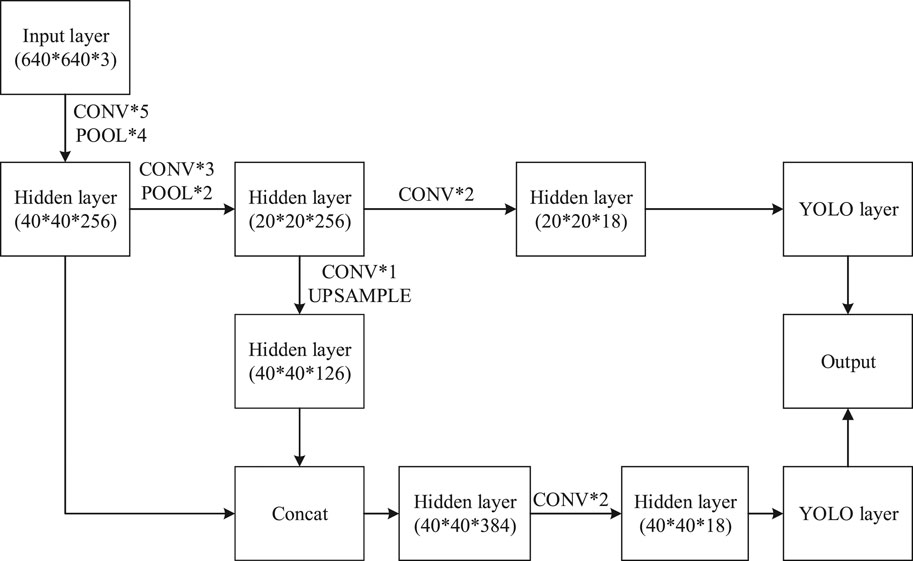
FIGURE 1. YOLOv3 Tiny Network structure diagram. CONV is a convolution operation, POOL is a pooling operation, and UPSAMPLE is an up sample operation.
Convolutional Neural Network Reading Prediction
As a feedforward neural network, the convolutional neural network has excellent performance in large-scale image processing and it has been widely used in image classification and positioning. Panel image data cannot be linearly classified. To deal with this kind of data, we proposed a multi-layer convolutional neural network, which could perform the classification by mapping the original data to a linearly separable high-dimensional space, and then a specific linear classifier was used [20, 21]. A three-layer neural network model including an input layer, a hidden layer and an output layer was used to train the image data of panel areas by numerical reading [22], as shown in Eq. (7).
If input x has m nodes and output f(x) has n nodes, then weight vector W is a matrix with n rows and m columns. Input x is a vector with length m, bias vector b is a vector with length n, act is an activation function, and f(x) returns an n-dimensional vector.
The input layer to hidden layer is a fully connected network, each input node is connected to all hidden layer nodes. So, each hidden layer node is equivalent to a neuron, then the output of all nodes of the hidden layer becomes a vector. If the input layer is a vector x, and hidden layer node h has a weight vector Wh, a bias vector bh, and tanh function is used for the activation function, the output expression of the hidden layer node is shown as Eq. (8).
The hidden layer to output layer is also a fully connected network, which can be held as a cascade of neurons on the hidden layer. Since it is multi-classified, activation function can use Softmax Regression function, and output formula in output layer is shown in Eq. (9).
The network structure of CNN used by us is shown in Table 1, where CONV was a convolutional layer, POOL was a pooling layer, and FC was fully connected layers. Input image was a grayscale image with a size of 80 × 80 and there were 26 types of output result.
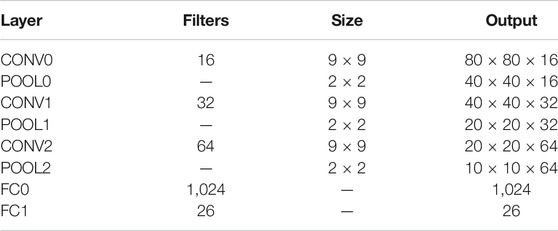
TABLE 1. | Architecture of proposed CNN algorithm.
Experiment and Discussion
The intelligent reading system consists of two parts: model training and model invocation. Before training, histogram normalization and grayscale transformation were carried out on an image. Then, YOLOv3 feature recognition algorithm was used to train the image to obtain a model of instrument panel. Then, a multi-layer neural network model was built, and numerical reading training was carried out for the instrument panel to obtain a respective model. An RK3399 microcomputer was used to get images by a camera in real time, a histogram normalization algorithm was applied to transform the image brightness optimization and enhance contrast preprocessing. The instrument panel model is called to detect panel area in an image, and extract corresponding regional image, the model of multi-layer neural network model was used for features of an image to read numerical predictions. Finally, we uploaded data by WIFI for subsequent operations. The specific process is shown in Figure 2.
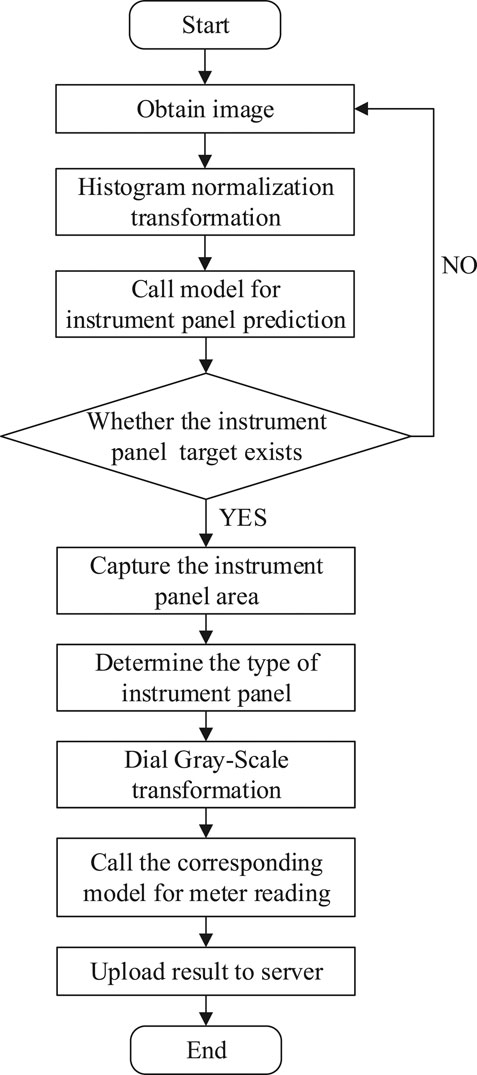
FIGURE 2. RK3399 microcomputer workflow flowchart.
System Hardware Architecture
The instrument intelligent reading system designed in this paper was composed of a host and a camera. A microcomputer of an RK3399 hardware platform, which was made by Friendly Arm, was used as the host. The RK3399 processor was a six-core 64-bit CPU newly developed with “big.LITTLE” core architecture had two Cortex-A72 large kernels and four Cortex-A53 small kernels by Rockchip. The system had a computing performance close to a CPU whose main frequency is up to 1.8 GHz. It supported WIFI and USB peripherals, and could connect to the Internet and external cameras. The camera used a generic industrial-grade USB camera which had a Built-in Sony Complementary Metal Oxide Semiconductor image sensor. The physical object of the system is shown in Figure 3, a camera was connected to the host by an USB interface, the system was connected to the network by a WIFI module or an Ethernet network port, and the power was supplied by a Type-C interface.
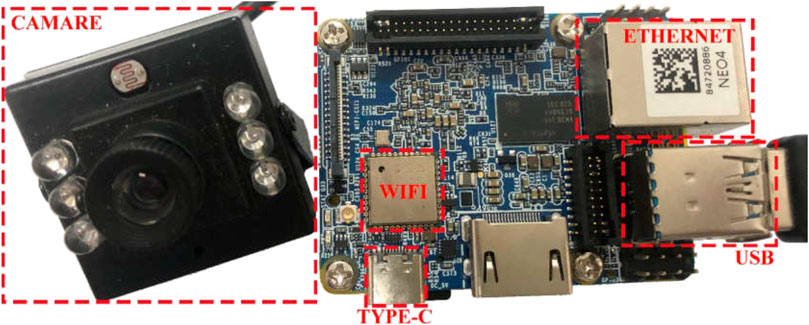
FIGURE 3. Instruments in our intelligent reading system, in which a camera was connected to the host by a USB interface, the system was connected to the network by a WIFI module or an Ethernet network port, and the power was supplied by a Type-C interface.
Software Architecture
An RK3399 hardware platform was used as the hosting platform. An Ubuntu 18.04 operating system was installed on the hardware platform, and python3.6, tensorflow1.12 and opencv2.0 operating environments were deployed. Table 2 is the comparison of the elapsed time. Both had 4G RAM and run Ubuntu 18.04 system, and RK3399 main frequency was locked at 1.8 GHz, I5-7200U was locked at 2.5 GHz. The time for taking photo means how long it requires to take a picture, the time of histogram normalization transformation means how long it can complete histogram normalization transformation, the time of calling YOLOv3 model means how long it takes call a YOLOv3 model, the time of calling CNN model means that how long it takes to call a CNN model. It can be seen that, although the computing performance of the RK3399 hardware platform was worse than that of the ordinary computer platform, it has satisfied the operational requirements of our project. Moreover, it had a high degree of integration and the volume was far smaller than that of ordinary computers, which has greatly improved the portability and flexibility of the system. In addition, it has more advantages in power consumption and cost.
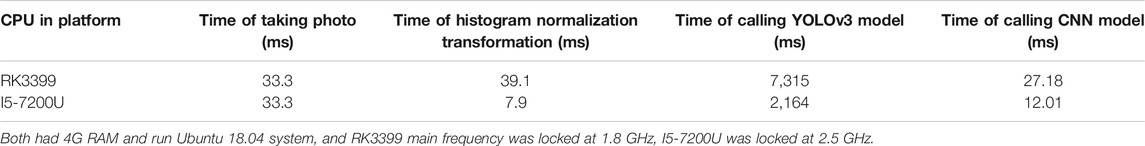
TABLE 2. | Comparison of the running time of the algorithm in different platforms.
In experiments, a total of 3,745 images were collected as the data set, the original size of images was 1,920 height and 1,080 width. 374 images were randomly chosen from the data, and they were s1 et as validation data, and remaining images were used as training data. In order to ensure the final training result, the data set included images with different tilt angles, different rotation angles, different lighting levels and different degrees of cover.
Histogram Normalization Transformation
Histogram normalization transformation was carried out to automatically adjust image brightness and enhance contrast, so as to make the regional features of pointer instruments more obvious, and the recognition accuracy of the target recognition algorithm was also improved. Figure 4 is a comparison of image histograms before and after a normalized histogram transformation, in which the horizontal axis x represents the gray level and the vertical axis Y represents the number of pixel elements in each gray level, the unit is 105 pixels, blue represents the gray distribution of an image before the normalized histogram transformation, and yellow represents the transformed gray distribution. The image processing effect is shown in Figure 5. The left is a pre-processing image, and the right is a finished effect image. The brightness of the image was obviously optimized, while the contrast was increased, which produced clearer details in the darker areas.
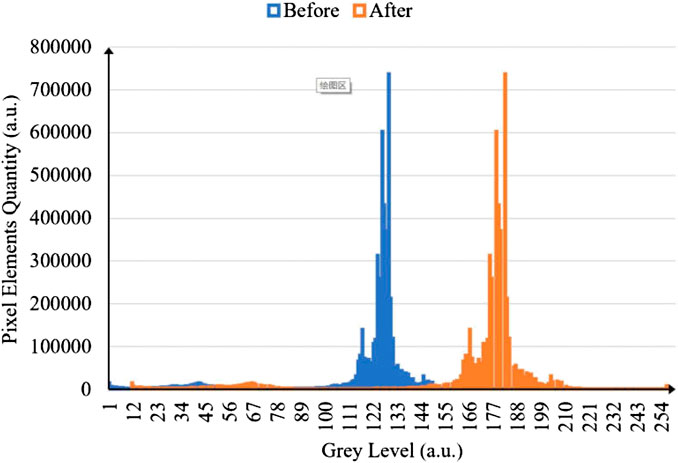
FIGURE 4. Histogram comparison before and after normalized transformation, blue represents the gray level distribution of an image before the normalized histogram transformation, and yellow represents the transformed gray distribution
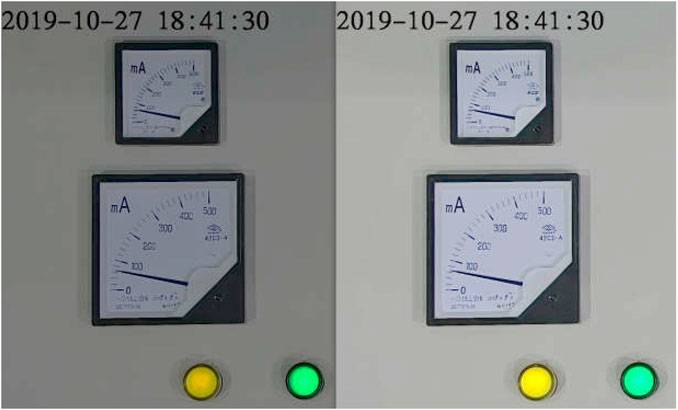
FIGURE 5. Histogram normalization transformation effect comparison, the left is the pre-processing image, and the right is the finished effect image. The brightness of the image was obviously optimized, while the contrast was increased, which produced clearer details in the darker areas.
Pointer Instrument Identification Training
To check the performance superiority of the proposed algorithm, two kinds of two-stage feature recognition algorithms, Faster R-CNN [10] and Mask RCNN [23], were transplanted to the RK3399 hardware platform. Faster R-CNN used Vgg16 as the feature extractor and Mask RCNN used Resnet-18 as the feature extractor. Compared with the algorithm in our system, the average value was calculated after the prediction of all data sets. In order to achieve better results with a shorter training time, we set the epoch to 2,000 and batch size to 8. The learning rate was set to 0.01. The actual prediction results are shown in Table 3. Compared with the Fast R-CNN algorithm of a Vgg16 network structure, the operation time used in this system was shortened by 1.7 s, the recognition accuracy was improved by 0.67%, and the time spent in model training was shortened by 19.6 h. Compared with the Mask RCNN algorithm with a resnet-18 network structure, the operation time was reduced by 3.4 s, the recognition accuracy was improved by 0.46%, and the time spent in model training was reduced by 30.2 h. Three algorithms were used to predict the target image, and the target region prediction results of pointer instrument are shown in Figure 6. The experimental results showed that compared with the Mask RCNN and Faster R-CNN algorithms, the proposed algorithm not only had a slight improvement in the recognition accuracy, but also had a great advantage in the call time of the model, which was more suitable for transplantation to an embedded platform. Moreover, it greatly shortened the length of time consumed by the training model.
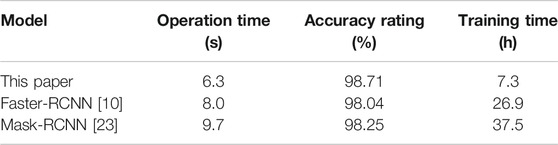
TABLE 3. | The data comparison between our algorithms and others. Epoch was set to 2,000 and batch size to 8. The learning rate was set to 0.01.
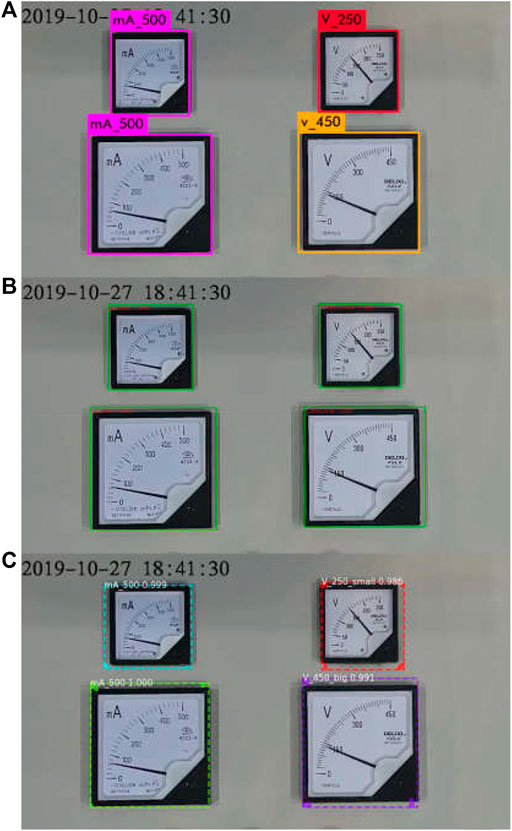
FIGURE 6. The target region predicted results of the pointer instrument by the three algorithms. (A) The predicted result which used the algorithms by this paper. (B) The predicted result which used Faster R-CNN algorithms. (C) The predicted result which used Mask RCNN algorithms.
Pointer Meter Reading Training
Compared with the traditional machine vision algorithm, the multi-layer neural network had the advantages of high universality, wide application range, and high prediction accuracy in the recognition application, especially in the scene with complex environmental illumination. We used the algorithm proposed by Lai et al [24] to predict the readings of the data set. In complex situations, and in some lights, the recognition accuracy rate was very low, when the images’ angles were changed, either tilted, rotated around, or the microscopic angle changed, the identification accuracy could be reduced. As shown in Figure 7, the identification result is very inaccurate, or even unable to be identified. The image in Figure7A can only identify the scale in the clockwise direction, and the identification result of the scale value was unstable, as shown in figure7B. Because the dial area in Figure7C was fuzzy, only the pointer could be identified, the scale and scale value cannot be identified. As shown in Figure7D, because of the uneven dial scale values, special treatment was required. So, in the four cases, the algorithm in this paper can carry out perfect recognition without interference. In particular, the trained model can even predict the reading result which exceeded the accuracy of a scale value when the data set was well processed. As shown in Figure8, it could have read 70 or 80 V, but reading results showed that the voltage was 75 V. Table 4 is the comparison of the verification results of reading prediction for the data set between the algorithm used in this system and a traditional algorithm [24]. The accuracy rating is the average verification accuracy found by training all data sets. The operation time means the average time consumed by training all data sets. Although the algorithm used in this system was time-consuming, its accuracy rate was significantly increased, which greatly improved the reliability of system readings.
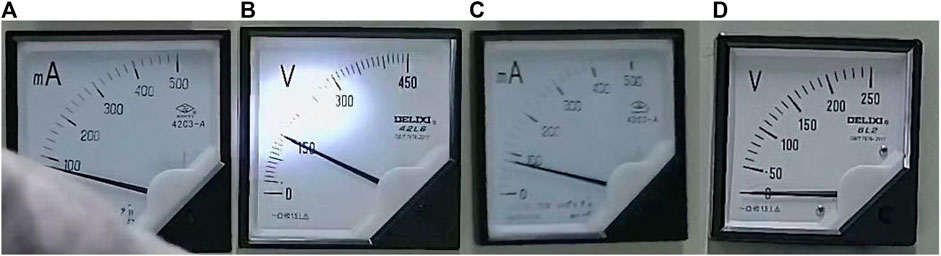
FIGURE 7. The situation of inaccurate identification results. (A) It can only identify the scale in the clockwise direction, and the identification result of the scale value was unstable, while the contrary was the case in (B), (C) was fuzzy, only the pointer can be identified, and the scale and scale value cannot be identified. (D) Because of the uneven dial scale values, special treatment was required.

FIGURE 8. The reading result which exceeds the accuracy of a scale value. It could have read 70 or 80 V, but reading results showed that the voltage was 75 V
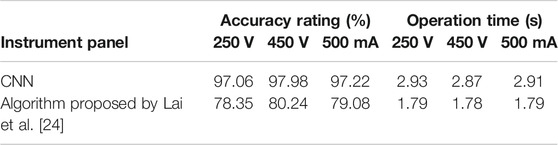
TABLE 4. | Comparison of verification results of the data set between the algorithm used in this system and a traditional algorithm [24].
Conclusion
An instrumental intelligent reading system was designed in this paper, which had a recognition rate of 98.71% for pointer instrument panel and a reading accuracy rate of 97.42% for numerical values. It can accurately locate panel area and read corresponding values to meet the demand of real-time detection for pointer instruments. In addition, identification results can be uploaded to a server synchronously for monitoring online, which was convenient for real-time detection of on-site measurement problems. At the same time, it was convenient to collect and analyze historical data for system optimizations. Moreover, the system had simple operating conditions, compact size and convenient use. There was no need to modify the instrument itself, and it retained the advantages of pointer instruments, which has a high feasibility and a practical value.
Data Availability Statement
The original contributions presented in the study are included in the article/Supplementary Material, further inquiries can be directed to the corresponding author.
Author Contributions
YL and QZ designed this project. YL carried out most of the experiments and data analysis. HS contributed to the data analysis and correction. All authors have read and agreed to the published version of the manuscript.
Funding
This research was funded by National Key Research and Development Program of China (2016YFB0401501), Science and Technology Program of Guangzhou (No. 2019050001), Program for Chang Jiang Scholars and Innovative Research Teams in Universities (No. IRT_17R40), Program for Guangdong Innovative and Enterpreneurial Teams (No. 2019BT02C241), Guangdong Provincial Key Laboratory of Optical Information Materials and Technology (No. 2017B030301007), Guangzhou Key Laboratory of Electronic Paper Displays Materials and Devices (No. 201705030007) and the 111 Project.
Conflict of Interest
The authors declare that the research was conducted in the absence of any commercial or financial relationships that could be construed as a potential conflict of interest.
References
1. Zhang T, Zhang S, Wang P. Automatic recognition of instrument dial readings with multiple reference points. In: IEEE 2017 Chinese Automation Congress. Jinan (2018).
2. Yi ZC, Chen ZB, Peng B, Li SX, Bai PF, Shui LL, et al. Vehicle lighting recognition system based on erosion algorithm and effective area separation in 5G vehicular communication networks. IEEE Access (2019) 7: 111074–83. doi:10.1109/ACCESS.2019.2927731
3. Ma YF, Jiang Q. A robust and high-precision automatic reading algorithm of pointer meters based on machine vision. Meas Sci Technol (2019) 30(1):21–7. doi:10.1088/1361-6501/aaed0a
4. Yang Z, Niu W, Peng X, Gao Y, Dai Y. An image-based intelligent system for pointer instrument reading. In: IEEE International Conference on Information Science and Technology. Shenzhen (2014).
5. Bao HJ, Tan QC, Liu ST, Miao JW. Computer vision measurement of pointer meter readings based on inverse perspective mapping. Appl Sci Basel (2019) 9(18):13–9. doi:10.3390/app9183729
6. Chi J, Liu L, Liu J, Jiang Z, Zhang G. Machine vision based automatic detection method of indicating values of a pointer gauge. Math Probl Eng. (2015) 12:1–19. doi:10.1155/2015/283629
7. Jorge N. Optimization methods for large-scale machine learning. SIAM Rev (2016) 60(2):33–7. doi:10.1137/16M1080173
8. Zhang Q, Yang LT, Chen Z, Li P. A survey on deep learning for big data. Inf Fusion (2018) 42:146–57. doi:10.1016/j.inffus.2017.10.006
9. He P, Zuo L, Zhang C, Zhang Z. A value recognition algorithm for pointer meter based on improved mask-RCNN. In: International Conference on Information Science and technology. Hulunbuir (2019).
10. Liu Y, Liu J, Ke Y. A detection and recognition system of pointer meters in substations based on computer vision. Measurement. (2020) 152:122–6. doi:10.1016/j.measurement.2019.107333
11. Perez FJ, Signol F, Perez-Cortes JC, Fuster A, Pollan M, Perez B, et al. A deep learning system to obtain the optimal parameters for A threshold-based breast and dense tissue segmentation. Comput Methods Progr Biomed (2020) 14:195. doi:10.1016/j.cmpb.2020.105668
12. Yadav J, Rajpal N, Mehta R. An improved illumination normalization and robust feature extraction technique for face recognition under varying illuminations. Arab J Sci Eng (2019) 44(11):9067–86. doi:10.1007/s13369-019-03729-6
13. Wen K, Li D, Zhao X, Fan A, Mao Y, Zheng S. Lightning arrester monitor pointer meter and digits reading recognition based on image processing. In: Proceedings of 2018 IEEE 3rd advanced Information technology, electronic and automation Control Conference. Chongqing (2018).
14. Ahmed B, Gulliver TA, Saif AS. Image splicing detection using mask-rcnn image splicing detection using mask-rcnn. Signal Image Video Process (2020) 7:7. doi:10.1007/s11760-020-01636-0
15. Liu G, Nouaze JC, Touko PL, Kim JH. YOLO-tomato: a robust algorithm for tomato detection based on YOLOv3. Sensors (2020) 20(7):27. doi:10.3390/s20072145
16. Tian Y, Yang G, Wang Z, Li E, Liang Z. Detection of apple lesions in orchards based on deep learning methods of CycleGAN and YOLOV3-dense. J Sensors (2019) 17:121–7. doi:10.1155/2019/7630926
18. Fu L, Feng Y, Wu J, Liu Z, Gao F, Majeed Y, Al-Mallahi A. Fast and accurate detection of kiwifruit in orchard using improved Yolov3-tiny model. Precis Agric (2020) 7:144–65. doi:10.1007/s11119-020-09754-y
19. Zhang Y, Shen YL, Zhang J. An improved tiny-Yolov3 pedestrian detection algorithm. OPTIK Int J Light Electron Opt (2019) 183:17–23. doi:10.1016/j.ijleo.2019.02.038
20. Krizhevsky A, Sutskever I, Hinton G. ImageNet classification with deep convolutional neural networks. Adv Neural Inform Process Syst (2012) 25(2):22–39. doi:10.1145/3065386
21. Shin HC, Roth HR, Gao M, Lu L, Xu Z, Nogues I. Deep convolutional neural networks for computer-aided detection: CNN architectures, dataset characteristics and transfer learning. IEEE Trans Med Imag (2016) 35(5):1285–98. doi:10.1109/TMI.2016.2528162
22. Liu W, Wang Z, Liu X, Zeng N, Lin Y, Alsaadi FE. A survey of deep neural network architectures and their applications. Neurocomputing (2017) 234:11–26. doi:10.1016/j.neucom.2016.12.038
23. Zuo L, He P, Zhang C, Zhang ZA. Mask RCNN based automatic reading method for pointer meter. Neurocomputing (2020) 388:90–101. doi:10.1016/j.neucom.2020.01.032
Keywords: pointer instrument, deep learning, You Only Look Once 3rd, convolutional neural networks, automatic reading
Citation: Lin Y, Zhong Q and Sun H (2020) A Pointer Type Instrument Intelligent Reading System Design Based on Convolutional Neural Networks. Front. Phys. 8:618917. doi: 10.3389/fphy.2020.618917
Received: 19 October 2020; Accepted: 12 November 2020;
Published: 09 December 2020.
Edited by:
Chongfu Zhang, University of Electronic Science and Technology of China, ChinaReviewed by:
Junsheng Mu, Beijing University of Posts and Telecommunications (BUPT), ChinaYuanquan Hong, Shaoguan University, China
Copyright © 2020 Lin, Zhong and Sun. This is an open-access article distributed under the terms of the Creative Commons Attribution License (CC BY). The use, distribution or reproduction in other forums is permitted, provided the original author(s) and the copyright owner(s) are credited and that the original publication in this journal is cited, in accordance with accepted academic practice. No use, distribution or reproduction is permitted which does not comply with these terms.
*Correspondence: Qinghua Zhong, emhvbmdxaEAxNjMuY29t