- 1Institute of Cell Biophysics of the Russian Academy of Sciences, Federal Research Center “Pushchino Scientific Center for Biological Research of the Russian Academy of Sciences”, Pushchino, Russia
- 2Institute of Theoretical and Experimental Biophysics, Russian Academy of Sciences, Pushchino, Russia
This paper describes a new method for measuring the spectra of infrared radiation emitted by protein solutions in the native state without any external excitation. Radiation is detected using a vacuum Fourier-transform infrared spectrometer, and the tested sample itself is a source of radiation. The necessary conditions for detecting radiation from a sample are the use of a highly sensitive cooled detector and the presence of a cold background. In this work, the background was a black body at the boiling point of nitrogen. It is also important to select the optimal vacuum pumping depth for the spectrometer and sample thickness. Radiation occurs due to spontaneous radiative transitions from excited vibrational energy states to the ground state of molecules. The intensity of radiation is determined by the population of the respective energy states, which, according to the Boltzmann distribution, depends on temperature and frequency. Using solution of human interferon gamma as an example, it has been shown for the first time that proteins have intrinsic radiation. The described method allows detecting spectral lines with a radiation power of about 10−8 W or even less. It has also been demonstrated that emission spectroscopy offers advantages in the signal-to-noize ratio compared to absorption spectroscopy and allows analyzing the structural characteristics of a protein, in particular, providing information about its secondary structure. Another significant advantage of the method described in the article is its noninvasiveness. At the sample temperature of 25°С, emission spectra can be detected in the range from 400 to 3,600 cm−1, which covers almost the entire frequency range of existing stretching and bending vibrations of molecules. At the same time, in the fingerprint region from 500 to 1,600 cm−1 (the most informative part of the infrared spectrum), the highest sensitivity of the method is demonstrated. There is also potential for extending the available frequency range into the far infrared and terahertz ranges. Being applicable to the study of protein solutions in low concentrations, the proposed approach is not only interesting from the point of view of fundamental science but also can have applied significance in biological and medical research.
Introduction
In the mid-twentieth century, first studies appeared that demonstrated the large potential of infrared (IR) spectroscopy for protein research [1, 2]. These days, IR spectroscopy has steadily been among methods for studying protein structures at the different levels of their organization [3–7]. In protein studies, IR spectroscopy is predominantly used as part of absorption spectroscopy techniques (i.e., for measuring absorption spectra). Yet no protein emission spectroscopy techniques are known to be applied to detecting the spectra of protein intrinsic radiation. However, in terms of fundamental research, it is an alternative method of obtaining spectral information about protein structure and it could prove practical.
It is noteworthy that the popular western blot technique [8, 9], within the framework of which radiation from a protein is detected, or methods using GFP-derived fluorescent proteins [10–12] are not related in the literal sense to emission spectroscopy, as radiation occurs in those methods as a result of chemiluminescence or fluorescence processes. Although there have been studies to measure IR emission spectra of proteins [13–15], these have involved the exposure of proteins to radiation from different frequency ranges. In other words, some external treatment was required to cause the protein to generate radiation in all of the described cases.
While having no application in protein research, emission spectroscopy methods are fairly well refined and are widely used in two other science areas–in space research [16, 17] and in atmospheric science [18–20]. A lot of essential laws of emission spectroscopy have been described within these areas. There are studies that use spectroscopy to examine nonplanetary or cosmic objects, but these are very scarce. The examples include solids and films [21, 22], liquids [23], and gases [24]. All these studies describe a crucial problem: background heat radiation disguises the sample’s radiation and prevents measuring it. However, a solution has been suggested to tackle this problem. It is based on the Stefan–Boltzmann law, which states that the power radiated from a black body is proportional to T4. Therefore, within the studies described above, it is necessary to heat tested samples to at least dozens or sometimes thousands of degrees above the environment temperature. Obviously, this approach is not applicable to proteins in the native state. There have also been highly labor-intensive attempts to measure emission spectra with a spectrometer fully cooled to nitrogen temperatures [25]. This approach is not applicable to studying biological samples, as is the one with heating.
In this work, we propose a new approach to IR spectroscopy of protein solutions based on the measurement of their own radiation. It is proposed to use a decrease in the background thermal radiation instead of heating the sample. This allows measuring the emission spectra of solutions at ambient temperature and in normal phase state.
Materials and Methods
Measurement System of Emission Spectra
The system for measuring emission spectra was assembled on the basis of a Vertex 80v vacuum FT-IR spectrometer (Bruker, Germany). It is shown in Figure 1.
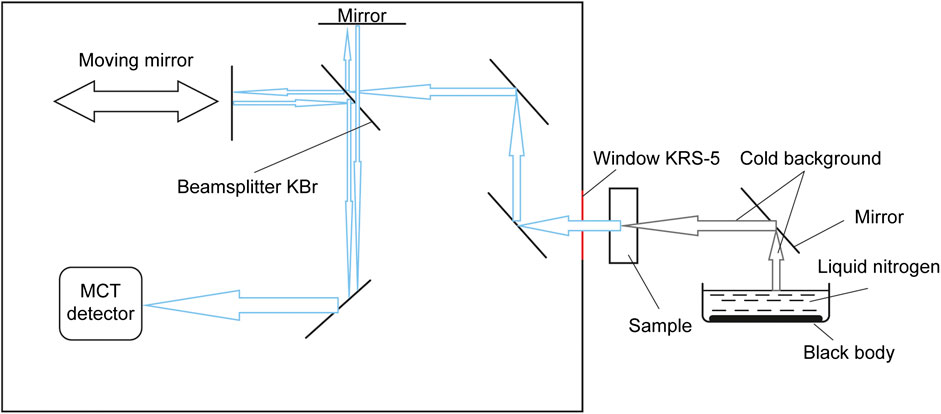
FIGURE 1. Equipment configuration based on a vacuum Fourier transform IR spectrometer for measuring emission spectra.
The spectrometer was set up so that the sample under study served as the radiation source. The sample was placed in the focus of the optical system.
Formation of a cold background that shields from the heat radiation of the environment is crucial to measuring the sample emission spectrum at room temperature. To do this, we used a container filled with liquid nitrogen. A plate coated with a dense layer of soot was submerged to the bottom of the container to mimic a black body (see Figure 1). In this work, this kind of background is referred to as a “cold background”.
Another essential condition for measuring radiation from non-heated objects is using high-sensitivity detectors. A liquid nitrogen-cooled MCT detector was employed within this study. The detector’s vacuum jacket was pumped out prior to measurements by a vCube Turbo Station (Turbo Vacuum, USA) to 10−6 torr.
Spectra of 400–7,500 cm−1 were analyzed in this work. The detector window and the window in the spectrometer wall (the radiation entrance window) were made from KRS-5, and beamsplitter from KBr.
The spectrometer was set to a spectral resolution of 8 cm−1. No higher resolution was required as spectra of aqueous solutions did not show the presence of narrow bands.
Spectrometer Evacuation
Prior to spectrum measurements, the spectrometer was pumped down using an Adixen ACP 15 vacuum pump (Alcatel, France). The system is able to reach a vacuum of less than 1 mbar in the spectrometer. However, it was found that such a deep pumping led to the measured emission spectrum containing, apart from the sample’s spectrum, characteristic emission bands of water vapor and CO2. That turned out to be disturbing radiation (Figure 2) emitted from the air layer around the sample. If the spectrometer is not pumped down at all, the water vapor and CO2 present in the air inside the spectrometer absorb the radiation from the sample. This means that the sample begins to serve as a radiation source while the air inside the spectrometer serves as the measured sample. This also results in a distortion of the radiation spectrum.
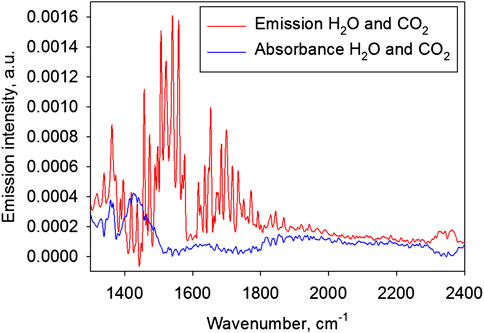
FIGURE 2. The air spectra (without sample) measured against the cold background. Red line: the emission spectrum (the spectrometer pumped down to a vacuum of 0.9 mbar); blue line: the absorption spectrum (atmospheric air pressure in the spectrometer).
Figure 2 shows two spectra measured using the above configuration (Figure 1) but without a sample. The figure shows two extreme cases: with deep pumping of the spectrometer and without pumping.
To eliminate the effect of water vapor and CO2, a vacuum depth was selected at which radiation and absorption compensated each other. A vacuum of 95–105 mbar proved to be optimal for the system described.
Measuring Cuvette
Figure 3 displays a schematic drawing of the measuring cuvette.
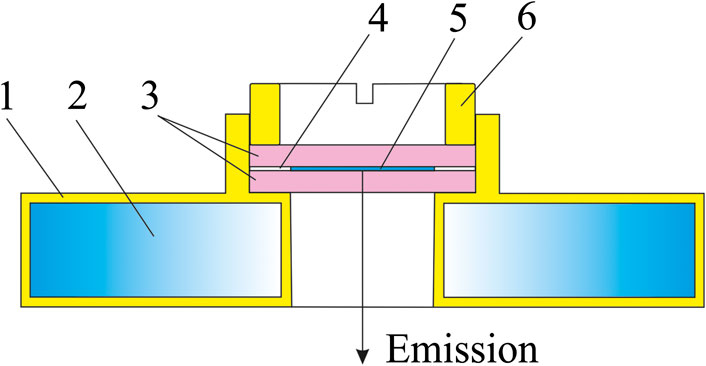
FIGURE 3. Cuvette with a thermostatic holder for measuring emission IR spectra: 1–thermostatic jacket, 2–channel for liquid flow at a set temperature, 3–cuvette windows, 4–PTFE spacer, 5–liquid sample, 6–screw down cover.
The cuvette windows were made from KRS-5 and had a diameter of 50 mm and thickness of 2 mm. Two 5 μm thick PTFE spacers were placed between the edges of the windows. A 20 μL sample drop was positioned at the midpoint between the windows and it spread across the whole area of the windows after they were pressed together. The windows with the sample were mounted in a brass holder and secured with a screw cover. The holder had an inner channel for fluid flow at a set temperature used for thermostatting.
Tested Samples
The emission spectra of aqueous solutions prepared from recombinant human interferon gamma (IFNγ) with a molecular weight of 16.8 kDa in phosphate-buffered saline (pH 7.4) at 1 mg/ml (OOO “NPF “Materia Medica Holding”, Russia) were measured in the study. In all instances, deionized water obtained on a Milli-Q unit (Merck Millipore, Germany) with a conductivity of 18.3 MΩ×cm was used for preparing protein solutions and washing the cuvette. All samples were maintained at a constant temperature of 25°С during measurements.
Results and Discussion
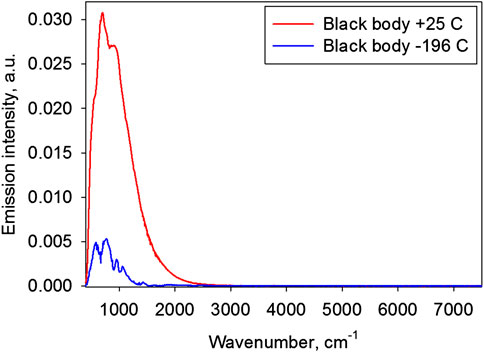
In control experiment measurements of emission spectra in the absence of the sample were performed. These measurements represent background emission spectra, namely black body spectra. Black body spectra at +25 and −196°C (liquid nitrogen) are presented in Figure 4.
Although the spectra are slightly distorted by the hardware function, they basically correspond to the characteristics of the black body spectra. With decreasing temperature, the integrated radiation power falls (Stefan–Boltzmann law) and the spectrum maximum shifts toward lower frequencies (Wien's displacement law).
Figure 5 demonstrates a water emission spectrum measured against the cold background.
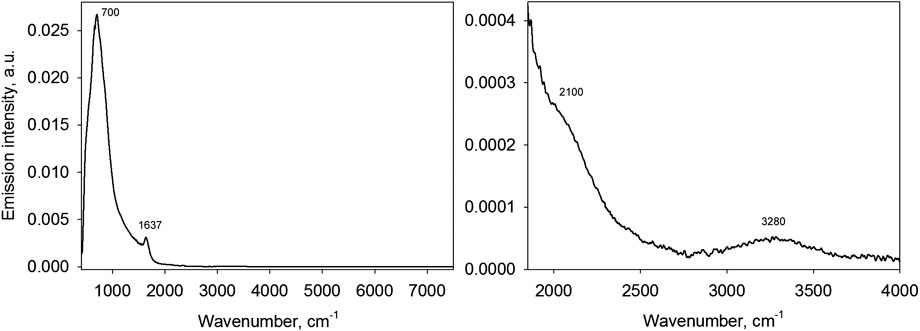
FIGURE 5. A water emission spectrum at 25°С in the range of 400–7,500 cm−1(on the left) and the same spectrum scaled up (on the right).
Two distinct peaks are observed in the water spectrum at wavenumbers of approximately 700 and 1,637 cm−1. On scale up, two more emission bands also become visible at around 2,100 (as a shoulder) and 3,280 cm−1. It can be established that each band in the water emission spectrum can be matched with a particular water absorption band (Figure 6): the libration band (720 cm−1), bending band (1,647 cm−1), combined libration + bending band (2,200 cm−1) and the stretching band (3,400 cm−1).
Based on the above-mentioned observation, a physical interpretation can be given to the emission spectra observed. Radiation from the sample occurs due to spontaneous transitions of molecules from excited vibrational energy states to the ground state. In other words, this process is reverse to the absorption when the emission intensity drops with the passage through a substance due to the transition of molecules from the ground to an excited state. Since both types of spectra (emission and absorption ones) are determined by the quantum structure of molecules, these frequencies should coincide.
Still, there are some differences between emission and absorption spectra: the emission band maxima are somewhat shifted toward lower frequencies and with increasing frequency the emission band intensity decreases. This can be explained in the following way. For photon emission, molecules should be in an excited state. At non-zero temperature, some fraction of molecules is in excited energy states which is commonly referred to as excited states populations. In the absence of degeneracy of the energy state, the population of an excited state NE relative to the ground state population N0 is determined according to the Boltzmann distribution:
where
It is worth separately noting an important methodological issue. The emission spectra (Figures 5,7) we measured using the described radiation detection system (Figures 1,3) were acquired from a 5 μm thick solution layer. This thickness was selected so as to ensure that the spectra contained the maximum information. On one hand, the emission band intensity declines with decreasing thickness. On the other hand, greater thickness leads to increased radiation of the sample, which at that point begins to self-absorb the radiation, i.e., to shield the radiation of the cold background and its own intrinsic radiation. As a result, when the thickness of an aqueous solution reaches approximately 30 μm, the emission spectrum becomes indistinguishable from the blackbody radiation at the temperature of the sample and stops being informative. However, a 5 μm thick layer is preferable specifically for aqueous solutions, while other types of samples should have the thickness selected based on their absorption capacity.
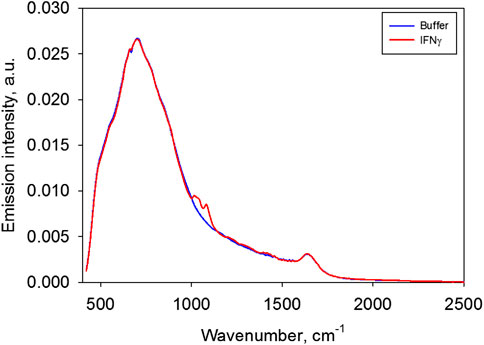
Figure 7 presents the emission spectra of IFNγ solution and a buffer solution.
Figure 7 shows that apart from the emission bands characteristic of water, there are bands which seem to correspond to the protein’s radiation. Figure 8 demonstrates the difference spectra of the IFNγ solution used at two concentrations and the buffer.
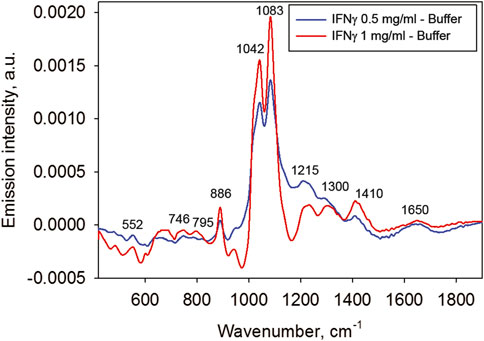
FIGURE 8. The difference emission spectra of the IFNγ solutions (at 1 and 0.5 mg/ml concentrations) and the buffer.
The difference spectra reveal multiple characteristic bands of the protein molecule. Notably, emission bands are observed at the same frequencies for both protein concentrations, and absorption spectrum bands (not shown) are noticed around the same frequencies. This supports the fact that even weak emission bands observed do not represent noise but provide information on the protein structure.
Each peak in the emission spectra of IFNγ (Figure 8) can be associated with appropriate molecule groups of the protein to obtain relevant information on the amino acid composition and intramolecular bonds. This work did not aim at interpreting the indicated IR bands of the protein and is limited to demonstrating the possibility of obtaining them using the described method.
We shall specifically look at the emission band at around 1,650 cm−1. It is apparently an Amide I band, which belongs to a type of peptide bond vibrations [26]. This band is quite informative for determining a protein secondary structure. Generally, this band is difficult to isolate when analyzing absorption spectra of protein solutions because it is very weak and overlaps with a far stronger bending vibration band of water (see Figure 6). Nonetheless, the Amide I band is easily observable in the emission difference spectra shown in Figure 8 despite the low concentration of protein.
In order to use this band to derive information about the protein secondary structure, the emission spectrum should be adjusted for the population of energy states by dividing the spectrum by the right-hand part of Eq 1. The adjusted amide I band is shown in Figure 9.
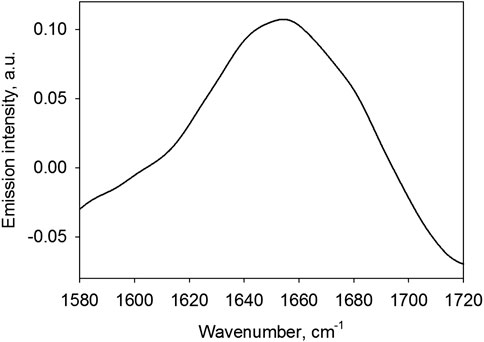
FIGURE 9. Emission spectrum of a 0.5 mg/ml IFNγ solution in the region of the Amide I band divided by the population of energy levels (1).
The amide I band peak is located at 1,654.36 cm−1. As is known Ref. 3, 4, 27, the position of the peak in the range of 1,645–1,660 cm−1 indicates that the secondary structure of a protein is predominantly alpha-helical and it contains no beta sheets. At the same time, there can be a small contribution of turns with the maximum in the range of 1,662–1,686 cm−1 and disordered structure, for which the characteristic frequencies are 1,642–1,657 cm−1. These conclusions well agree with the actual IFNγ structure (see database Ref. 28), suggesting that the secondary structure of this protein is mainly composed of alpha-helical segments in the absence of beta sheets. This result explicitly demonstrates the capabilities of IR emission spectroscopy as applied to analysis of the secondary structure of proteins in solutions, although it is only qualitative. As is known, in order to separate all possible secondary structure types of a protein, calculating the percent contribution of each type, the spectral band shape needs to be taken account [27, 29]. The shape of a band in the emission spectrum appears to differ from the shape of the same band in the absorption spectrum. To explore this aspect, it is necessary to carry out a separate study for deriving the basis spectra belonging to each secondary structure type. However, it is obvious that the proposed approach is applicable for studying the structure of proteins. It is not excluded that this can find wide application in biology and medicine.
Let us consider separately the issue of sensitivity of the described spectral approach. It can be examined by comparing the area under the curve in the emission spectrum of the black body at 25°С (Figure 4) and the areas of the weakest but reliably detected peaks in the difference spectra (Figure 8). It turns out that it is possible to detect peaks 106 times less intense than those in the emission spectrum of the black body. Since the black body radiation power at 25°С is ≈0.045 W/cm2 and the area of the spot of the sample emitting the radiation of interest is ≈0.3 cm2, the proposed approach permits detecting the sample radiation with the power of ∼10−8 W. It should also be pointed out that the detector only captures a part of the total radiation intensity which falls within the angular aperture of its optical system (∼1%). This means that the lowest radiation intensity that can directly be detected by the system described is ∼10−10 W. Therefore, consideration could be given to ways to increase the sensitivity using additional focusing of the sample radiation.
On the other hand, as is seen from Figure 5, the maximum frequency in the non-zero intensity of water spectrum corresponds to the wavenumber of 3,600 cm−1. The population of the respective energy states as calculated using Eq 1 is 2.8×10⁻⁸. Therefore, emission spectroscopy when used in the configuration described is capable of detecting signals from a ∼10−8 part of aqueous solution molecules, i.e., enables studying solutions at very low concentrations.
This impressive result indicates that IR emission spectrometry can have far more potential compared with IR absorption spectrometry in terms of achieving high sensitivity and low noise level. The advantage in the signal/noise parameter of emission spectroscopy over absorption spectroscopy was mentioned in the study analyzing the emission spectra of heated samples [24]. This advantage can be attributed to the fact that during detection of emission spectra the detector only receives the radiation to be measured. In the case of asorption spectroscopy, radiation from a powerful IR source is recorded and it is necessary to isolate the radiation attenuation bands by the sample. Moreover, any radiation source exhibits a shift and fluctuations in its spectrum. Measuring against a cold background provides more stable spectra than when measuring hot objects. Instead of heating the sample to high temperatures, it only involves maintaining a stable temperature of the sample at around room temperature, which is relatively easy to ensure. The cold background temperature (nitrogen boiling point) is also very stable.
Absorption spectroscopy completely disregards the intrinsic radiation of the sample due to its low level compared with the radiation of the spectrometer’s IR source. However, it is quite likely that emission spectroscopy of proteins and other molecules will provide not just detailed but novel spectral information which is impossible to derive from absorption spectra. The use of emission spectroscopy for studying proteins in various systems could also be relevant when there is a concern about damaging effects of radiation from standard IR sources on the sample.
The method described in this paper, despite the obvious advantages over absorption spectroscopy, does have some limitations. Figure 5 shows that the utilized approach allows detecting radiation in the spectral range of 400–3,600 cm−1. At greater wavenumbers, the method is apparently not applicable due to the negligible population of the respective vibrational states. The only possible way to extend the range into the high-frequency region seems to be increasing the sample temperature. However, the above-mentioned spectral range covers almost the entire frequency range of vibrational spectroscopy, so we cannot talk about serious limitations in the width of the spectral interval. Moreover, according to Figures 7, 8, the method, as applied to studying protein solutions, exhibits its highest sensitivity in the range of 500–1700 cm−1. This range is commonly known as a fingerprint region, as it is where IR spectra are able to provide the most information for molecular structure analysis.
This study also included an attempt to measure emission spectra in the far-infrared region down to 10 cm−1. Emission spectra in this range were detected using a liquid helium cooled silicon bolometer having a sensitivity several orders of magnitude higher than that of the MTC detector we used in the mid-infrared region. However, another essential condition had to be met: the windows and the beamsplitter should be transparent to radiation in the frequency range considered. For example, over the entire mid-infrared range, the transmittance of the materials–KBr or KRS-5 is more than 95% (without taking into account the reflection of radiation at interfaces), so the materials themselves emit almost no radiation. In other words, since having no absorption, these materials have no excited states typical of these frequencies and hence they are unable to radiate at these frequencies. In the far-infrared region, measurements are performed using standard beamsplitters made from polyethylene terephthalate (Mylar Multilayer T222 and Mylar 50 μm) and polyethylene windows (including the bolometer window). It turned out that although such materials transmit most of the radiation over their specific spectral region, their total transmission does not exceed 10% in some frequency intervals. This means they acquire grey-body properties and become sources of stray radiation themselves while also attenuating the sample radiation. Due to the large number of artifacts in the far-infrared emission spectra and interpretation difficulties, these data are not presented here.
However, the above-stated problem can be addressed in the following way. To examine far-infrared emission spectra, either numerical procedures to remove stray radiation to be developed or the windows and beamsplitters from materials having a transmission close to 100% should be used. Diamond, for instance, meets this criterion. There is also an option of selecting cheaper polymer materials [30] having a transmission of nearly 100% in various parts of the far-infrared region. Solving this purely technical problem will allow emission spectroscopy to access the far-infrared and terahertz regions, the characteristic frequencies and energies of which contain information about intermolecular structure and dynamics [31, 32]. This can provide further information about the characteristics of proteins in solutions and their interactions with the environment.
Conclusion
This paper describes an experimental method that allows detecting the infrared emission spectra of solutions of proteins in native state without any external excitation. Radiation can be detected using a vacuum Fourier-transform infrared spectrometer. At the same time, the detection of radiation from the sample necessitates the use of a high-sensitivity cooled detector and the provision of a cold background, such as a black body at the boiling point of nitrogen. It is also important to select the optimal vacuum pumping depth for the spectrometer and sample thickness. Radiation arises from spontaneous radiative transitions from excited vibrational energy states (having non-zero populations) to the ground state of the sample molecules. Given the high sensitivity (10−8–10−10 W) and high signal/noise ratio, IR emission spectroscopy could offer substantial advantages over the conventional IR absorption spectrometry, as applied to the analysis of structural characteristics of proteins and other biological macromolecules. For instance, emission spectroscopy can be used for the study of substances at very low concentrations. It can have evident advantages when exposure of the sample to powerful IR radiation can produce a damaging effect. Although the accessible wavenumber range (400–3,600 cm−1) is narrower than that in absorption spectroscopy, it covers almost the entire vibrational spectral region. Furthermore, the technique described has a potential to extend its accessible spectral range into the far-infrared and terahertz regions.
Data Availability Statement
The original contributions presented in the study are included in the article/Supplementary Material, further inquiries can be directed to the corresponding author.
Author Contributions
Conceptualization, NP; methodology, NP; software, NP and NaP; validation, NP; formal analysis, NP and NaP; investigation, NP; resources, NP; data curation, NP; writing—original draft preparation, NP and NaP; writing—review and editing, NP; visualization, NP; supervision, NP; project administration, NP.
Conflict of Interest
The authors declare that the research was conducted in the absence of any commercial or financial relationships that could be construed as a potential conflict of interest.
Acknowledgments
This work was performed on instruments of the Optical Microscopy and Spectrophotometry core facility, ICB RAS, Federal Research Center “Pushchino Scientific Center for Biological Research of the Russian Academy of Sciences” (http://www.ckp-rf.ru/ckp/670266/).
References
1. Elliott A, Ambrose EJ. Structure of synthetic polypeptides. Nature (1950). 165:921–2. doi:10.1038/165921a0
2. Elliott A, Ambrose EJ, Robinson C. Chain configurations in natured and denatured insulin: evidence from infrared spectra. Nature (1950). 166:194. doi:10.1038/166194a0
3. Barth A. Infrared spectroscopy of proteins. BBA (2007). 1767:1073–101. doi:10.1016/j.bbabio.2007.06.004
4. Haris PI. Infrared spectroscopy of protein structure. In: GCK, Roberts, editor Encyclopedia of biophysics. Berlin; Heidelberg: Springer-Verlag (2013). p. 1095–106.
5. Rothschild KJ. The early development and application of FTIR difference spectroscopy to membrane proteins: a personal perspective. Biomed Spectrosc Imag (2016). 5:231–67. doi:10.3233/BSI-160148
6. Matei A, Dressel M. Experimental determination of the far-infrared optical properties of biological matter in aqueous solution. J Biol Phys (2003). 29:101–8. doi:10.1023/A:1024472121239
7. Stehle CU, Abuillan W, Gompf B, Dressel M. Far-infrared spectroscopy on free-standing protein films under defined temperature and hydration control. J Chem Phys (2012). 136:075102. doi:10.1063/1.3686886
8. Mahmood T, Yang PC. Western blot: technique, theory, and trouble shooting. N Am J Med Sci (2012). 4:429–34. doi:10.4103/1947-2714.100998
9. Grayson P, Rex J. The process of western blotting. Eureka. (2018). 1:e03. doi:10.31109/EurekaMet.e03
10. Zimmer M. Green fluorescent protein (GFP): applications, structure, and related photophysical behavior. Chem Rev (2002). 102:759–81. doi:10.1021/cr010142r
11. Remington SJ. Green fluorescent protein: a perspective. Protein Sci (2011). 20:1509–19. doi:10.1002/pro.684
12. Feng S, Varshney A, Villa DC, Modavi C, Kohler J, Farah F, et al. Bright split red fluorescent proteins for the visualization of endogenous proteins and synapses. Commun Biol (2019). 2:344. doi:10.1038/s42003-019-0589-x
13. Terpugov EL, Degtyareva OV. Infrared emission from photoexcited bacteriorhodopsin: studies by Fourier transform infrared spectroscopy. J Mol Struct (2001). 565–566:287–92. doi:10.1016/S0022-2860(00)00901-7
14. Terpugov EL, Degtyareva OV. Photo-induced processes and the reaction dynamics of bacteriorhodopsin. Biophysics. (2015). 60:232–43. doi:10.1134/S0006350915020189
15. Terpugov EL, Degtyareva OV, Fesenko EE. Microwave-induced structural changes in bacteriorhodopsin: studies by optical and fourier transform infrared difference spectroscopy. Biophysics (2018). 63:706–12. doi:10.1134/S0006350918050226
16. Herbst E. Chemistry in the interstellar medium. Annu Rev Phys Chem (1995). 46:27–54. doi:10.1146/annurev.pc.46.100195.000331
17. Kewley LJ, Nicholls DC, Sutherland RS. Understanding galaxy evolution through emission lines. Annu Rev Astron Astrophys (2019). 57:511–70. doi:10.1146/annurev-astro-081817-051832
18. Bacsik Z, Mink J, Keresztury G. FTIR spectroscopy of the atmosphere. I. Principles and methods. Appl Spectrosc Rev (2004). 39:295–363. doi:10.1081/ASR-200030192
19. Bacsik Z, Mink J, Keresztury G. FTIR spectroscopy of the atmosphere Part 2. Applications. Appl Spectrosc Rev (2005). 40:327–90. doi:10.1080/05704920500230906
20. Krainov VP, Smirnov BM. Description of emission processes in molecular gases based with the HITRAN database. J Exp Theor Phys (2019). 129:9–18. doi:10.1134/S106377611906013X
21. Bernath PF, Sinquefield SA, Baxter LL, Sclippa G, Rohlfing CM, Barfield M. In situ analysis of ash deposits from black liquor combustion. Vib Spectrosc (1998). 16:95–103. doi:10.1016/S0924-2031(98)00002-2
22. Deblase FJ, Compton S. Infrared emission spectroscopy: a theoretical and experimental review. Appl Spectrosc (1991). 45:611–8. doi:10.1366/0003702914337029
23. Hvistendahl J, Rytter E, Oye HA. IR emission spectroscopy of molten salts and other liquids using thick samples as reference. Appl Spectrosc (1983). 37:182–7. doi:10.1366/0003702834633920
24. Bernath PF. Infrared emission spectroscopy. Annu Rep Prog Chem Sect C (2000). 96:177–224. doi:10.1039/b001200i
25. Hinkle KH, Cuberly R, Gaughan N, Heynssens J, Joyce RR, Ridgway S, et al. Phoenix: a cryogenic high-resolution 1–5 micron infrared spectrograph. Proc SPIE (1998). 3354:810–21. doi:10.1117/12.317217
26. Oberg KA, Ruysschaert JM, Goormaghtigh E. The optimization of protein secondary structure determination with infrared and circular dichroism spectra. Eur J Biochem (2004). 271:2937–48. doi:10.1111/j.1432-1033.2004.04220.x
27. Venyaminov SY, Kalnin NN. Quantitative IR Spectrophotometry of peptide compounds in water (H2O) solutions. II. Amide absorption bands of polypeptides and fibrous proteins in α-, β-, and random coil conformations. Biopolymers (1990). 30:1259–71. doi:10.1002/bip.360301310
28. Available at: https://www.uniprot.org/uniprot/P01579#structure
29. Kalnin NN, Baikalov A, Venyaminov SY. Quantitative IR Spectrophotometry of peptide compounds in water (H2O) solutions. III. Estimation of the protein secondary structure. Biopolymers. (1990). 30:1273–80. doi:10.1002/bip.360301311
30. Rogalin VE, Kaplunov IA, Kropotov GI. Optical materials for the THz range. Optic Spectrosc (2018). 125:1053–64. doi:10.1134/S0030400X18120172
31. Penkov NV, Shvirst NE, Yashin VA, Fesenko EE. On singularities of molecular relaxation in water solutions. Biophysics. (2013). 58:731–8. doi:10.1134/S000635091306016X
Keywords: infrared, infrared spectroscopy, emission spectroscopy, protein structure, water solution, emission of protein, emission of solution, IFNg
Citation: Penkov N and Penkova N (2020) Measurement of the Emission Spectra of Protein Solutions in the Infrared Range. Description of the Method and Testing Using Solution of Human Interferon Gamma as an Example. Front. Phys. 8:615917. doi: 10.3389/fphy.2020.615917
Received: 10 October 2020; Accepted: 10 November 2020;
Published: 07 December 2020.
Edited by:
Nikolai F. Bunkin, Bauman Moscow State Technical University, RussiaReviewed by:
Martin Dressel, University of Stuttgart, GermanyEvgeny Konchekov, Prokhorov General Physics Institute (RAS), Russia
Copyright © 2020 Penkov and Penkova. This is an open-access article distributed under the terms of the Creative Commons Attribution License (CC BY). The use, distribution or reproduction in other forums is permitted, provided the original author(s) and the copyright owner(s) are credited and that the original publication in this journal is cited, in accordance with accepted academic practice. No use, distribution or reproduction is permitted which does not comply with these terms.
*Correspondence: Nikita Penkov, bnZwZW5rb3ZAcmFtYmxlci5ydQ==
 Nikita Penkov
 Nadezda Penkova2