- 1Departamento de Física Experimental, Instituto de Física, Universidad Nacional Autónoma de México, Mexico City, Mexico
- 2Biomedical Engineering, Duke University, Durham, NC, United States
- 3Intermountain Healthcare, Provo, UT, United States
- 4Department of Medical Physics, University of Wisconsin, Madison, WI, United States
Shear wave dispersion (variation of phase velocity with frequency) occurs in tissues with layered and anisotropic microstructure and viscous components, such as the uterine cervix. This phenomenon, mostly overlooked in previous applications of cervical Shear Wave Elasticity Imaging (SWEI) for preterm birth risk assessment, is expected to change drastically during pregnancy due to cervical remodeling. Here we demonstrate the potential of SWEI-based descriptors of dispersion as potential biomarkers for cervical remodeling during pregnancy. First, we performed a simulation-based pre-selection of two SWEI-based dispersion descriptors: the ratio R of group velocities computed with particle-velocity and particle-displacement, and the slope S of the phase velocity vs. frequency. The pre-selection consisted of comparing the contrast-to-noise ratio (CNR) of dispersion descriptors in materials with different degrees of dispersion with respect to a low-dispersive medium. Shear waves induced in these media by SWEI were simulated with a finite-element model of Zener viscoelastic solids. The pre-selection also considered two denoising strategies to improve CNR: a low-pass filter with automatic frequency cutoff determination, and singular value decomposition of shear wave displacements. After pre-selection, the descriptor-denoising combination that produced the largest CNR was applied to SWEI cervix data from 18 pregnant Rhesus macaques acquired at weeks 10 (mid-pregnancy stage) and 23 (late pregnancy stage) of the 24.5-weeks full pregnancy. A maximum likelihood linear mixed-effects model (LME) was used to evaluate the dependence of the dispersion descriptor on pregnancy stage, maternal age, parity and other experimental factors. The pre-selection study showed that descriptor S combined with singular value decomposition produced a CNR 11.6 times larger than the other descriptor and denoising strategy combinations. In the Non-Human Primates (NHP) study, the LME model showed that descriptor S significantly decreased from mid to late pregnancy (−0.37
1 Introduction
Preterm birth is the main cause of death in newborn children and its incidence rate is increasing [1, 2]. A factor contributing to this problem is the lack of objective methods to describe the structural and functional changes that gestational tissues go through during pregnancy and labor [3].
One of the gestational tissues that suffers the most dramatic transformation is the cervix. The cervix is a cylindrical-shaped structure at the lower uterus that, during pregnancy, serves as a protective barrier between the developing fetus and the exterior. As pregnancy advances, the cervix softens and, close to delivery, shortens, ripens, and dilates to allow for vaginal parturition. In both term and preterm births, this transformation is achieved through a dramatic biochemical and structural transformation of the cellular and extracellular components of the cervical stroma [4].
The extracellular matrix of the cervix is composed of layers of semi-aligned collagen fibers immersed in a viscous matrix of long-chain molecules such as proteo- and glycosaminoglycans [5]. As pregnancy progresses, mature crosslinks holding together collagen fibrils are replaced by immature crosslinks. As a result, collagen organization is gradually lost and the cervix softens [4]. During the ripening stage, the concentration of sulfated glycosaminoglycans increases, particularly that of hyaluronic acid (HA) [6]. Due to the hydrophilic nature of HA, cervical hydration augments, further separating collagen fibrils [7–14]. All these changes alter drastically the mechanical properties of the cervix, such as its stiffness and viscosity [15].
During the last decade, various groups have investigated the use of Shear Wave Elasticity Imaging (SWEI) to objectively quantify changes in cervical stiffness during pregnancy and to assess the risk of preterm birth [16–21]. SWEI is an ultrasound-based method that generates shear waves in the tissue of interest using an acoustic radiation force impulse (ARFI) produced with a clinical transducer. The ARFI-induced shear wave motion is tracked with pulse-echo imaging techniques, allowing analysis of the propagation of the shear wave. If the medium is assumed to be linear, purely elastic, isotropic, and homogeneous, a simple relationship between the shear wave group speed
The layered collagenous microstructure of the cervix and the presence of the highly viscous ground substance cause shear wave dispersion, i.e., the phase speed (the speed at which different frequency components of the shear wave move) varies with frequency. Shear wave dispersion has been demonstrated in other structurally complex tissues such as tendon and muscle [26, 27]. Using a multi-scale simulation strategy with different viscoelastic models Peralta et al. [28] demonstrated significant shear wave dispersion in the cervix. More recently, our group observed that the slope of the phase velocity vs. frequency in ex vivo cervix samples from a non-human primate (NHP) model was 5.5 m/s-kHz (interquartile range: 1.5–12.0 m/s-kHz) [20]. In the same study, we also demonstrated that shear wave dispersion could be indirectly assessed by comparing the group speeds determined with particle velocity and particle displacement. The time derivative relationship between the particle velocity and the particle displacement makes the former more sensitive to higher frequencies, thus resulting in higher group speed values than those obtained with the particle displacement [29]. Interestingly, no differences in dispersion were observed between normal cervix samples and those in which ripening was induced with the prostaglandin Misoprostol. This was attributed to the large variance of shear wave displacements, probably related to the larger stiffness of the rhesus macaque cervix compared to the human one [20, 30]. The quantification of descriptors of shear wave dispersion could provide quantitative imaging biomarkers that could be more sensitive than the group speed to changes in mechanical properties of the cervix.
Thus, in this study, we present evidence from a NHP model of the pregnant cervix that shear wave dispersion quantified with SWEI can be used as a quantitative imaging biomarker for cervical remodeling. We chose to work with the NHP model, in particular the Rhesus macaque, because of its similar maternal-fetal physiology to humans. Furthermore, because Rhesus macaques are non-obligated quadripeds, the mechanical loading on the cervix is more similar to the human case [31–35]. Previous studies from our group have shown similar rates of shear wave reduction during pregnancy in humans and Rhesus macaques, thus showing the suitability of this model [21, 24]. To overcome the limitations of high displacement variance in the Rhesus macaque cervix, we performed a pre-selection of two possible descriptors of dispersion, the ratio of group speeds from particle velocity/particle displacement and the slope of the phase velocity vs. frequency, combined with two noise reduction strategies. After the pre-selection stage, the descriptor with larger changes due to dispersion was applied to SWEI data from the mid-pregnancy and late-pregnancy NHP cervix.
2 Materials and Methods
2.1 SWEI-Based Descriptors of Dispersion
We investigated two possible SWEI-based descriptors of dispersion, one defined in the time domain, and another in the Fourier domain. The time-domain descriptor is the ratio R of group speeds computed with particle velocity
where
The Fourier-domain descriptor directly quantifies dispersion as the slope S of the phase velocity vs. frequency over the shear wave bandwidth [20]. To quantify S, we computed the particle velocity power spectrum
2.2 Pre-selection Stage
The pre-selection stage consisted of selecting the descriptor with the largest changes in dispersion in viscoelastic media over the estimation variance. To have control over the degree of dispersion, we used computational phantoms based on finite-element models of Zener viscoelastic solids implemented on LS-Dyna (Version 3.2 β, Livermore, Software Technology Corp., Livermore, CA) following the method described by [41]. Dispersion was controlled by varying the viscous component of the Zener model (one spring in parallel with a series of a spring and a dashpot). Shear waves were created through fields of axial stresses with spatial Gaussian symmetry that simulated acoustic radiation force impulse stimuli produced by clinical ultrasound transducers [29]. The width of the Gaussian profile was 0.1 mm, based on a previously reported computational optimization [42]. The stress fields were applied during 0.1 ms. The center of the stress field was at a depth of 30 mm, corresponding the axial center of the simulated computational phantom [41].
The stress relaxation response of the Zener model has three parameters, the instantaneous shear modulus
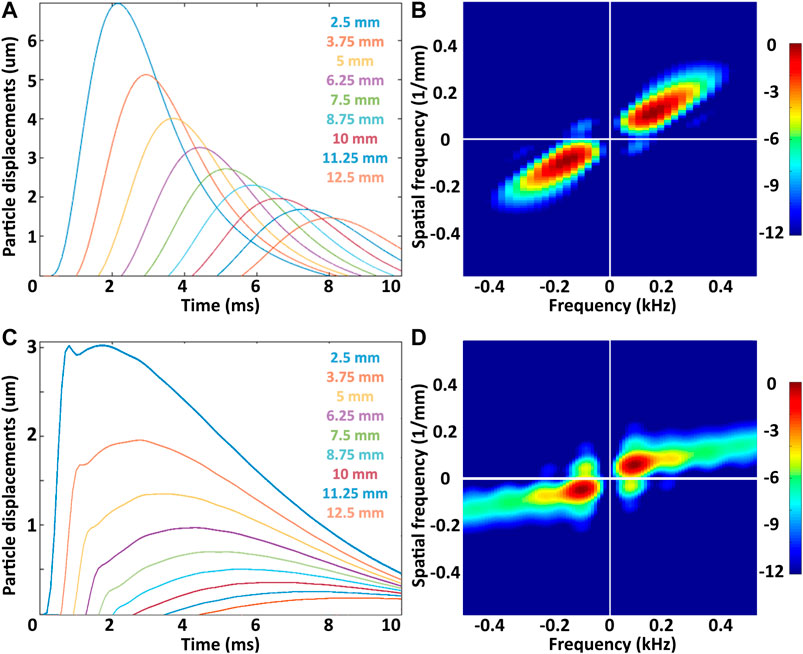
FIGURE 1. (A) and (C) Particle displacements as a function of time induced in the simulated viscoelastic media with 0.6 and 6 Pa s viscosity, respectively. Labels indicate the distance from the center of the ARF stimulus. (B) y (D) Fourier spectra for the same media. The spectrum peak occurs within a frequency range from 100 to 200 Hz.
The compromise between changes of each parameter and the estimation variance was quantified in terms of the contrast-to-noise ratio of each descriptor with respect to its value for the least dispersive medium. The CNR was mathematically defined as:
where
2.3 Noise Reduction Strategies
Preliminary estimates of shear wave dispersion in the ex vivo NHP cervix [20] showed large variance possibly related to the high stiffness of cervical tissue compared to other soft tissues such as liver. To overcome this limitation and increase the sensitivity of dispersion descriptors, we implemented two noise reduction strategies.
2.3.1 Automated Low-Pass Filter
Because random noise dominates at high temporal frequencies [44], low-pass filters have been commonly used in previous applications of shear wave elasticity imaging on cervical tissue [24]. We implemented this strategy and designed an automated criterion to select the cutoff frequency. This allowed us to automatically adapt the filter to the noise level in each simulated condition. To this end, we first obtained the maximum projection of the 2D spectrum of the particle velocity to obtain the velocity power spectrum vs. temporal frequency. Then, the cut-off frequency was defined by the intersection of two lines fitted to the velocity power spectrum vs. temporal frequency within a bandwidth that contains the shear wave signal (100–500 Hz) and a high-frequency bandwidth that contains noise (1–5 kHz). This is graphically represented in Figure 2.
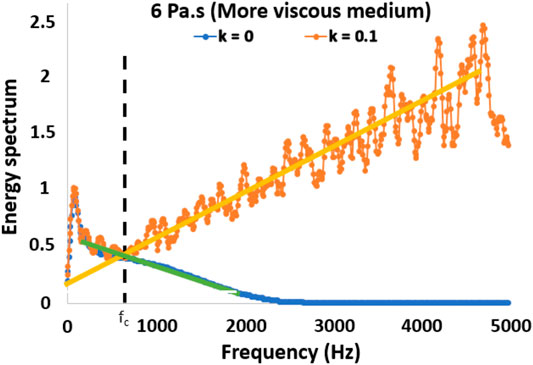
FIGURE 2. Projected particle velocity spectrum of a viscoelastic solid with 6.0 Pa s viscosity and a
2.3.2 Singular Value Decomposition Filter
The second strategy consisted of a filter based on the singular value decomposition (SVD) of shear wave displacements. This technique has been used to reduce clutter in other ultrasound techniques such as Doppler imaging and functional ultrasound [45]. The SVD filtering strategy is based on the fact that noise components of the displacement field have low spatial and frequency correlation compared to the components caused by shear wave propagation. Thus, unlike the low-pass filter strategy defined above, the SVD filter considers both temporal and spatial information. Also, in contrast to previous uses of the SVD, we aim at maintaining highly correlated components of the displacement field. To apply this filter, the 2D displacements are sorted into a Casorati Matrix
where RMSE was computed as:
where
The CNR of R and S for media with different dispersion (from different degrees of viscosity) and different noise levels where compared with and without each of the noise reduction strategies to identify the combination that maximized the CNR.
2.4 In vivo Application to Pregnant Rhesus Macaques
After identifying the combination of the dispersion descriptor and noise reduction strategy that maximized CNR, the combination was used to evaluate changes in the dispersion properties of the NHP cervix during pregnancy. To this end we used data from a longitudinal SWEI study on 18 pregnant Rhesus macaques acquired at weeks 10 and 23 of gestation, corresponding to mid and late pregnancy [21]. The study was performed at the Wisconsin National Primate Research Center and the protocol was approved by the Institutional Animal Care and Use Committee of the University of Wisconsin-Madison. Characteristics of the subjects are described in Table 1.
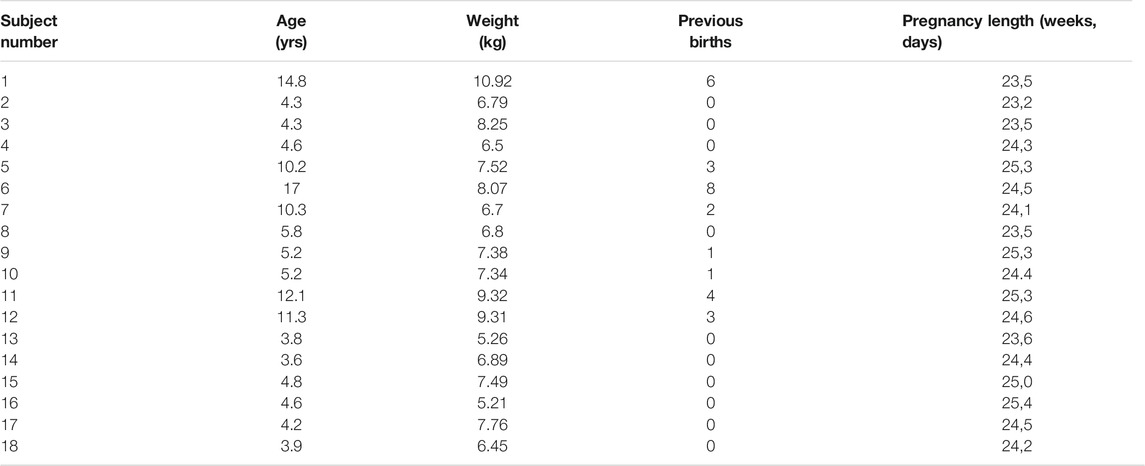
TABLE 1. Characteristics of the macaques. For each macaque, tissue measurements were taken in the anterior and posterior region with respect to the cervical canal during gestation weeks 10 and 23.
SWEI data was acquired from the NHP cervix using a transrectal scanning approach on a longitudinal view of the cervix. Data was acquired with a prototype catheter transducer on a Siemens Acuson S2000 ultrasound scanner (Siemens Healthcare, Ultrasound Business Unit, Mountain View, CA, USA). Technical details about SWEI implementation can be found in [21]. Shear waves were induced in two propagation directions (from the uterine end to the vaginal end of the cervix, and vice versa) and were tracked over a
Shear-wave induced displacements were estimated from raw IQ data obtained from the system’s Axius Direct Ultrasound Research Interface [47] with Loupas’ correlation method [48]. Displacement estimates were rejected based on values of the correlation coefficient (
1. Evidence of a planar wavefront: Maps of the laterally-integrated particle displacement vs axial position and time must show no variation over the axial position (planar wavefront), and should gradually decrease over time mainly due to attenuation (Figure 3A). Data not showing these characteristics were rejected (Figure 3D).
2. Statistically significant particle displacements. Following a criterion proposed by [20], particle displacements were compared to those estimated from reference tracking frames acquired before the application of the ARF stimulus (Figure 3B). Data was rejected if time-averaged displacements (pink curve in Figures 3B,E) were not larger than a threshold (red dashed line) defined as three times the standard deviation of the reference particle displacements (black dashed line) over more than half of the axial span of the ROI. For the rest of the data, we only processed displacements that were continuously above the threshold (right side of vertical green line in Figure 3E).
3. Data with high noise after filtering: Finally, we rejected all the filtered data with noise levels at high temporal frequencies above -6 dB of the maximum signal (Figures 3C,F).
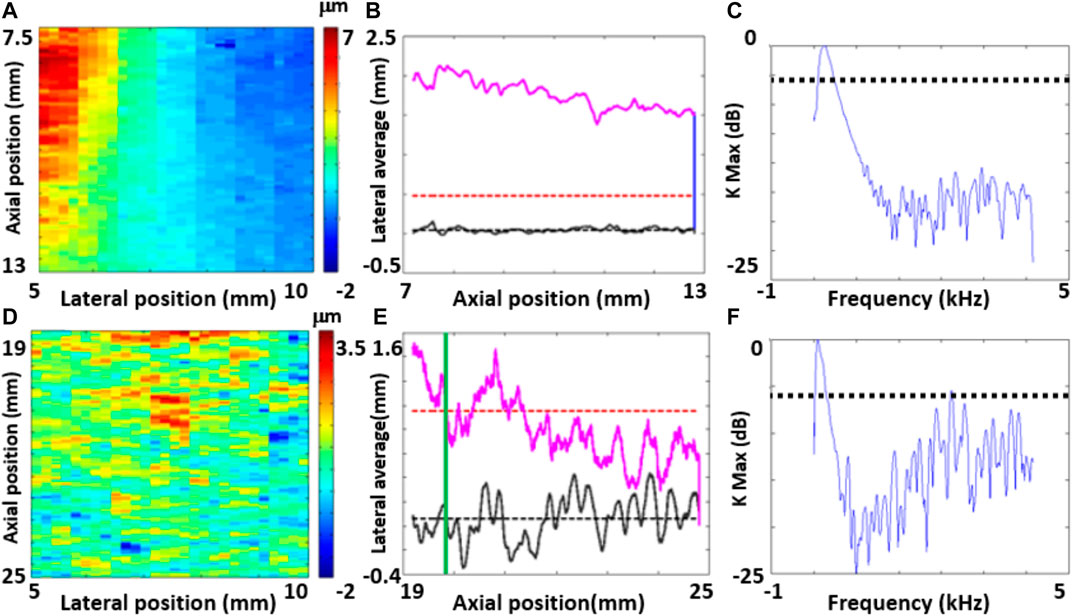
FIGURE 3. Examples of data that was included (A and B,C) and rejected (D and E,F) based on the quality criteria defined for the longitudinal study in Rhesus macaques.
2.4.1 Statistical Analysis
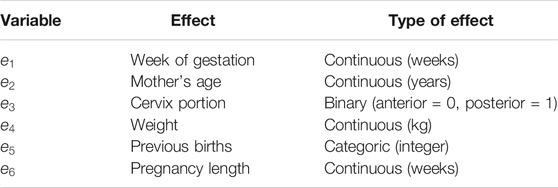
We used a linear mixed effects model to evaluate the significance of the relationship between the optimized dispersion parameter, gestational age, and other experimental variables [49]. According to this model, the optimized parameter P can be written as a linear combination of each variable
where
3 Results
3.1 Simulations
The CNR of both dispersion descriptors R and S increased with viscosity. In addition, we computed the values of the dispersion descriptors R and S (see description below) for a purely elastic medium (no viscosity), obtaining R = 0.998 and S = 0.01 (close to the values expected under no dispersion, i.e., R = 1 and S = 0). This demonstrates the absence of surface effects in shear wave propagation. Also, when no noise-reduction strategies were applied, R was found to be more robust to high levels of noise than parameter S. Figures 4A,B show the CNR of R and S, respectively, as a function of viscosity. Each curve corresponds to a different noise level. For low noise levels (
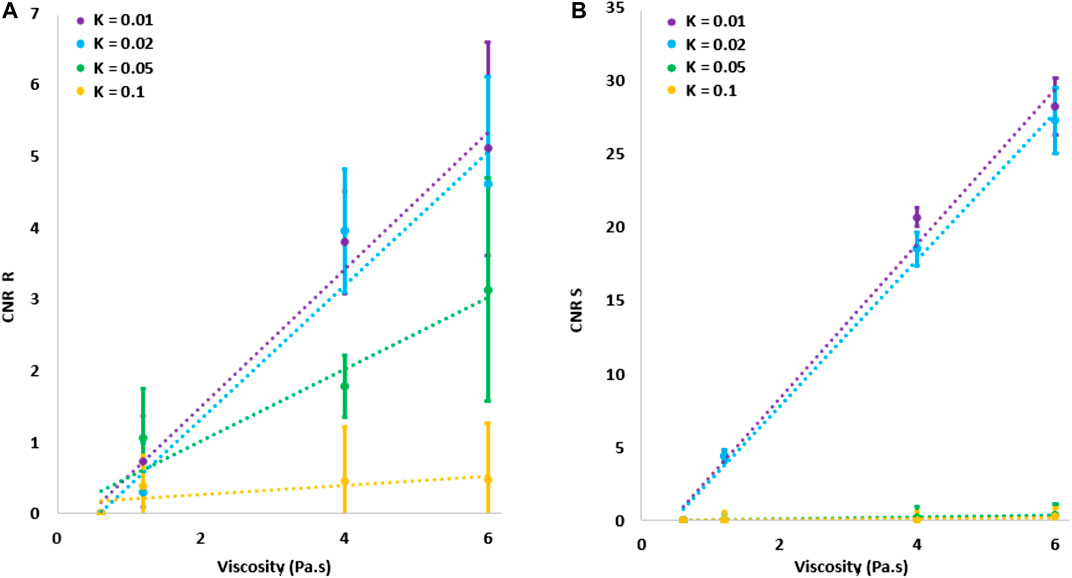
FIGURE 4. Contrast-to-noise ratio for either R and S parameters in function of the viscosity for different levels of noise. Error bars represent standard deviations over twenty repetitions.
For the low-pass noise filtering method, the automatically-selected cut-off frequency increased as a function of viscosity and decreased as a function of the noise level. This is shown in Figure 5, where the cutoff frequency is plotted as a function of the noise factor k. Each curve corresponds to a different degree of viscosity.
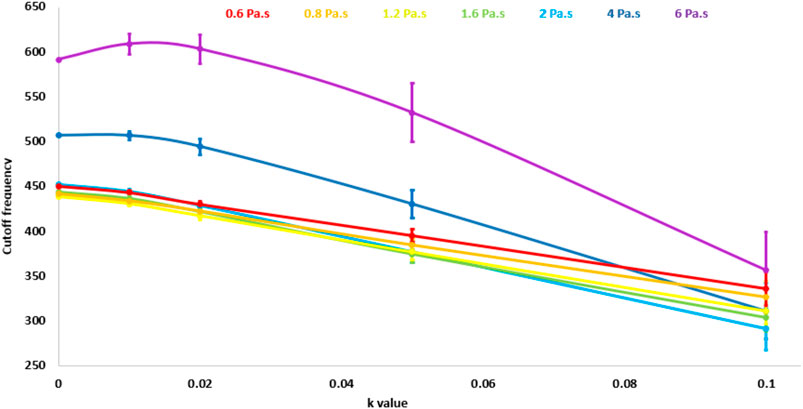
FIGURE 5. Cutoff frequency values obtained through the automatic method as a function of the noise parameter k. Each curve corresponds to a different viscosity degree.
For the SVD noise filtering method, the optimum singular value cutoff was chosen based on the maximum value of the CTER. Figure 6 shows the CTER as a function of the singular value cutoff index for the material with 0.8 Pa s viscosity and the material with 6 Pa s viscosity. The CTER had a maximum value around the index seven for both materials. Thus, we selected a value of seven for the cutoff index.
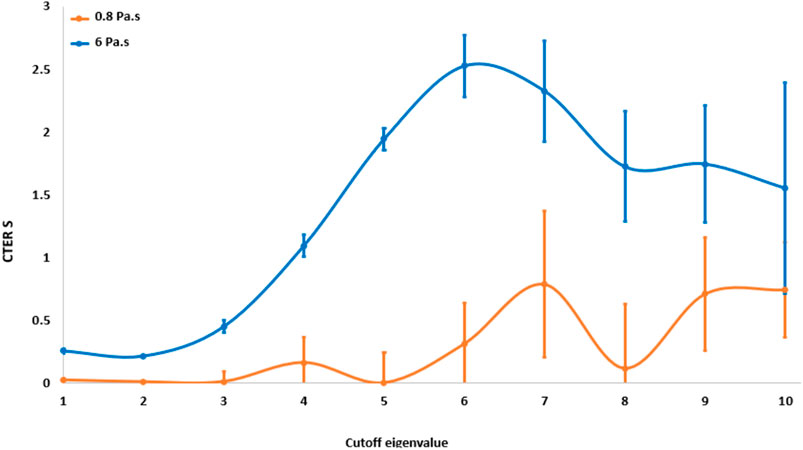
FIGURE 6. CTER values of the S parameter as a function of the cutoff eigenvalue for the most viscous medium (6 Pa s) and the less viscous (0.8 Pa s).
Figure 7 shows parameter S obtained after applying the low-pass filter (a) and the SVD filter (b), as a function of the noise parameter k and for various degrees of viscosity. With the low pass filter, changes in S as viscosity increases were not significant as indicated by the overlapping error bars. Furthermore, the highest value of S does not occur with the higher values of viscosity, suggesting ambiguity in the values of S that result from the use of this filtering strategy. This did not occur with the SVD filter, for which S increased monotonically with viscosity and changes with viscosity did not overlap. Because of this, the low pass filter was rejected.
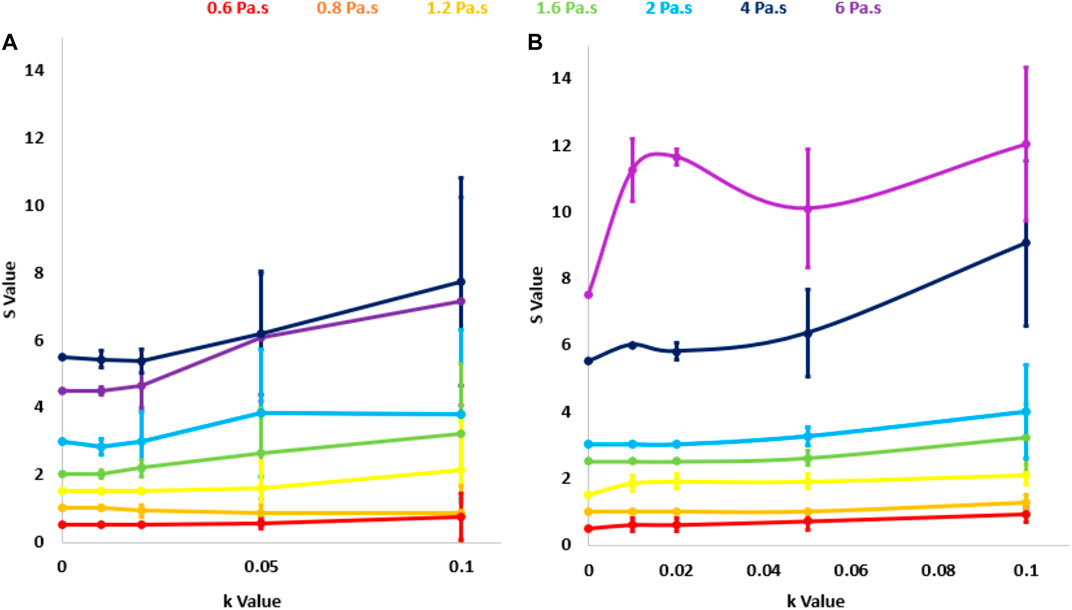
FIGURE 7. S parameter calculated with the automated low-pass filter (A) and the singular value decomposition filter (B) as a function of the noise level k. Each curve corresponds to a different degree of viscosity η.
After applying the SVD filter, the S parameter showed the highest CNR for each degree of noise and viscosity. Figure 8 shows the CNR of both R and S as a function of the noise factor without any filter and with the SVD filter. The combination of descriptor S and the SVD filtering for the highest level of noise resulted in 11.6 times higher CNR than R descriptor with the same filtering strategy. We applied the SVD filter to the estimation of descriptor S to data from the in vivo NHP study, zeroing singular values at and beyond index 7.
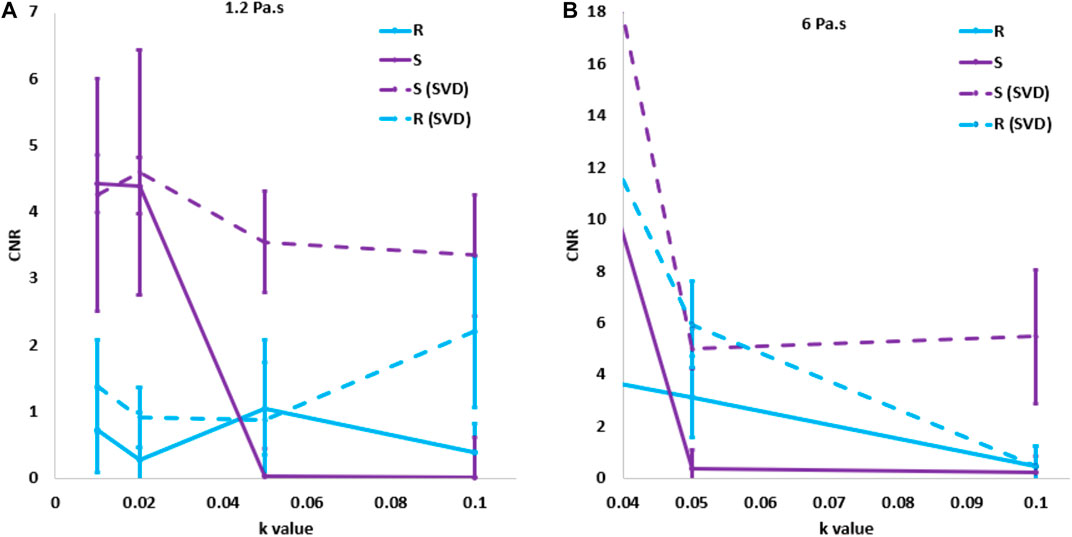
FIGURE 8. Comparison of the contrast-to-noise ratio as a function of the noise level for the highest and lowest degrees of viscosity before and after apply the singular value decomposition filter.
3.2 In vivo NHP Application
Table 3 summarizes the mean and standard deviations of the S parameter at weeks 10 and 23 for the anterior and posterior regions of the 18 macaques. Empty cells correspond to cases in which no measurements passed the quality criteria described above. No standard deviations (ND) are reported for those cases in which only one measurement passed the quality criteria. Mean cervical thickens for each animal is also reported in Table 3. Figure 9 shows an example of the particle displacements (a,d), particle velocities (b,e) and dispersion curves (c and f) for data from different subjects at week 10 (top row) and week 23 (bottom row). In this example, the maximum values of the particle velocity propagate at a faster rate at early pregnancy than at late pregnancy, which indicates overall stiffer tissue in the former case. Dispersion curves show higher phase velocities vs. frequency at mid pregnancy than at late pregnancy.
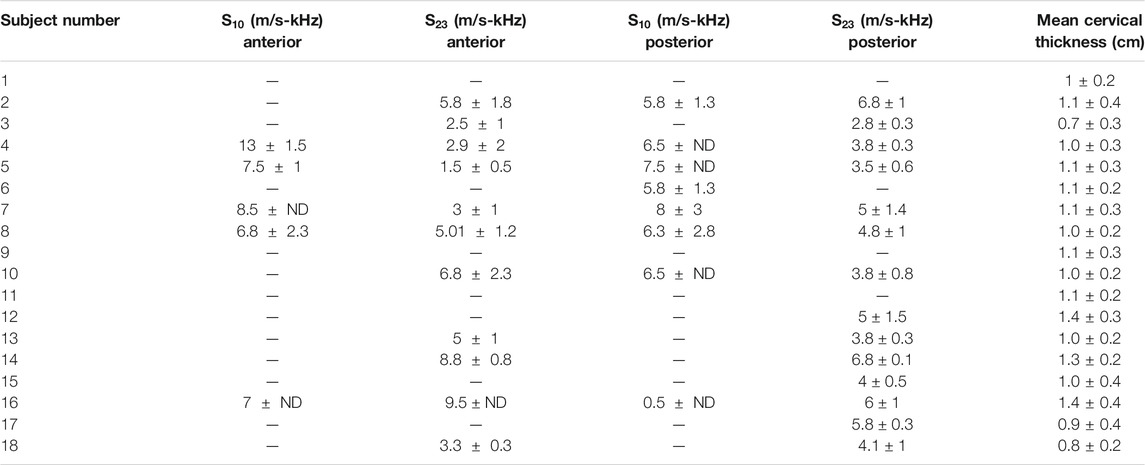
TABLE 3. S values of each macaque calculated in the anterior and posterior region with respect to the cervical canal during gestation weeks 10 and 23. Cervical mean thickens is also showed for each macaque.
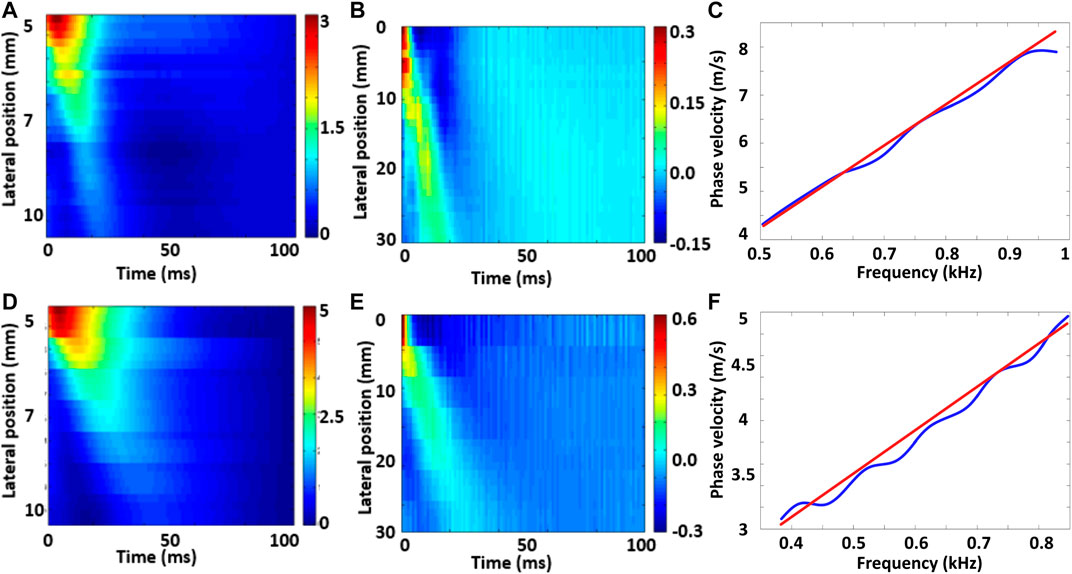
FIGURE 9. Particle displacements (A and D), particle velocities (B and E) and dispersion curves (C and F) for the filtered data in the early (A–C) and late (D–F) week of gestation in the longitudinal study. In the dispersion curves, the blue line is the value of the phase velocity measured at the maximum power at each temporal frequency, and the red line is the linear fit.
In general, S decreased between weeks 10 and 23 in the anterior cervix portion (Wilcoxon p = 0.03). Shear wave dispersion also decreased in the posterior portion, but the difference was not statistically significant (Wilcoxon p = 0.051). Figure 10 shows box plots that group estimates of S for all the subjects that passed the quality criteria at weeks 10 and 23 for (a) the anterior and (b) the posterior portions of the cervix.
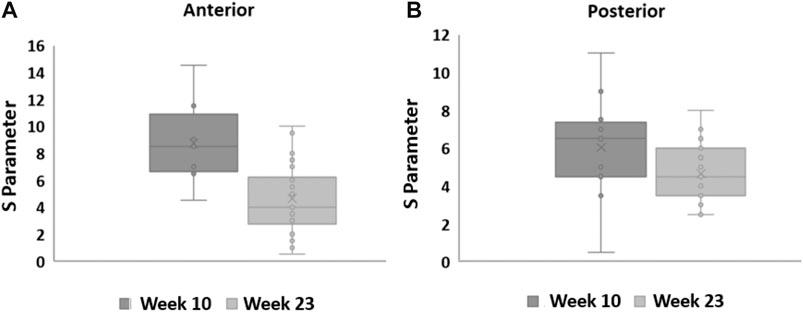
FIGURE 10. Box plots for the S parameter estimated from in vivo NHP SWEI data at weeks 10 and 23 of pregnancy. The central line and cross indicate the median and mean, the top and bottom limits of the box represent the interquarrtile range, the wiskers indicate the range defined as 1.95 times the interquartile range above and below the 25 and 75 percentiles, and the circles indicate values for each subject.
With exception of S values in the posterior side at week 23 (
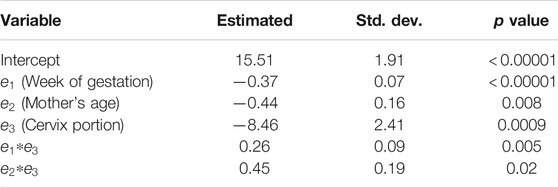
TABLE 4. Estimated coefficients, standard deviations, and p values for statistical significance of the linear mixed effects model for S in the in vivo NHP pregnant cervix.
4 Discussion
The goal of this study was to evaluate the changes in shear wave dispersion quantified through SWEI in an in vivo NHP model of the cervix between mid and late gestation. To this end, we performed a pre-selection of two SWEI-based descriptors of shear wave dispersion, R and S and noise reduction strategies using finite-element simulations of viscoelastic media. The most important findings of this study are:
• The S parameter with the SVD noise reduction strategy showed the highest dispersion-based CNR compared to other combinations of parameter and noise reduction strategies.
• The combination of the S parameter and the SVD filter led to observe a significant reduction of shear wave dispersion in NHP cervix between mid and late pregnancy.
• As result of the application of the LME model, we found other significant effects that influence the value of the S parameter and included the mother’s age and the cervix portion (anterior vs. posterior).
Based on a finite-element model, we observed that the frequency-domain parameter S in combination with the SVD filtering strategy produced the largest CNR among materials with different degrees of dispersion. The advantage of the SVD method over the automated low pass filter is based on its capacity to reduce both spatial and temporal contributions to noise. A disadvantage of this technique is the need to define an optimum cutoff value. A particularly complicated situation is how to treat frequency content due to bulk motion. In order to reduce the effects of such motion in the implementation of the optimized SVD strategy, we applied a second-order motion filter, as done by [40]. In the future, we will investigate the optimization of the selection of the singular value cutoff index to also reduce the contribution of bulk motion.
Other studies have applied SVD filtering in ultrasound studies like blood flow imaging [50]. However, the optimization of the cutoff value of SVD filtering for SWEI has not been widely studied. A particular case of SVD filtering in shear wave analysis can be found in geophysics applications. Chevrot and Girardin [51] used SVD filtering to reduce the noise in shear waves from seismic signals. In that study, a cutoff value was selected when a regular decrease of the singular spectrum was observed, which led to a cutoff index of 6. Here, we proposed a quantitative selection criterion considering the bias and variance in the estimation of the dispersion slope based on simulations with a large range of viscosity. The selected cutoff value of 7 was similar to that of [51].
In the animal study, we observed that the slope of the phase velocity vs. frequency decreased between mid and late pregnancy. Shear wave dispersion in the cervix can be attributed to the layered structure of collagen bundles, and to the presence of the viscous components of the extracellular matrix such as glycosaminoglycans. The collagen bundles are arranged in approximately three bands: an inner band with bundles aligned radially from the canal, a middle one with circumferential bundles, and an outer one with longitudinal bundles parallel to the canal [3]. Each band, with thickness of a few millimeters, can guide the propagation of the shear waves, as observed in tendon [26]. As pregnancy progresses, the layered collagen structure is lost and, therefore, shear wave dispersion caused by guided wave phenomena should decrease.
In addition to the bands of collagen, the thickness of the anterior and posterior portion of the cervix can lead to shear wave dispersion to the presence of Lamb waves. The average half-thickness (thickness of either the anterior or posterior portions) were 2.3
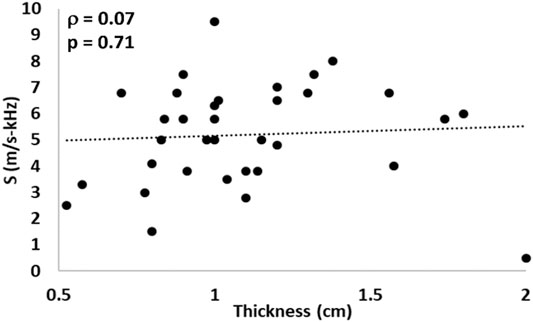
FIGURE 11. Shear wave dispersion parameter S vs. cervical thickness in the NHP model. Pearson’s correlation values was ρ = 0.07 (p = 0.71).
After applying the criteria for reliability of dispersion measurements, eight of the 18 subjects showed reliable estimates in week 10, and 15 in week 23. The larger rejection of data in week 10 can be attributed to the fact that the NHP cervix is stiffer than the human cervix and other organs in which SWEI has been successfully applied, like the liver. The larger stiffness leads to noisier shear wave displacement values. Furthermore, the rejection of a large number of data is common in the initial steps of the development of quantitative imaging. For example, Castañeda-Martinez et al. [53] rejected data from 11 out of 16 subjects while implementing Ultrasound Backscatter Spectroscopy in the neonatal brain. Also, Wang et al. [54] rejected 50% of measurements when using shear wave elasticity imaging in the liver. Because the human cervix is softer than the NHP, we are confident that we will achieve more reliable dispersion estimates in the clinical application of the technique developed in this work.
Various works have reported the use of the shear wave group speed
Using the linear mixed-effects model on the values of S, we found that age and cervix portion (anterior vs. posterior) had a significant influence on shear wave dispersion. Rosado-Mendez et al. [21] observed significant differences in the group speed between the anterior and posterior NHP cervix. Carlson et al. [60] reported similar differences in humans. These differences can be attributed to spatial variations in the microstructural properties of the cervix, a weight gradient created by the fetus, and/or the rotated orientation of the cervix with respect to propagation direction of the shear wave. Another factor could be a pre-compresion of the posterior cervix due to the presence of the transducer. Also, these differences could be attributed to variations in the shear wave frequency content due the attenuation and focusing of the pushing beam. The significance of the mother’s age could be attributed to the changes in the production and reception of glycosaminoglycans as the mother age increases [61]. Despite the influence of these factors, the most important effect on shear wave dispersion was the week of gestation, thus indicating the potential of this technique to track cervical remodeling during pregnancy.
This study had various limitations. The noise model that we used in the simulation part was Gaussian and modulated by the maximum shear wave displacement of each displacement field [38]. Although simplistic, this model allowed us to performed a comparative selection of the descriptor of dispersion that maximized the detection of different levels of dispersion. The second limitation is the large fraction of rejected data at week 10. This can be attributed to the stiffer state of the cervix at mid pregnancy compared to late pregnancy, which results in lower signal/noise of displacements estimates. This might be a limitation when performing future comparisons of the early vs. late pregnancy cervix. Since the human cervix is slightly softer than the NHP cervix, we expect that the rejection rate will not be as high in clinical applications of the proposed technique. Finally, the S parameter does not provide a quantitative assessment of the changes in the structural components that determine the dispersive response of the cervix. We are currently exploring the quantification of shear wave attenuation and the fit of rheological models to shear wave dispersion and attenuation to obtain a more detailed characterization of the cervix structural components. Although this strategy has been proposed by other groups, they used simplistic viscoelastic models such as Voigt’s [28]. Other models such as the Prony series may provide a more accurate assessment of the structural components.
5 Conclusion
In this study we used shear wave dispersion as a surrogate of cervical remodeling during pregnancy in a non-human primate model. We compared the sensitivity of two dispersion descriptors extracted from either a time-domain or a frequency-domain analysis of shear wave propagation in finite element simulations of viscoelastic media. We observed that the frequency-domain parameter S, defined as the phase velocity slope vs. frequency, in combination with noise-filtering based on singular value decomposition provided better differentiation of viscoelastic materials with different levels of dispersion than other combinations of parameters and filtering strategies. When applied to the NHP model, we observed a significant reduction of shear wave dispersion between mid and late pregnancy in the NHP model, likely due to the disorganization of cervical collagen during pregnancy. Our results suggest the potential of shear wave dispersion as a quantitative imaging biomarker of cervical remodeling. Future studies will apply this analysis to data from longitudinal human studies of normal and preterm pregnancy.
Data Availability Statement
The raw data supporting the conclusions of this article will be made available by the authors, without undue reservation.
Ethics Statement
The animal study was reviewed and approved by the Institutional Animal Care and Use Committee of the University of Wisconsin-Madison.
Author Contributions
AT contributed with data processing, analysis and discussion of results, and manuscript drafting. MP contributed with generation of simulations and discussion of results. HF contributed with data acquisition, analysis and discussion of results, and manuscript drafting. TH contributed to the discussion of results and manuscript drafting. IR-M contributed with data acquisition, supervising data processing, manuscript drafting, and discussion of results.
Funding
This work was supported by UNAM-PAPIIT IA104518, IN103219, and IA102320, and by the graduate studies scholarship from the Consejo Nacional de Ciencia y Tecnología to AT. (CVU 863045). This work was also supported by the National Institutes of Health grants T32CA009206 from the National Cancer Institute, and F31HD082911, R21HD061896, R21HD063031, and R01HD072077 from the Eunice Kennedy Shriver National Institute of Child Health and Human Development.
Conflict of Interest
This research was performed with support (equipment loan and technical assistance) from Siemens Healthcare.
Acknowledgments
The authors thank Lindsey Carlson, Quinton Guerrero, Andrew Santoso, Bin Huang, Sarah Kohn, and Michele Shotzko for helping with data acquisition.
References
1. Vogel JP, Chawanpaiboon S, Watananirun K, Lumbiganon P, Petzold M, Moller AB, et al. Global, regional and national levels and trends of preterm birth rates for 1990 to 2014: protocol for development of world health organization estimates. Reprod Health (2016) 13:76. doi:10.1186/s12978-016-0193-1
2. Feltovich H. Cervical evaluation: from ancient medicine to precision medicine. Obstet Gynecol (2017) 130:51. doi:10.1097/AOG.0000000000002106
3. Feltovich H, Hall TJ, Berghella V. Beyond cervical length: emerging technologies for assessing the pregnant cervix. Am J Obstet Gynecol (2012) 207:345–54. doi:10.1016/j.ajog.2012.05.015
4. Yellon SM. Immunobiology of cervix ripening. Front Immunol (2019) 10:3156. doi:10.3389/fimmu.2019.03156
5. Akgul Y, Holt R, Mummert M, Word A, Mahendroo M. Dynamic changes in cervical glycosaminoglycan composition during normal pregnancy and preterm birth. Endocrinology (2012) 153:3493–503. doi:10.1210/en.2011-1950
6. Myers K, Socrate S, Tzeranis D, House M. Changes in the biochemical constituents and morphologic appearance of the human cervical stroma during pregnancy. Eur J Obstet Gynecol Reprod Biol (2009) 144(Suppl 1):S82. doi:10.1016/j.ejogrb.2009.02.008–S89
7. Nallasamy S, Mahendroo M. Distinct roles of cervical epithelia and stroma in pregnancy and parturition. Semin Reprod Med (2017) 35:190–200. doi:10.1055/s-0037-1599091
8. Danforth DN, Veis A, Breen M, Weinstein HG, Buckingham JC, Manalo P. The effect of pregnancy and labor on the human cervix: changes in collagen, glycoproteins, and glycosaminoglycans. Am J Obstet Gynecol (1974) 120:641–51. doi:10.1016/0002-9378(74)90608-5
9. Rechberger T, Uldbjerg N, Oxlund H. Connective tissue changes in the cervix during normal pregnancy and pregnancy complicated by cervical incompetence. Obstet Gynecol (1988) 71:563–7.
10. Von Maillot KV, Zimmermann BK. The solubility of collagen of the uterine cervix during pregnancy and labour. Arch Gynakol (1976) 220:275–80. doi:10.1007/bf00673411
11. Kleissl HP, Van Der Rest M, Naftolin F, Glorieux FH, De Leon A. Collagen changes in the human uterine cervix at parturition. Am J Obstet Gynecol (1978) 130:748–53. doi:10.1016/0002-9378(78)90003-0
12. Ito A, Kitamura K, Mori Y, Hirakawa S. The change in solubility of type i collagen in human uterine cervix in pregnancy at term. Biochem Med (1979) 21:262–70. doi:10.1016/0006-2944(79)90081-4
13. Granström L, Ekman G, Malmström A. Insufficient remodelling of the uterine connective tissue in women with protracted labour. Br J Obstet Gynaecol (1991) 98:1212–6. doi:10.1111/j.1471-0528.1991.tb15391.x
14. Mahendroo M. Cervical hyaluronan biology in pregnancy, parturition and preterm birth. Matrix Biol (2019) 78-79:24–31. doi:10.1016/j.matbio.2018.03.002
15. Akins ML, Luby-Phelps K, Mahendroo M. Second harmonic generation imaging as a potential tool for staging pregnancy and predicting preterm birth. J Biomed Optic (2010) 15:026020. doi:10.1117/1.3381184
16. Carlson LC, Hall TJ, Rosado-Mendez IM, Palmeri ML, Feltovich H. Detection of changes in cervical softness using shear wave speed in early versus late pregnancy: an in vivo cross-sectional study. Ultrasound Med Biol (2018) 44:515–21. doi:10.1016/j.ultrasmedbio.2017.10.017
17. Muller M, Aït-Belkacem D, Hessabi M, Gennisson JL, Grangé G, Goffinet F, et al. Assessment of the cervix in pregnant women using shear wave elastography: a feasibility study. Ultrasound Med Biol (2015) 41:2789–97. doi:10.1016/j.ultrasmedbio.2015.06.020
18. Carlson LC, Romero ST, Palmeri ML, Muñoz Del Rio A, Esplin SM, Rotemberg VM, et al. Changes in shear wave speed pre- and post-induction of labor: a feasibility study. Ultrasound Obstet Gynecol (2015) 46:93–8. doi:10.1002/uog.14663
19. Hernandez-Andrade E, Aurioles-Garibay A, Garcia M, Korzeniewski SJ, Schwartz AG, Ahn H, et al. Effect of depth on shear-wave elastography estimated in the internal and external cervical os during pregnancy. J Perinat Med (2014) 42:549–57. doi:10.1515/jpm-2014-0073
20. Rosado-Mendez IM, Palmeri ML, Drehfal LC, Guerrero QW, Simmons H, Feltovich H, et al. Assessment of structural heterogeneity and viscosity in the cervix using shear wave elasticity imaging: initial results from a Rhesus macaque model. Ultrasound Med Biol (2017) 43:790–803. doi:10.1016/j.ultrasmedbio.2016.12.006
21. Rosado-Mendez IM, Carlson LC, Woo KM, Santoso AP, Guerrero QW, Palmeri ML, et al. Quantitative assessment of cervical softening during pregnancy in the rhesus macaque with shear wave elasticity imaging. Phys Med Biol (2018) 63:085016. doi:10.1088/1361-6560/aab532
22. Sarvazyan A, Hall TJ, Urban MW, Fatemi M, Aglyamov SR, Garra BS. AN overview OF elastography - an emerging branch OF medical imaging. Curr Med Imag Rev (2011) 7:255–82. doi:10.2174/157340511798038684TM
23. Rosado-Mendez IM, Guerrero QW, Drehfal LC, Santoso AP, Subramanian S, Kohn S, et al. Changes in cervical stiffness during pregnancy: preliminary assessment with shear wave elasticity imaging in the Rhesus macaque. In: AIP conference proceedings, 1747. Melville, NY: AIP Publishing (2016). p. 50–2.
24. Carlson LC, Hall TJ, Rosado-Mendez IM, Mao L, Feltovich H. Quantitative assessment of cervical softening during pregnancy with shear wave elasticity imaging: an in vivo longitudinal study. Interface focus (2019) 9:20190030. doi:10.1098/rsfs.2019.0030
25. Hernandez-Andrade E, Hassan SS, Ahn H, Korzeniewski SJ, Yeo L, Chaiworapongsa T, et al. Evaluation of cervical stiffness during pregnancy using semiquantitative ultrasound elastography. Ultrasound Obstet Gynecol (2013) 41:152–61. doi:10.1002/uog.12344
26. Brum J, Bernal M, Gennisson JL, Tanter M. In vivo evaluation of the elastic anisotropy of the human achilles tendon using shear wave dispersion analysis. Phys Med Biol (2014) 59:505. doi:10.1088/0031-9155/59/3/505
27. Gennisson JL, Deffieux T, Macé E, Montaldo G, Fink M, Tanter M. Viscoelastic and anisotropic mechanical properties of in vivo muscle tissue assessed by supersonic shear imaging. Ultrasound Med Biol (2010) 36:789–801. doi:10.1016/j.ultrasmedbio.2010.02.013
28. Peralta L, Rus G, Bochud N, Molina FS. Assessing viscoelasticity of shear wave propagation in cervical tissue by multiscale computational simulation. J Biomech (2015) 48:1549–56. doi:10.1016/j.jbiomech.2015.01.044
29. Rouze NC, Palmeri ML, Nightingale KR. An analytic, fourier domain description of shear wave propagation in a viscoelastic medium using asymmetric Gaussian sources. J Acoust Soc Am (2015) 138:1012–22. doi:10.1121/1.4927492
30. Huang B, Drehfal LC, Rosado-Mendez IM, Guerrero QW, Palmeri ML, Simmons HA, et al. Estimation of shear wave speed in the rhesus macaques' uterine cervix. IEEE Trans Ultrason Ferroelectrics Freq Contr (2016) 63:1243–52. doi:10.1109/TUFFC.2016.2524259
31. Haluska GJ, West NB, Novy MJ, Brenner RM. Uterine estrogen receptors are increased by ru486 in late pregnant rhesus macaques but not after spontaneous labor. J Clin Endocrinol Metab (1990) 70:181–6. doi:10.1210/jcem-70-1-181
32. Hafez ESE, Jaszczak S. Comparative anatomy and histology of the cervix uteri in non-human primates. Primates (1972) 13:297–314. doi:10.1007/bf01730575
33. Owiti GE, Tarantal AF, Lasley BL, Hendrickx AG. The effect of the anti-progestin ru 486 on early pregnancy in the long-tailed macaque (macaca fascicularis). Contraception (1989) 40:201–11. doi:10.1016/0010-7824(89)90007-3
34. Wolfgang MJ, Eisele SG, Knowles L, Browne MA, Schotzko ML, Golos TG. Pregnancy and live birth from nonsurgical transfer of in vivo- and in vitro-produced blastocysts in the rhesus monkey. J Med Primatol (2001) 30:148–55. doi:10.1111/j.1600-0684.2001.tb00003.x
35. Adams Waldorf KM, Singh N, Mohan AR, Young RC, Ngo L, Das A, et al. Uterine overdistention induces preterm labor mediated by inflammation: observations in pregnant women and nonhuman primates. Am J Obstet Gynecol (2015) 213:830–e19. doi:10.1016/j.ajog.2015.08.028
36. Palmeri ML, Feltovich H, Homyk AD, Carlson LC, Hall TJ. Evaluating the feasibility of acoustic radiation force impulse shear wave elasticity imaging of the uterine cervix with an intracavity array: a simulation study. IEEE Trans Ultrason Ferroelectrics Freq Contr (2013) 60:2053–64. doi:10.1109/TUFFC.2013.2796
37. Rouze NC, Deng Y, Trutna CA, Palmeri ML, Nightingale KR. Characterization of viscoelastic materials using group shear wave speeds. IEEE Trans Ultrason Ferroelectrics Freq Contr (2018) 65:780–94. doi:10.1109/TUFFC.2018.2815505
38. Wang M, Byram B, Palmeri M, Rouze N, Nightingale K. On the precision of time-of-flight shear wave speed estimation in homogeneous soft solids: initial results using a matrix array transducer. IEEE Trans Ultrason Ferroelectrics Freq Contr (2013) 60:758–70. doi:10.1109/TUFFC.2013.2624
39. Deffieux T, Montaldo G, Tanter M, Fink M. Shear wave spectroscopy for in vivo quantification of human soft tissues visco-elasticity. IEEE Trans Med Imag (2008) 28:313–22. doi:10.1109/TMI.2008.925077
40. Nightingale KR, Rouze NC, Rosenzweig SJ, Wang MH, Abdelmalek MF, Guy CD, et al. Derivation and analysis of viscoelastic properties in human liver: impact of frequency on fibrosis and steatosis staging. IEEE Trans Ultrason Ferroelectrics Freq Contr (2015) 62:165–75. doi:10.1109/TUFFC.2014.006653
41. Palmeri ML, Sharma AC, Bouchard RR, Nightingale RW, Nightingale KR. A finite-element method model of soft tissue response to impulsive acoustic radiation force. IEEE Trans Ultrason Ferroelectrics Freq Contr (2005) 52:1699–712. doi:10.1109/tuffc.2005.1561624
42. Torres A, Palmeri ML, Feltovich H, Hall TJ, Rosado-Mendez IM. Evaluation of sensitivity of ultrasound imaging biomarkers of cervical viscosity based on shear wave elasticity imaging: a simulation study. In: AIP conference proceedings, 2090. Melville, NY: AIP Publishing LLC (2019). p. 040011.
43. Dumont D, Palmeri M, Eyerly S, Wolf P, Byram B. Feasibility of using a generalized-Gaussian Markov random field prior for bayesian speckle tracking of small displacements. In Proceedings of the IEEE International Ultrasonics Symposium; 2014 September 3–6; Chicago, IL; New York, NY: IEEE (2014). p. 1845–8.
44. Achim A, Bezerianos A, Tsakalides P. Novel bayesian multiscale method for speckle removal in medical ultrasound images. IEEE Trans Med Imag (2001) 20:772–83. doi:10.1109/42.938245
45. Demené C, Deffieux T, Pernot M, Osmanski BF, Biran V, Gennisson JL, et al. Spatiotemporal clutter filtering of ultrafast ultrasound data highly increases Doppler and fultrasound sensitivity. IEEE Trans Med Imag (2015) 34:2271–85. doi:10.1109/TMI.2015.2428634
46. Van Loan CF. Generalizing the singular value decomposition. SIAM J Numer Anal (1976) 13:76–83. doi:10.1137/0713009
47. Brunke SS, Insana MF, Dahl JJ, Hansen C, Ashfaq M, Ermert H. An ultrasound research interface for a clinical system. IEEE Trans Ultrason Ferroelectrics Freq Contr (2007) 54:198–210. doi:10.1109/tuffc.2007.226
48. Loupas T, Powers JT, Gill RW. An axial velocity estimator for ultrasound blood flow imaging, based on a full evaluation of the Doppler equation by means of a two-dimensional autocorrelation approach. IEEE Trans Ultrason Ferroelectrics Freq Contr (1995) 42:672–88. doi:10.1109/58.393110
49. Gałecki A, Burzykowski T. Linear mixed-effects models using R. Berlin, Germany: Springer (2013). p. 245–73.
50. Ikeda H, Yoshizawa S, Maeda M, Umemura S-i., Saijo Y. Blood flow imaging using singular value decomposition filter during high-intensity focused ultrasound exposure. Jpn J Appl Phys (2019) 58:SGGE15. doi:10.7567/1347-4065/ab1a2e
51. Chevrot S, Girardin N. On the detection and identification of converted and reflected phases from receiver functions. Geophys J Int (2000) 141:801–8. doi:10.1046/j.1365-246x.2000.00139.x
52. Myers KM, Paskaleva AP, House M, Socrate S. Mechanical and biochemical properties of human cervical tissue. Acta Biomater (2008) 4:104–16. doi:10.1016/j.actbio.2007.04.009
53. Castañeda-Martinez L, Noguchi KK, Ikonomidou C, Zagzebski JA, Hall TJ, Rosado-Mendez IM. Ultrasound in medicine & biology (2020). Optimization of ultrasound backscatter spectroscopy to assess neurotoxic effects of anesthesia in the newborn non-human primate brain.
54. Wang MH, Palmeri ML, Rotemberg VM, Rouze NC, Nightingale KR. Improving the robustness of time-of-flight based shear wave speed reconstruction methods using ransac in human liver in vivo. Ultrasound Med Biol (2010) 36:802–13. doi:10.1016/j.ultrasmedbio.2010.02.007
55. Carlson LC, Feltovich H, Palmeri ML, Dahl JJ, Munoz del Rio A, Hall TJ. Estimation of shear wave speed in the human uterine cervix. Ultrasound Obstet Gynecol (2014a) 43:452–8. doi:10.1002/uog.12555
56. O’Hara S, Zelesco M, Sun Z. Shear wave elastography on the uterine cervix: technical development for the transvaginal approach. J Ultrasound Med (2019a) 38:1049–60.
57. O’Hara S, Zelesco M, Sun Z. Shear wave elastography of the maternal cervix: a transabdominal technique. Australasian Journal of Ultrasound in Medicine (2019b) 22:96–103.
58. Wang B, Zhang Y, Chen S, Xiang X, Wen J, Yi M, et al. Diagnostic accuracy of cervical elastography in predicting preterm delivery: a systematic review and meta-analysis. Medicine (Baltim) (2019) 98:e16449. doi:10.1097/MD.0000000000016449
59. Carlson LC, Feltovich H, Palmeri ML, del Rio AM, Hall TJ. Statistical analysis of shear wave speed in the uterine cervix. IEEE Trans Ultrason Ferroelectrics Freq Contr (2014b) 61:1651–60. doi:10.1109/tuffc.2014.006360
60. Carlson LC, Feltovich H, Palmeri ML, Dahl JJ, Munoz del Rio A, Hall TJ. Estimation of shear wave speed in the human uterine cervix. Ultrasound Obstet Gynecol (2014c) 43:452. doi:10.1002/uog.12555
Keywords: cervix, shear wave elasticity imaging, rhesus macaque, phase velocity, group velocity, singular value decomposition, pregnancy
Citation: Torres A, Palmeri ML, Feltovich H, Hall TJ and Rosado-Mendez IM (2021) Shear Wave Dispersion as a Potential Biomarker for Cervical Remodeling During Pregnancy: Evidence From a Non-Human Primate Model. Front. Phys. 8:606664. doi: 10.3389/fphy.2020.606664
Received: 15 September 2020; Accepted: 07 December 2020;
Published: 15 February 2021.
Edited by:
Simon Chatelin, de l'Informatique et de l'Imagerie (ICube), FranceReviewed by:
Fernando Zvietcovich, University of Houston, United StatesMichael House, Tufts Medical Center, United States
Copyright © 2021 Torres, Palmeri, Feltovich, Hall and Rosado-Mendez. This is an open-access article distributed under the terms of the Creative Commons Attribution License (CC BY). The use, distribution or reproduction in other forums is permitted, provided the original author(s) and the copyright owner(s) are credited and that the original publication in this journal is cited, in accordance with accepted academic practice. No use, distribution or reproduction is permitted which does not comply with these terms.
*Correspondence: Ivan M. Rosado-Mendez, aXJvc2Fkb0BmaXNpY2EudW5hbS5teA==
 Abel Torres1
 Ivan M. Rosado-Mendez