 Limin Zhang
 Bin Cao1
 Jiao Li
 Zhongxing Zhou
95% of researchers rate our articles as excellent or good
Learn more about the work of our research integrity team to safeguard the quality of each article we publish.
Find out more
ORIGINAL RESEARCH article
Front. Phys. , 04 December 2020
Sec. Medical Physics and Imaging
Volume 8 - 2020 | https://doi.org/10.3389/fphy.2020.600812
This article is part of the Research Topic Optics and Ultrasound in Biomedicine: Sensing, Imaging and Therapy View all 16 articles
Diffuse optical tomography (DOT) is a novel functional imaging technique that has the potential clinical application for breast cancer screening. Currently, an underexploited benefit of DOT is its ability to track and characterize dynamic events related to physiological progression, which can provide additional imaging contrast. In this work, we propose a novel 3-wavelength, 32-source–detector continuous-wave dynamic DOT system that allows relatively fast and high-sensitivity imaging by combining phase lock and photon counting technologies and obtains a balance between cost and effectiveness through series parallel measurement mode. To assess the effectiveness of the proposed system prototype, we systematically investigated the key specifications of the system, including stability, channel cross talk, and dynamic range. Furthermore, the static and dynamic phantom experiments validated the capability of the system to detect the target with low absorption contrast as well as track the changes in the target’s absorption coefficient. These preliminary results indicate that the system has great application prospects in imaging of the low-contrast lesion as well as capturing the dynamic changes of hemodynamics in tumor tissue.
Diffuse optical tomography (DOT) is a novel noninvasive technique that utilizes near infrared light to characterize the spatial distribution of optical properties in biological tissue [1]. It can generate images of the absorption or scattering properties of the tissue or other physiological parameters such as oxygenated and deoxygenated hemoglobin, lipid, and water by multiwavelength measurement. Compared with traditional imaging modalities including X-ray mammogram, ultrasound, and MRI, DOT is considered to be an ideal tool for breast cancer screening due to the merits of nonionizing radiation and low cost, as well as providing functional information [2].
After decades of development, significant advances in the field of DOT breast imaging have been made under a variety of ingenious designs [3–13]. Generally, there are three measurement modalities: time domain (TD), frequency domain (FD), and continuous wave (CW) [3–5]. TD systems can potentially provide absolute information regarding the light intensity as well as photon propagation time by means of measuring the temporal point spread function. FD systems can measure both the reduction in intensity and the phase shift of the light after it passes through tissue. The wealth of information acquired in these two systems can be employed to distinguish the internal absorption and scattering properties of the tissue; however, the systems are expensive and require relatively long acquisition times, especially for time-domain modality. CW systems only measure the change in the amplitude of the light, which allows for a relatively simple, easy operational, and affordable technique. In addition, this approach enables fast data acquisition and the use of simple detectors and electronics, which makes it possible to monitor real-time dynamic changes of physiological signals [6–8].
Despite advances in DOT imaging techniques, an underexploited benefit of DOT is its ability to acquire data at high speed for real-time monitoring. This enables DOT to both recover static distributions of endogenous contrast resulting from tumor vascularization and track dynamic temporal events related to physiological progression. Previously, on the basis of CW diffuse optical tomography systems, some researchers have exploited the potential of imaging dynamic contrasts in breast tissue by disturbing physiological conditions such as breast compression [15, 16], respiratory maneuver [17], and injection of indocyanine green agent [14–20]. For example, several groups have reported the studies of imaging the hemodynamic response of the breast to compression, which is proved to induce differences in oxygen consumption between tumor and normal tissue [16, 17]; Schmitz and Flexman et al. explored the use of a breath hold for creating dynamic contrast to distinguish healthy from cancerous tissue [18, 19]. Intes et al. investigated the pharmacokinetics of indocyanine green agent in breast tumors, harnessing the characteristic that the tumor vessel demonstrates stronger permeability compared with normal vessel [20].
At present, achieving dynamic imaging using DOT is still an ongoing task. In order to capture the transient response process of physiological signals accurately, three main technical aspects should be carefully taken into account: the imaging system must have sufficient temporal resolution; high sensitivity is required to detect tiny changes in different states to provide meaningful additional information for diagnosis; large dynamic range of the system is necessary, since light in tissue is heavily attenuated with the increase of propagation distance; thus, the degree of detection signal may vary by orders of magnitude in different measurement positions, especially for large dimension biological tissues such as breast tissue.
Based on the above considerations, a dynamic three-wavelength (685, 785, and 830 nm) CW diffuse optical tomography system was built, using 20 sources with parallel excitation through phase-locked photon counting to significantly improve temporal resolution, sensitivity, and dynamic range. To evaluate the effectiveness and capabilities of the proposed system, a series of investigations with variable contrast signals were conducted using both static and dynamic phantoms. The goals were to detect the targets with low absorption contrast and validate the ability to track changes in the target absorption coefficients over time. The work involving investigation on the key specifications of the system and phantom imaging is a prerequisite for performing clinical studies.
A schematic of the dynamic continuous-wave DOT system is shown in Figure 1. The system has three source wavelengths, 685, 785, and 830 nm, which are widely considered to be an optimal combination for resolving in vivo changes of hemoglobin [21]. For each wavelength, 32 fiber-tailed laser diodes (10 mw, LSFLD685-10, LSFLD785-10, and LSFLD830-10, Beijing Lightsensing Technologies Ltd.) are driven by a self-designed constant power circuit and modulated for performing simultaneous illumination and rejection ambient light. The three-wavelength light sources are coupled to source fibers with a core diameter of 62.5 μm and a numerical aperture of 0.22, using wave division multiplexers (685/785/830-62.5/125, Oz Optics, Canada) to sequentially illuminate the imaging object. The transmission light on the boundary is collected via detection fiber with a core diameter of 500 μm and a numerical aperture of 0.37. The detection fibers are connected with an integrated module of programmable 4-1 × 8 multimode fiber switch so that the transmission light at four different positions is able to be probed in parallel at the same time. Subsequently, the photomultiplier tube (PMT) (H2859-02, Hamamatsu Photonics, Japan) counting head coupled to the fiber switch converts the light signals to electrical pulses which can be counted by using the photon count technique and synchronously demodulated in field programmable gate array. The demodulated data are sent to the computer through a serial port for optical image reconstruction.
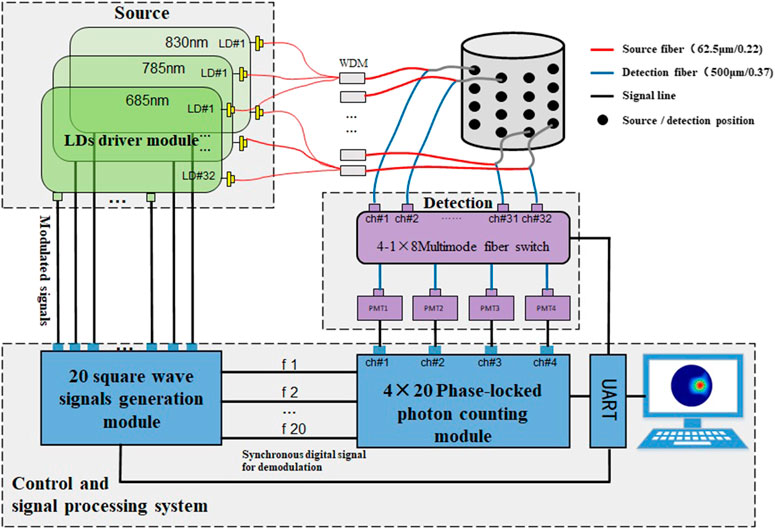
FIGURE 1. Schematic of the CW dynamic diffuse optical tomography system.
To improve the dynamic capability and balance between cost and effectiveness, a square-wave modulation phase-locked photon-counting scheme and series parallel measurement mode are proposed in this system. In the following section, the principle and process of the measurement will be given in detail.
To enable simultaneous multipoint illumination and distinguish the superposed source signals, a phase-locked photon-counting scheme was adopted. In this scheme, the sources are switched “on” and “off” by double-frequency orthogonal square-wave modulation signals with a duty cycle of 50%, and meanwhile, they are sent to the phase-locked photon-counting module as the reference signals of “
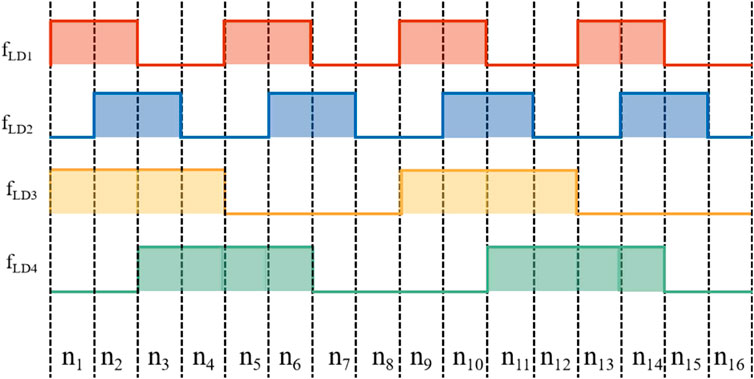
FIGURE 2. Two sets of double-frequency orthogonal square-wave signals.
When four sources LD1, LD2, LD3, and LD4 are excited simultaneously, the signal
In order to separate the superposed signals, two sets of double-frequency orthogonal square-wave signals are utilized to modulate the four sources, where
Meanwhile, the light intensity of LD1, LD2, LD3, and LD4 is obtained by solving the above equations:
Likewise, when separating the signals of n sources, it is necessary to modulate the sources by
In the ith subinterval, the detected signal
where
For all subintervals, it can be abbreviated as
where
Now, we have theoretically derived the ideal case of separating
Figure 3 illustrates the picture of the optical fiber distribution around a cylindrical imaging chamber and the sketch map. As shown in Figure 3B, taking the center of the cylindrical bottom as the origin of the coordinate system x, y, and z, 32 coaxial source–detector fibers are placed along the perpendicular Z-axis at the heights of Z = 8 mm, Z = 24 mm, Z = 40 mm, and Z = 56 mm and arranged at equal spacing on every layer to form a 4 (layers) × 8 (columns) distribution model. For illustration purposes, Figure 3B also displays the source and detector positions for the first measurement, where the D1-located column represents the detection positions and other five columns (S1–S5) except for the detection positions and their nearest neighbor points on both sides demonstrate the source positions, meaning 20 modulated sources simultaneously illuminate and four detectors in parallel probe at a time measurement. Similarly, when the positions of illuminating sources are changed, the corresponding detection positions are changed automatically via an optical switch, resulting in a total of 32D × 20S data acquired during a complete measurement for each wavelength. The acquisition time for collecting one complete frame of the projection data (32D × 20S) is approximately 2 s.
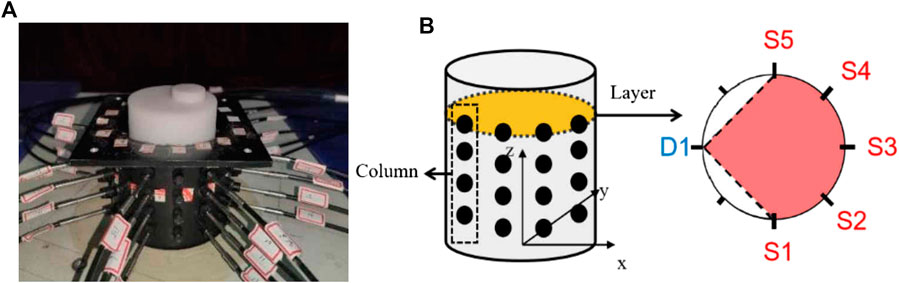
FIGURE 3. Picture of the optical fiber distribution around imaging chamber and the sketch map.
To evaluate the performance of the system in terms of stability, the cross talk among channels, the ability to reject ambient light, and dynamic range, a series of phantom experiments were conducted. In all the experiments, the sources were modulated by doubled-frequency orthogonal square waves having the frequency range 22 ∼ 211Hz, and a cylindrical polyformaldehyde phantom with both a height and diameter of 80 mm was used to mimic breast tissue. Based on time-resolved measurement, the reduced scattering coefficient of the solid phantom was determined to be 0.8 mm−1 at 685 nm, 785, and 830 nm, since it was barely changed at the three wavelengths, and the absorption coefficients of the background were 0.0041, 0.0034, and 0.0031 mm−1 at 685, 785, and 830 nm, respectively.
It is an essential requirement for all the light sources to secure a stable operation with the constant current module. To characterize the stability, a metric, referred to as coefficient of variation (CV), is calculated using the following equation:
where N is the number of detected photons in a certain time interval,
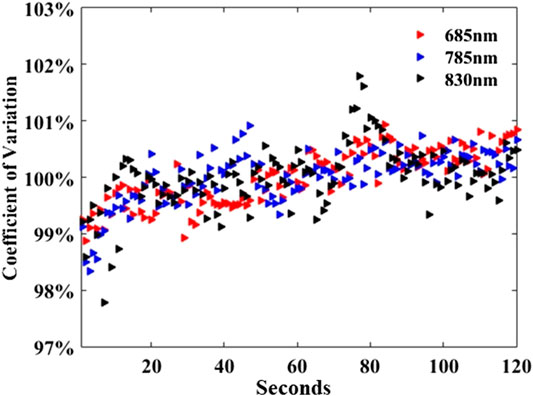
FIGURE 4. Coefficient of variation of the one source at wavelengths of 685 nm, 785 nm, and 830 nm.
Theoretically, the doubled-frequency orthogonal square wave modulation and demodulation strategy can separate multiple mixed source signals well; however, cross talk among different channels is inevitable due to source light fluctuation, counting noise, system noise, etc. In order to ensure the accuracy of the measurement results, cross talk ratio (CR) is defined to evaluate the cross talk among channels as follows
where
In this experiment, the average values of the detected photon number were calculated after ten times repeated measurements in order to minimize the error. The cross talk ratio plotted in Figure 5 as a function of 20 source locations demonstrates that the CRs of the three wavelengths are similar and most CRs are low (less than 5%), except for the positions of No. 9, No. 10, No. 11, and No. 12, which is because they are farthest to the sources, resulting in lower detection SNR.
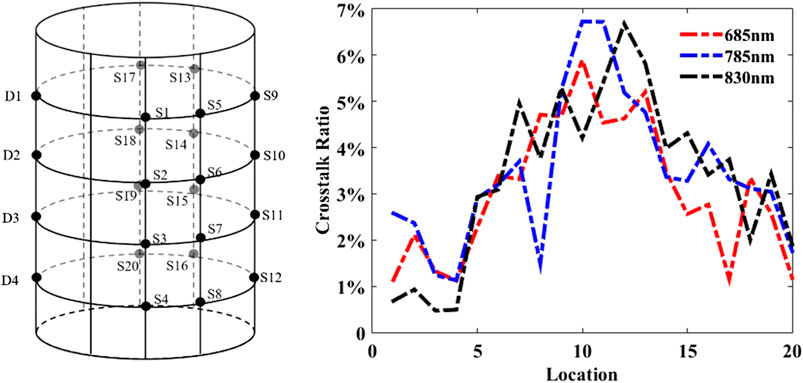
FIGURE 5. Crosstalk assessments: source‐detector array configuration (left) and the channel‐to‐channel crosstalk‐ratio of 20 source locations at the wavelengths of 685 nm, 785 nm, and 830 nm (right).
In a conventional single photon counting mode, rejecting ambient light is essential to prevent undesired noise interference and to protect the PMT. However, in the phase-locked mode, the ambient light considered as a stationary signal can be filtered out during the demodulation process. In order to evaluate the system’s ability to reject ambient light, a continuous counting experiment was performed with the sources turned off and the ambient light intensity increased gradually. The experimental results listed in Table 1 show that the photon number obtained using the conventional single photon counting mode increased from 2,476 to 1,065,427 with the increase of ambient light intensity; however, the photon number acquired using double-frequency counting mode increased from 18 to 76, meaning that the system has a significantly high ability to reject ambient light.
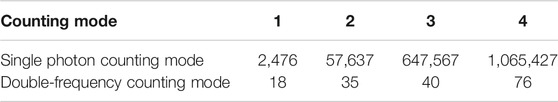
TABLE 1. Counted photon number of ambient light under two counting modes.
Dynamic range is an important evaluation criterion, since the detected photon number may vary by orders of magnitude in different measurement positions in large dimensions of biological tissues such as breast issues. The lower and upper bounds of dynamic range are, respectively, determined by noise equivalent power (the minimum optical power required for an output signal-to-noise ratio of 1) and the maximum detected value acquired in the linear range of the detector. First, we tested the behavior of dark counting in conventional and phase-locked photon-counting modes by placing the system in the dark room. Within the integration time of 1 s, the dark counting in the phase-locked photon-counting mode measurement was two orders of magnitude lower than the conventional method. Then, the light source was turned on and the intensity was gradually increased by enhancing the modulation amplitude with a fixed step, and the number of detected photons was recorded. Since this experiment is a methodological verification, only the light source with the wavelength of 685 nm was selected. Figure 6 shows the photon number increased linearly until the maximum value of 1.5×10⁶ with the increment of the source intensity, whereby the dynamic range can be calculated to be 109 dB. It is worth noting that the maximum number of photons is related to the maximum intensity of the source. Theoretically, the maximum linear photon count range of the PMT used in the system is 5 × 10⁶, and thereby, the dynamic range is up to 120 dB.
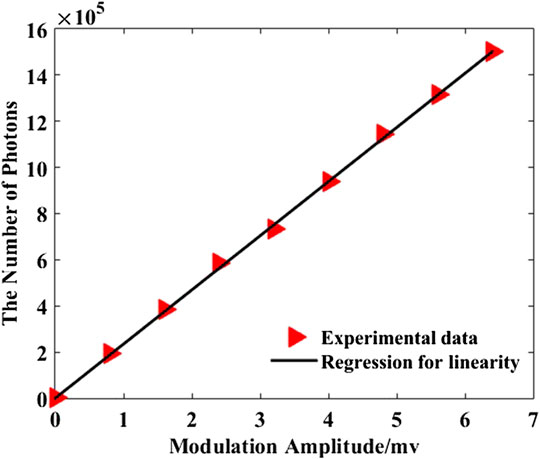
FIGURE 6. Measured dynamic range of the DOT system.
To investigate the performance of the three-wavelength dynamic DOT system, a series of phantom experiments were conducted. In all the experiments, a cylinder hole (target henceforth) in the phantom was injected with a solution that has varying optical absorption coefficients by mixing different concentrations of Intralipid and India ink to mimic the tumor [22–24].
As shown in Figure 7A, to evaluate the imaging sensitivity of the system, a target was drilled at 17 mm off-center of the phantom, with a diameter of 20 mm and a depth of 80 mm. Herein, four target-to-background absorption contrasts of 4, 2, 1.5, and 1.2 were prepared. After two sets of measurement, data were obtained by difference measurements (measure the change in the optical properties of the object based on measurements before and after the change); the images can be reconstructed by the Newton–Raphson-based nonlinear algorithm with the algebraic reconstruction technique embedded for the linear inversion [25].

FIGURE 7. Static phantom experiments: (A) sketch of the phantom, (B) cross-sectional reconstructed images with four different target-to-background absorption contrasts at three wavelengths at Z = 24 mm, and (C) profiles of the target-to-background absorption contrast along the X-axis.
Figure 7B shows the cross-sectional images with four different absorption contrasts at three wavelengths at Z = 24 mm. We can see that the position and size of the targets were reconstructed accurately for each wavelength, even with the absorption contrast as low as 1.2. The horizontal profiles passing through the target centers, that is, the X-profiles, of the images are also presented in Figure 7C. We can see that it quantitatively reflects the variation trend of the reconstructed absorption contrast, which is in accordance with the truth, suggesting the capability of the system to recognize targets with different absorption coefficients. Additionally, we can observe that the reconstructed image quality at 685 nm wavelength is superior to that at 785 and 830 nm, which ascribes to the higher response of the PMT to shorter wavelengths leading to larger photon-counting rate and corresponding higher signal-to-noise ratio.
To assess the system’s capability to track the change in absorption property, a dynamic phantom experiment was designed to stimulate the process of breath hold which is commonly used in clinical diagnoses [18]. As illustrated in Figure 8A, the phantom used in this experiment is the same as mentioned above. The absorption coefficient of solution A composed of Intralip and India ink was set to
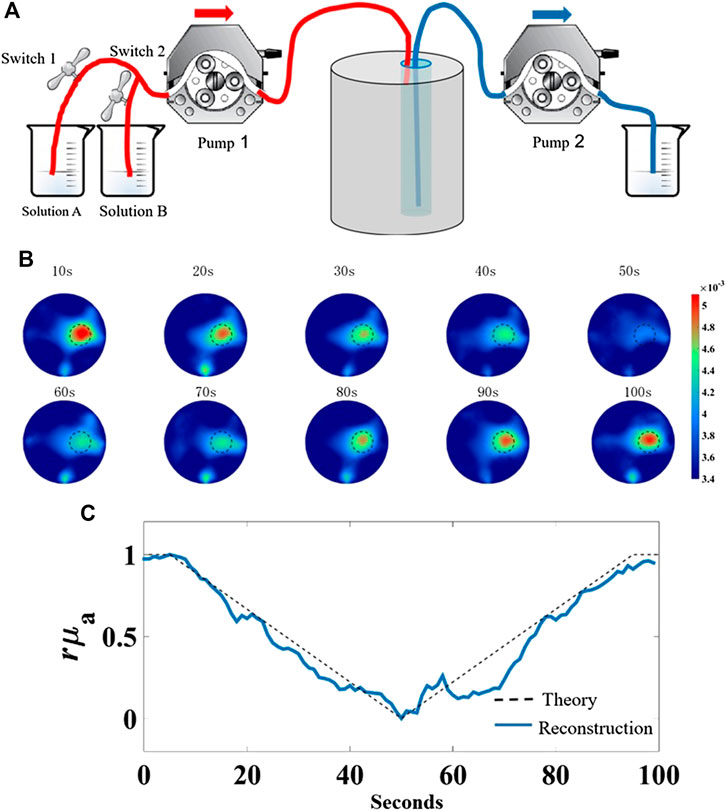
FIGURE 8. Dynamic phantom experiment to mimic the process of breath hold. (A) Schematic of dynamic phantom, (B) representative 10 reconstructed absorption coefficient images in chronological order, (C) plots of the normalized theoretical values and average values of reconstructed absorption coefficient in the target region vs. measurement time.

TABLE 2. Dynamic phantom experiment to mimic the process of breath hold.
The images were reconstructed with the temporal resolution of 2 s per frame; thus, a total of 50 frames of images were obtained. For simplicity, 10 frames in chronological order are representatively displayed in Figure 8B, where the reconstructed
We have built a high-density continuous-wave dynamic diffusion optical tomography system. The system consists of 96 sources at three wavelengths (685, 785, and 830 nm) and can achieve simultaneous multipoint illumination and multichannel parallel measurement based on the phase-locked photon-counting detection of the square-wave modulation mode. To verify the performance of the system, we conducted a series of phantom experiments to assess the primary criteria including stability, channel cross talk, the ability to reject ambient light, and dynamic range. The experimental results demonstrated the CVs of the sources fluctuate within 1%, the channel-to-channel cross talk ratio is below 5%, the dynamic range is up to 120 dB, and the tolerance to ambient interference is strong, suggesting the proposed system demonstrates good performance. On these bases, static phantom imaging experiments showed that the system can distinguish the target-to-background absorption contrast as low as 1.2 and accurately reconstruct the position, size, and shape of the target. A self-designed dynamic experiment was conducted to mimic the process of breath hold by changing the absorption coefficient of the target region, which demonstrated that the changes in the trend of the absorption coefficient of the target region were tracked accurately. These preliminary findings indicate the future potential of the dynamic DOT system in breast tumor screening, which may provide help for clinical diagnosis and treatment of breast tumors.
The raw data supporting the conclusions of this article will be made available by the authors, without undue reservation.
LZ supervised the project and wrote the manuscript. BC, XH, and ZS designed the experimental setup, collected experimental data, and participated in the manuscript writing. JL and ZZ offered manuscript revision. FG guided the experimental design. All authors contributed to the article and approved the submitted version.
This work was financially supported by the National Natural Science Foundation of China (81671728, 81871393, 81771880, and 81971656) and Tianjin Municipal Government of China (18JCYBJC29400, 19JCQNJC12800, and 19JCYBJC28600).
The authors declare that the research was conducted in the absence of any commercial or financial relationships that could be construed as a potential conflict of interest.
1. Boas DA, Brooks DH, Miller EL, DiMarzio CA, Kilmer M, Gaudette RJ, et al. Imaging the body with diffuse optical tomography. IEEE Signal Process Mag (2001) 18:57–75. doi:10.1109/79.962278
2. Leff DR, Warren OJ, Enfield LC, Gibson A, Athanasiou T, Patten DK, et al. Diffuse optical imaging of the healthy and diseased breast: a systematic review. Breast Canc Res Treat (2008) 108:9–22 doi:10.1007/s10549-007-9582-z
3. Jiang HB, Paulsen KD, Osterberg UL, Pogue BW, Patterson MS Simultaneous reconstruction of optical absorption and scattering maps in turbid media from near-infrared frequency-domain data. Opt Lett (1995) 20:2128–30. doi:10.1364/OL.20.002128
4. Taroni P, Torricelli A, Lorenzo S, Pifferi A, Arpaia F, Danesini G, et al. Time-resolved optical mammography between 637 and 985 nm: clinical study on the detection and identification of breast lesions. Phys Med Biol (2005) 50(11):2469–88. doi:10.1088/0031-9155/50/11/003
5. Rinneberg RH, Grosenick D, Moesta KT, Wabnitz H, Mucke J, Wübbeler G, et al. Detection and characterization of breast tumours by time-domain scanning optical mammography. Opto-Electron Rev (2008) 16:147–62. doi:10.2478/s11772-008-0004-5
6. Liang XP, Zhang QZ, Li CQ, Grobmyer SR, Fajardo LL, Jiang HB. Phase-contrast diffuse optical tomography pilot results in the breast. Acad Radiol (2008) 15:859–66. doi:10.1016/j.acra.2008.01.028
7. Ven S, Elias SG, Wiethoff AJ, Voort M, Nielsen T, Brendel B, et al. Diffuse optical tomography of the breast: preliminary findings of a new prototype and comparison with magnetic resonance imaging. Eur Radiol (2009) 19:1108–13. doi:10.1007/s00330-008-1268-3
8. Colier W, Sluijs M, Menssen J, Oeseburg B. A new and highly sensitive optical brain imager with 50 hz sampling rate. Neuroimage (2000) 11:S542. doi:10.1016/S1053-8119(00)91473-3
9. Chen NG, Guo P, Yan S, Piao D, Zhu Q. Simultaneous near-infrared diffusive light and ultrasound imaging. Appl Optic (2001) 40:6367–80. doi:10.1364/AO.40.006367
10. You SS, Jiang YX, Zhu QL, Liu JB, Zhang J, Dai Q, et al. US-guided diffused optical tomography: a promising functional imaging technique in breast lesions. Eur Radiol (2010) 20:309–17. doi:10.1007/s00330-009-1551-y
11. Fang QQ, Carp SA, Selb J, Boverman G, Zhang Q, Kopans DB, et al. Combined optical imaging and mammography of the healthy breast: optical contrast derived from breast structure and compression. IEEE Trans Med Imag (2009) 28:30–42. doi:10.1109/TMI.2008.925082
12. Brooksby B, Jiang SD, Dehghani H, Pogue BW, Paulsen KD, Kogel C, et al. Magnetic resonance-guided near-infrared tomography of the breast. Rev Sci Instrum (2004) 75:5262–70. doi:10.1063/1.1819634
13. Ntziachristos V, Ma XH, Chance B. Time-correlated single photon counting imager for simultaneous magnetic resonance and near infrared mammography. Rev Sci Instrum (1998) 69:4221–33. doi:10.1063/1.1149235
14. Jain RK. Normalizing tumor vasculature with anti-angiogenic therapy: a new paradigm for combination therapy. Nat Med (2001) 7:987–9. doi:10.1038/nm0901-987
15. Maki A, Yamashita Y, Watanabe E, Koizumi H. Visualizing human motor activity by using non-invasive optical topography. Front Med Biol Eng (1996) 7:285–97.
16. Jiang SD, Pogue BW, Laughney AM, Kogel CA, Paulsen KD. Measurement of pressure-displacement kinetics of hemoglobin in normal breast tissue with near-infrared spectral imaging. Appl Optic (2009) 48:130–6. doi:10.1364/AO.48.00D130
17. Carp SA, Selb J, Fang Q, Moore R, Kopans DB, Rafferty E, et al. Dynamic functional and mechanical response of breast tissue to compression. Optic Express (2008) 16:16064–78. doi:10.1364/OE.16.016064
18. Schmitz CH, Klemer DP, Hardin R, Katz MS, Pei YL, Graber HL, et al. Design and implementation of dynamic near-infrared optical tomographic imaging instrumentation for simultaneous dual breast measurements. Appl Optic (2005) 44:2140–53. doi:10.1364/AO.44.002140
19. Flexman ML, Khalil MA, Abdi RA, Kim HK, Fong CJ, Desperito E, et al. Digital optical tomography system for dynamic breast imaging. J Biomed Optic (2011) 16:076014. doi:10.1117/1.3599955
20. Intes X, Ripoll J, Chen Y, Nioka S, Yodh AG, Chance B. In vivo continuous-wave optical breast imaging enhanced with indocyanine green. Med Phys (2003) 30:1039–47. doi:10.1118/1.1573791
21. Scholkmann F, Kleiser S, Metz AJ, Zimmermann R, Pavia JM, Wolf U, et al. A review on continuous wave functional near-infrared spectroscopy and imaging instrumentation and methodology. Neuroimage (2014) 85:6–27. doi:10.1016/j.neuroimage.2013.05.004
22. Ninni PD, Martelli F, Zaccanti G. The use of India ink in tissue-simulating phantoms. Optic Express (2010) 18:26854–65. doi:10.1364/OE.18.026854
23. Pogue BW, Patterson MS. Review of tissue simulating phantoms for optical spectroscopy, imaging and dosimetry. J Biomed Optic (2006) 5:2037–53. doi:10.1117/1.2335429
24. Spinelli L, Botwicz M, Zolek N, Kacprzak M, Milej D, Sawosz P, et al. Determination of reference values for optical properties of liquid phantoms based on intralipid and India ink. Biomed Optic Express (2014) 5:2037–53. doi:10.1364/BOE.5.002037
Keywords: diffuse optical tomography, square-wave modulation, image reconstruction, phase-locked photon-counting, dynamic range, cross talk
Citation: Zhang L, Cao B, He X, Sun Z, Li J, Zhou Z and Gao F (2020) High-Sensitive Multiwavelength Dynamic Diffuse Optical Tomography System: A Preliminary Investigation. Front. Phys. 8:600812. doi: 10.3389/fphy.2020.600812
Received: 31 August 2020; Accepted: 30 October 2020;
Published: 04 December 2020.
Edited by:
Chao Tian, University of Science and Technology of China, ChinaReviewed by:
Du Le, Florida International University, United StatesCopyright © 2020 Zhang, Cao, He, Sun, Li, zhou and Gao. This is an open-access article distributed under the terms of the Creative Commons Attribution License (CC BY). The use, distribution or reproduction in other forums is permitted, provided the original author(s) and the copyright owner(s) are credited and that the original publication in this journal is cited, in accordance with accepted academic practice. No use, distribution or reproduction is permitted which does not comply with these terms.
*Correspondence: Limin Zhang, emhhbmdsbUB0anUuZWR1LmNu
Disclaimer: All claims expressed in this article are solely those of the authors and do not necessarily represent those of their affiliated organizations, or those of the publisher, the editors and the reviewers. Any product that may be evaluated in this article or claim that may be made by its manufacturer is not guaranteed or endorsed by the publisher.
Research integrity at Frontiers
Learn more about the work of our research integrity team to safeguard the quality of each article we publish.