 Guangjie Zhang
 Wenzhao Li1
 Changhui Li
95% of researchers rate our articles as excellent or good
Learn more about the work of our research integrity team to safeguard the quality of each article we publish.
Find out more
ORIGINAL RESEARCH article
Front. Phys. , 20 November 2020
Sec. Medical Physics and Imaging
Volume 8 - 2020 | https://doi.org/10.3389/fphy.2020.600589
This article is part of the Research Topic Optics and Ultrasound in Biomedicine: Sensing, Imaging and Therapy View all 16 articles
In this study, we reported a photoacoustic (PA) imaging system for whole-breast imaging. Similar to the traditional X-ray mammography, this system slightly compressed the breast by a water tank. The PA signal is acquired via scanning a long unfocused ultrasonic linear array probe over the breast top surface, and the expanded high-energy laser pulses illuminate the breast bottom through a transparent supporting plate. Scanning the unfocused transducer probe is equivalent to a synthetic two-dimensional (2D) matrix array, which significantly increased the field of view (FOV) via a much easier way and at a much lower cost. Our phantom results demonstrated that this system has a great potential for clinical implementation.
Breast cancer is the most common cancer for women and ranks top of newly diagnosed cancers in 2018 [1]. Early detection and accurate diagnosis of breast cancer can substantially improve the survival rate [2–4]. Although X-ray mammography serves as the standard imaging method, it suffers lower sensitivity for dense breasts [5], and the radiation hazard also prevents it to be frequently used. Ultrasound (US) and magnetic resonance imaging (MRI) are also common imaging modalities adjunct to mammography [6–8]. However, MRI not only is expensive and complicated but also often requires exogenous contrast agent. US is the most convenient clinical imaging method, but it primarily depicts the structural information with relatively lower specificity, as well as its diagnosis accuracy highly depends on the physician’s personal experience. Over the past decade, the emerging photoacoustic (PA) breast imaging method gained increasing attention with promising clinical study results [9, 10].
Based on the PA effect, PA imaging (PAI) combines the optical contrast and acoustic detection [11]. Via detecting US pressure waves generated through instant thermal expansion after certain tissue (optical absorber) absorbing the energy of the laser pulse, PAI can reconstruct images of those optical absorbers. Because angiogenesis and hypoxia are two typical hallmarks for breast cancer [12, 13] and the hemoglobin in blood is a strong endogenous optical absorber in the near infrared regime, most PA breast imaging systems target the abnormal vasculature, including morphology (such as the vessel density) and function (such as the oxygenation saturation).
Up to now, several PA breast imaging platforms have been developed, which can be classified into two types: local breast imaging based on handheld probes and whole-breast imaging. Owing to its familiarity to physicians, the PA handheld probe has been widely studied [14, 15]. Moreover, commercial PA/US handheld products are also available [16, 17]. However, handheld probes only image limited part of the breast and suffers artifacts caused by limited-view issue. Therefore, PA whole-breast imaging also gains much attention [9, 18–20]. Most of the PA whole-breast imaging systems require patients to be in a prone position. Toi et al. [14] developed a system with a hemispherical-shaped detector array. Lin et al. [9] scanned the breast with a 220-mm-diameter, 512-element full-ring ultrasonic transducer array, whereas researchers in Twente University used an 80-mm-diameter, 590-element two-dimensional (2D) planar array [21]. Instead of prone position design, Zhixing et al. [19] reported a system similar to the X-ray mammographic geometry in which it employed a 572-element 2D planar array with a diameter of 80 mm lying under the compressed breast. Due to the technical complexity and cost, current 2D planar arrays used in PA breast imaging not only have limited data acquisition channels but also the element size is generally large, which sacrifices the spatial resolution. Compared to the 2D array probe, it is much easier to manufacture a linear array with smaller element size, as well as its parallel data acquisition system. Nikhila et al. [22] presented a dual scan mammoscope system by two focused array, and they employed the “virtual line” algorithm to successfully improve the elevation resolution. But the inherent focusing characteristic of this probe still limits its effective acquisition angle, making it difficult to image vertically obliquely aligned targets in 3D.
In this work, we presented a prototype PA whole-breast imaging system: photoacoustic synthetic matrix array tomography (PA-Smart). Our design employs the operation posture as in X-ray mammography, where patients stand (or sit) during the imaging procedure. Unlike the work reported in Refs. 19, 22, we scanned the breast with a one-dimensional (1D) unfocused linear probe over the upper surface of the breast. We have previously reported a method to realize a large-scale 2D planar array via scanning an unfocused linear array [23]. Based on this method, our system significantly increased the field of view (FOV) in a much easier way and at a much lower cost for PA breast imaging. At the same time, we used high-energy NIR laser illuminating the bottom of the breast over a large area to deliver enough photons into the breast within the safety limit. The phantom study demonstrated that our system can finish imaging an FOV of more than 10 cm × 10 cm × 4 cm within 33 s.
The PA-Smart imaging system is shown in Figure 1A. Similar to X-ray mammography, the subject stands in front of the system, and one of the patient’s breasts was placed onto a transparent plate (made of glass) and was mildly compressed by the bottom of a water tank above the breast. Slight compression can not only reduce the breast thickness to facilitate light to penetrate but also reduce the tissue movement caused by breathing. An electrical translational stage drives a 1D unfocused linear US array to scan in the water tank at a speed of 3 mm/s. The bottom of the water tank is made by low-density polyethylene (LDPE) material that has a similar acoustic impedance with the breast tissue.
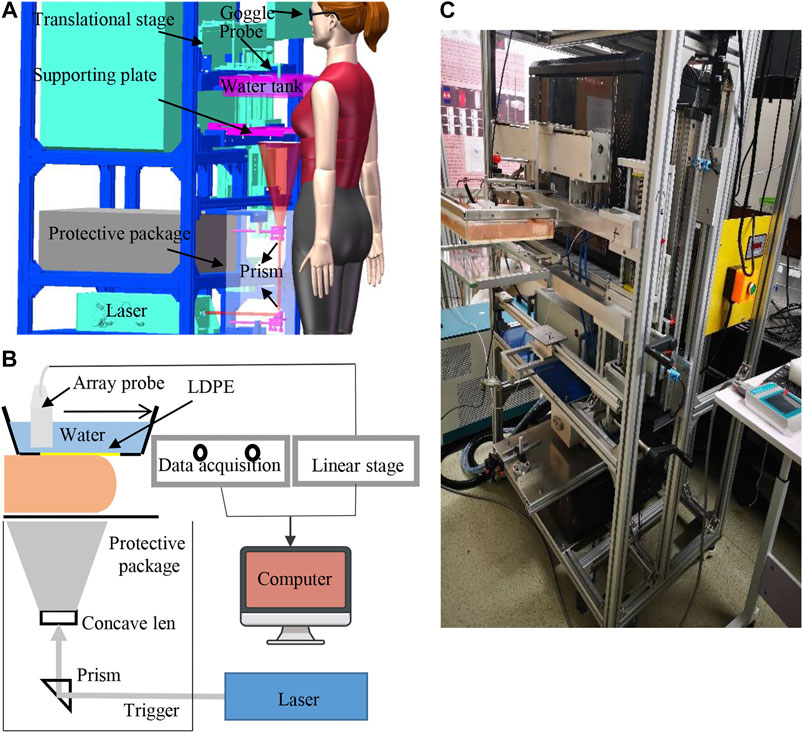
FIGURE 1. System setup. (A) 3D interior structure presentation of the photoacoustic breast imaging system; (B) schematic diagram of the system design. (C) Photography of the prototype system.
A Q-switched Nd: YAG laser (MQ/X, Beamtech Co., Ltd., China) provided 9-ns 1064-nm laser at a maximum pulse energy of 1.6 J/pulse and a repetition rate of 10 Hz to excite PA signals. The laser beam passed a concave lens and was expanded to be 10 cm in diameter onto the breast’s bottom surface, guaranteeing the optical fluence on the tissue surface less than the American National Standards Institute (ANSI) safety limit at 1,064 nm (100 mJ/cm2). To further ensure the safety, laser paths are confined in the protective package, and the only risk comes from the light leaking from the glass. Laser safety goggles are required for both the patient and the physician during examination. Also, the laser system specially designed a visible low-power red guiding light, which shares the same paths with the 1064-nm laser; then, we can double-check the laser alignment before each examination.
Figure 2A demonstrated the mechanism of constructing a synthetic large-scale 2D planar matrix array via scanning a long 1D unfocused array. The array used in this study, as shown in Figure 2B, consists of two identical customized unfocused linear array probes (TomoWave Inc., Houston, United States). Each subprobe has 48 elements of 1.0 mm × 1.0 mm, and the pitch is 1.35 mm. The array has a center frequency of 1.2 MHz and the bandwidth covering from 0.5 to 6.0 MHz. The theoretical acceptance angle for each unfocused element is about 45° at 1.5 MHz, guaranteeing to effectively detect PA signals from a large angle, which is essential for 3D reconstruction. The detected PA signal was amplified and recorded by a customized 12-bit data acquisition system (TomoWave Inc., Houston, United States) at a 25 MHz sampling rate.
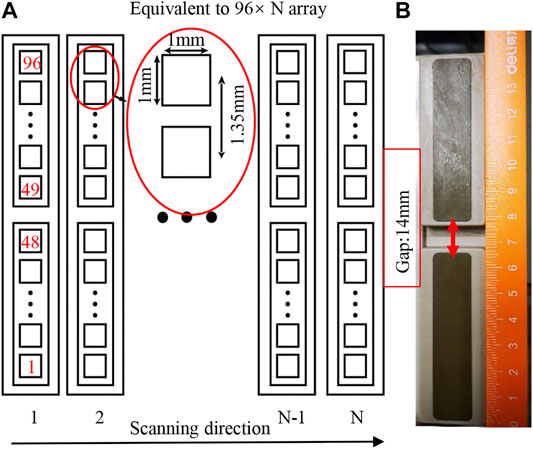
FIGURE 2. (A) Schematic diagram of the probe as well as the scanning scheme; (B) photograph of the combined probe consisting of two linear probes.
In the following phantom study, we generally scanned the linear array about 10 cm. Considering the width of each element as 1 mm, scanning 10 cm corresponds to 100 columns of elements (N = 100) in Figure 2A. The equivalent large-scale 2D planar matrix array has 96 × 100 (∼10 k) elements, leading to a substantially increased field of view (FOV). We employed the universal filtered back projection (FBP) algorithm [24] with a planar detection surface to do the 3D image reconstruction.
The imaging resolution of the system is influenced by several factors, including array’s characteristics (element size, pitch, and bandwidth) and the synthetic numerical aperture. We experimentally measured the spatial resolution by imaging three strands of black human hair buried in a scattering agar phantom, which had a thickness of 5 cm and consisted of 3% agar and 1% intra-lipid.
The three hair strands were horizontally embedded in the agar phantom at depths of 12, 25, and 35 mm from the top surface of the phantom, respectively. Figure 3A showed a cross section of the reconstructed image with the Hilbert transform [25]. From these results, we use Gaussian fitting for the values along the three horizontal dashed lines and three vertical solid lines as shown in Figure 3A. Figures 3 B and C presented the fitting results at a depth of 12 mm. According to the results, the lateral resolutions were about 1.12, 1.37, and 1.57 mm at depths of 12, 25, and 35 mm, respectively. And the corresponding elevation resolutions at those three depths are about 0.60, 0.61, and 0.63 mm, respectively.
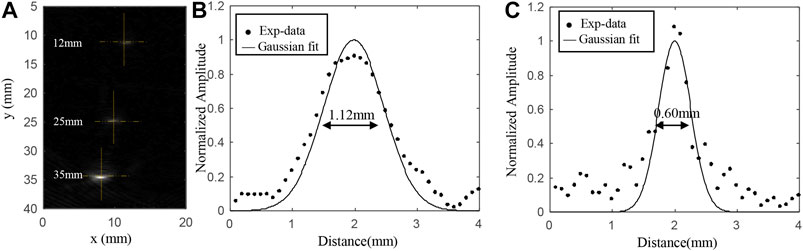
FIGURE 3. (A) Cross section of the reconstructed imaging with the Hilbert transform; (B) reconstructed PA values along the horizontal yellow line at the depth of 12 mm; (C) reconstructed PA values along the vertical yellow line at the depth of 12 mm.
Considering the significant decrease in light fluence inside the thick breast tissue, we also studied the light fluence distribution inside a breast model by numerical simulation with COMSOL (COMSOL Inc., Sweden). As shown in Figure 4A, the breast tissue model is approximated to be a half cylindroid with a thickness of 5 cm. The cylindroid long and short axes are 20 and 15 cm, respectively. The model composes of the skin layer (∼3 mm thick) and adipose layer, with the corresponding optical absorption and scattering coefficients being (
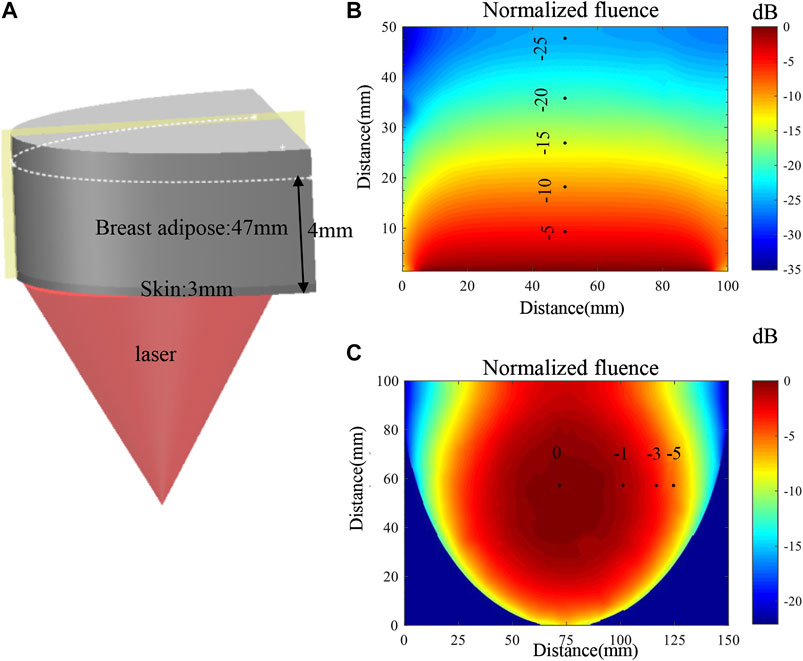
FIGURE 4. (A) Schematic diagram of the simulation model and the illumination setup. (B) Map of the optical fluence along the vertical section marked by the yellow plane. (C) Map of the optical fluence at the horizontal section marked by the white dashed line.
The simulation of the light fluence distribution is based on the diffusion equation for the global region as in Eq. 1, which has been widely employed in PA imaging study [28],
where
To validate the system’s FOV and the capability of imaging complicated targets, we did two phantom experiments, in which all the imaged targets were buried in the agar phantom made of 3% agar and 1% intra-lipid. In the first phantom, we embedded two carbon rods (0.7 mm in diameter) and one helix object (7 mm in diameter) made from a black strip in a 4-cm-thick agar phantom, as illustrated in Figure 5A. These objects were horizontally buried approximately 2.0 cm deep into the phantom, in which the helix was located at the center. The laser illuminated upwardly onto the bottom of the phantom. Then, within 34 s, the array continuously scanned a total length of 100 mm at a speed of 3 mm/s, leading to a large-scale equivalent matrix array of 100 mm × 130 mm in size and nearly 10k elements (100 × 96 = 9,600). The 3D reconstructed image is shown in Figure 5B with an online animation (movie01). According to the result, not only the two wires but also the helix was well-reconstructed.
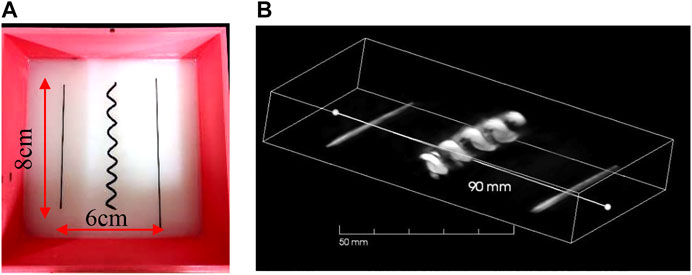
FIGURE 5. (A) Photograph of carbon rods and helix in scattering medium in phantom study; (B) 3D result of carbon rods and helix.
To study the potential artifact caused by the limited-view issue, we made the second phantom in which two helix objects (both about 7 mm in diameter) and one carbon fiber (1 mm in diameter) were embedded. Unlike the first phantom, the carbon fiber lied in the center and two helixes lied close to the two side edges (also close to the edge of FOV), as shown in Figure 6A. The distance from the middle carbon fiber to the center of the helix is approximately 25 mm. Figure 6A was the photograph of the phantom. We scanned a length of total 90 mm, leading to an equivalent large-scale matrix array with 90 × 106 (∼9 k) elements. The 3D image reconstruction is shown in Figure 6B with an online animation (movie02). Owing to the large FOV and wide acceptance angle, both the helix and carbon fiber were well-reconstructed. In addition, the wide acceptance angle also helps recover oblique surface profile, as shown in Figure 6C in which we provide the MAP imaging of one period of the helix, except the middle part where the generated PA wave propagates parallel to the probe, which cannot be detected due to the limited view [29].
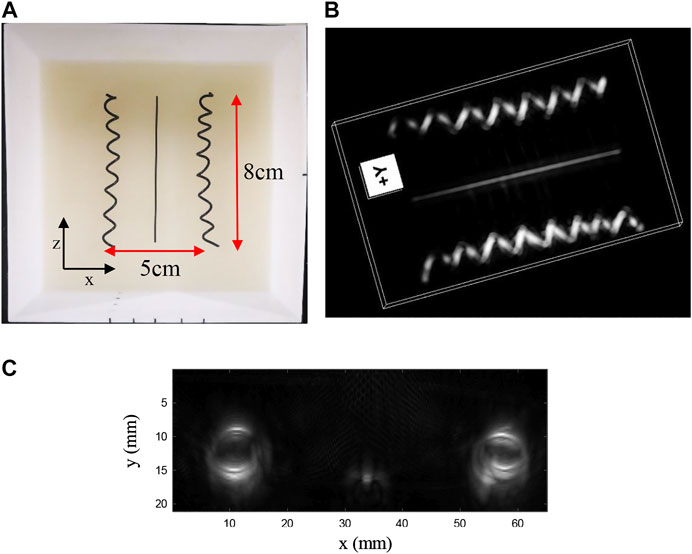
FIGURE 6. (A) Photograph of carbon rods and helixes in scattering medium in phantom study; (B) 3D result of carbon rods and helixes; (C) MAP imaging of one period of the helix.
Next, to demonstrate the ability of deep imaging, we continued to image three carbon fibers (1 mm in diameter) at 1.0, 2.0, and 3.0 cm depths into the agar phantom, as shown Figure 7A. The imaging result is shown in Figure 8A. Due to the large difference in the light fluence as shown in Figure 7B, the fiber at the deeper location, that is, closer to the illumination source, would have much larger PA value, leading to an apparently thicker diameter in the 3D reconstructed images. Therefore, we applied fluence compensation, and the result is shown in Figure 8B.
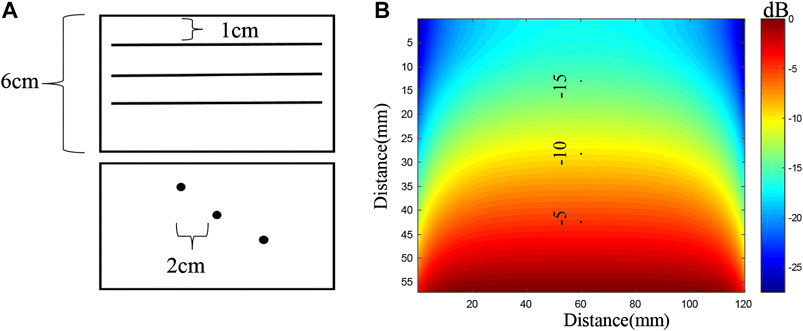
FIGURE 7. (A) Structure of phantom; (B)
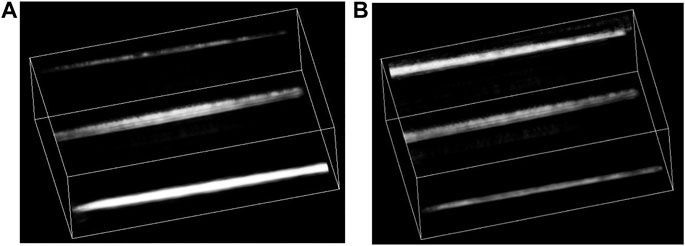
FIGURE 8. (A) 3D result of three carbon rods without fluence compensation; (B) 3D result of three carbon fibers with fluence compensation.
In this work, we developed a PA-Smart whole-breast imaging system. The proposed imaging posture is familiar to physicians and facilitates patients’ examination. The large FOV of the system is achieved based on the synthetic matrix array method via scanning an unfocused linear array. Besides, the synthetic 2D array can have less reconstruction artifacts, which is crucial for whole-breast imaging. We did phantom experiments to validate the performance of the system. The clinical study is our next step to explore the power of this system.
However, there is relatively lower reconstruction quality of the side of the helix, which is caused by the “limited view” issue. In addition, the current resolution is about 1 mm, which is not suitable for imaging fine vasculature in breast tumor. Moreover, the 14-mm physical gap between two independent linear probes also degraded the imaging quality, especially for those just under the gap. We are working on a new probe with longer length and more elements with smaller element size. New reconstruction algorithms and machine learning will be applied to help solving problems with the limited view.
The original contributions presented in the study are included in the article/supplementary material, further inquiries can be directed to the corresponding author.
CL conceived the idea. GZ designed the system and did data analysis. All the authors contributed to the discussion on the results for this manuscript.
This work was supported in part by the National Key Research and Development Program from the Ministry of Science and Technology of the People’s Republic of China (No.2017YFE0104200), Beijing Natural Science Foundation (JQ18023), the National Natural Science Foundation of China (No. 81421004, 81301268), and the National Key Instrumentation Development Project from the Ministry of Science and Technology of the People’s Republic of China (No. 2013YQ030651).
The authors declare that the research was conducted in the absence of any commercial or financial relationships that could be construed as a potential conflict of interest.
1. Siegel RL, Miller KD, Jemal A. Cancer statistics, 2018. Cancer J Clinicians. (2018). 68(1):7–30. doi:10.3322/caac.21442.
2. Elmore JG, Armstrong K, Lehman CD, Fletcher SW. Screening for breast cancer. J Am Med Assoc. (2005). 293(10):1245–56. doi:10.1001/jama.293.10.1245.
3. Bray F, McCarron P, Parkin DM. The changing global patterns of female breast cancer incidence and mortality. Breast Canc Res. (2004). 6(6):229. doi:10.1186/bcr932.
4. Miller AB, Wall C, Baines CJ, Sun P, To T, Narod SA. Twenty five year follow-up for breast cancer incidence and mortality of the Canadian National Breast Screening Study: randomised screening trial. Bmj. (2014). 348:g366. doi:10.1136/bmj.g366.
5. Freer PE. Mammographic breast density: impact on breast cancer risk and implications for screening. Radiographics. (2015). 35(2):302–15. doi:10.1148/rg.352140106.
6. Madjar H. Role of breast ultrasound for the detection and differentiation of breast lesions. Breast Care. (2010). 5(2):109–14. doi:10.1159/000297775.
7. Taylor KJW, Merritt C, Piccoli C, Schmidt R, Rouse G, Fornage B, et al. Ultrasound as a complement to mammography and breast examination to characterize breast masses. Ultrasound Med Biol. (2002). 28(1):19–26. doi:10.1016/s0301-5629(01)00491-4.
8. Saslow D, Boetes C, Burke W, Harms S, Leach MO, Lehman CD, et al. American Cancer Society guidelines for breast screening with MRI as an adjunct to mammography. Cancer J Clin. (2007). 57(2):75–89. doi:10.3322/canjclin.57.2.75.
9. Lin L, Hu P, Shi J, Appleton CM, Maslov K, Li L, et al. Single-breath-hold photoacoustic computed tomography of the breast. Nat Commun. (2018). 9(1):2352. doi:10.1038/s41467-018-04576-z.
10. Becker A, Masthoff M, Claussen J, Ford SJ, Roll W, Burg M, et al. Multispectral optoacoustic tomography of the human breast: characterisations of healthy tissue and malignant lesions using a hybrid ultrasound-optoacoustic approach. Eur Radiol. (2017). 28(2):602–609. doi:10.1007/s00330-017-5002-x.
11. Wang LV, Hu S. Photoacoustic tomography: in vivo imaging from organelles to organs. Science. (2012). 335(6075):1458–62. doi:10.1126/science.1216210.
12. Folkman J. Angiogenesis in cancer, vascular, rheumatoid and other disease. Nat Med. (1995). 1(1):27–30. doi:10.1038/nm0195-27.
13. Carmeliet P, Jain RK. Angiogenesis in cancer and other diseases. Nature. (2000). 407:249. doi:10.1038/35025220.
14. Neuschler EI, Butler R, Young CA, Barke LD, Bertrand ML, Bohm-Velez M, et al. A pivotal study of optoacoustic imaging to diagnose benign and malignant breast masses: a new evaluation tool for radiologists. Radiology. (2018). 287(2):398–412.
15. Diot G, Metz S, Noske A, Liapis E, Schroeder B, Ovsepian SV, et al. Multispectral optoacoustic tomography (MSOT) of human breast cancer. Clin Cancer Res. (2017). 23(22):6912–22.
16. Zhou Y, Tripathi SV, Rosman I, Ma J, Hai P, Linette GP, et al. Noninvasive determination of melanoma depth using a handheld photoacoustic probe. J Invest Dermatol. (2017). 137(6):1370–2. doi:10.1016/j.jid.2017.01.016.
17. Neuschmelting V, Burton NC, Lockau H, Urich A, Harmsen S, Ntziachristos V, et al. Performance of a multispectral optoacoustic tomography (MSOT) system equipped with 2D vs. 3D handheld probes for potential clinical translation. Photoacoustics. (2016). 4(1):1–10. doi:10.1016/j.pacs.2015.12.001.
18. Toi M, Asao Y, Matsumoto Y, Sekiguchi H, Yoshikawa A, Takada M, et al. Visualization of tumor-related blood vessels in human breast by photoacoustic imaging system with a hemispherical detector array. Sci Rep. (2017). 7:41970. doi:10.1038/srep41970.
19. Xie Z, Hooi FM, Fowlkes JB, Pinsky RW, Wang X, Carson PL. Combined photoacoustic and acoustic imaging of human breast specimens in the mammographic geometry. Ultrasound Med Biol. (2013). 39(11):2176–84. doi:10.1016/j.ultrasmedbio.2013.05.018.
20. Asao Y, Hashizume Y, Suita T, Nagae K-i, Fukutani K, Sudo Y, et al. Photoacoustic mammography capable of simultaneously acquiring photoacoustic and ultrasound images. J Biomedical Optics. (2016). 21(11):116009. doi:10.1117/1.jbo.21.11.116009.
21. Heijblom M, Piras D, Xia W, van Hespen JCG, Klaase JM, van den Engh FM, et al. Visualizing breast cancer using the Twente photoacoustic mammoscope: what do we learn from twelve new patient measurements? Opt. Express. (2012). 20(11):11582–97. doi:10.1364/oe.20.011582.
22. Nyayapathi N, Takabe K, Xia J, Lim R, Zhang H, Zheng W, et al. Dual scan mammoscope (DSM) - a new portable photoacoustic breast imaging system with scanning in craniocaudal plane. IEEE Trans Biomed Eng. (2019). 67(5):1321–1327. doi:10.1109/tbme.2019.2936088.
23. Tan Y, Xia K, Ren Q, Li C. Three-dimensional photoacoustic imaging via scanning a one dimensional linear unfocused ultrasound array. Opt Express. (2017). 25(7):8022–8.
24. Xu M, Wang LV. Universal back-projection algorithm for photoacoustic computed tomography. (2007). 1539–3755.
25. Li G, Li L, Zhu L, Xia J, Wang LV. Multiview Hilbert transformation for full-view photoacoustic computed tomography using a linear array. J Biomed Opt. (2015). 20(6):066010. doi:10.1117/1.jbo.20.6.066010.
26. Cheong WF, Prahl SA, Welch AJ. A review of the optical properties of biological tissues. IEEE J Quantum Electron. (1990). 26(12):2166–85. doi:10.1109/3.64354.
27. Sandell JL, Zhu TC. A review of in-vivo optical properties of human tissues and its impact on PDT. J Biophot. (2011). 4(11-12):773–87. doi:10.1002/jbio.201100062.
Keywords: photoacoustic imaging, breast imaging, mammography, 3D imaging, synthetic matrix array
Citation: Zhang G, Li W, Yang M and Li C (2020) Developing a Photoacoustic Whole-Breast Imaging System Based on the Synthetic Matrix Array. Front. Phys. 8:600589. doi: 10.3389/fphy.2020.600589
Received: 30 August 2020; Accepted: 19 October 2020;
Published: 20 November 2020.
Edited by:
Chao Tian, University of Science and Technology of China, ChinaReviewed by:
Lei Xi, Southern University of Science and Technology, ChinaCopyright © 2020 Zhang, Li, Yang and Li. This is an open-access article distributed under the terms of the Creative Commons Attribution License (CC BY). The use, distribution or reproduction in other forums is permitted, provided the original author(s) and the copyright owner(s) are credited and that the original publication in this journal is cited, in accordance with accepted academic practice. No use, distribution or reproduction is permitted which does not comply with these terms.
*Correspondence: Changhui Li, Y2hsaUBwa3UuZWR1LmNu
Disclaimer: All claims expressed in this article are solely those of the authors and do not necessarily represent those of their affiliated organizations, or those of the publisher, the editors and the reviewers. Any product that may be evaluated in this article or claim that may be made by its manufacturer is not guaranteed or endorsed by the publisher.
Research integrity at Frontiers
Learn more about the work of our research integrity team to safeguard the quality of each article we publish.