
94% of researchers rate our articles as excellent or good
Learn more about the work of our research integrity team to safeguard the quality of each article we publish.
Find out more
ORIGINAL RESEARCH article
Front. Phys., 12 January 2021
Sec. Social Physics
Volume 8 - 2020 | https://doi.org/10.3389/fphy.2020.581994
This article is part of the Research TopicFrom Physics to Econophysics and Back: Methods and InsightsView all 31 articles
We investigate the effects of syndicated loan network centrality on bank performance. Syndicated loan network centrality measures the similarity and influence of the other banks within a given banks network. The network centrality constructed by syndicated loans can allow banks to gather and transfer valuable information and can thus facilitate profit-making acquisition in loan investment decisions. We use a planar maximally filtered graph to construct an interbank network using syndicated loan portfolios at the industry level. We show that the syndicated loan portfolios of high-centrality banks exhibit a higher level of portfolio diversification than those of low-centrality banks. We also document that our composite centrality measure of the bank network showed statistical significance in terms of bank performance even after controlling for the financial variables of market size, loan allocation, total asset, and loan diversification. Our findings suggest that the performance of a bank in a syndicated loan hierarchy is related to its position in this hierarchy.
The connectivity between banks demonstrates the ways in which the contagious nature of high levels of risk among financial institutions can cause financial crizes and affect future economic conditions [1–4]. The network structure of the interbank market created by the syndicated loan market suggests that connections between banks should be an important channel of contagion among financial institutions [5–7]. Information contagions between banks represent a significant channel that might explain how information travels through financial systems. Recently, the application of complex networks to solve this challenging problem has become increasingly widespread in diverse areas [8–10].
In this paper, we study interbank networks in the form of common exposures among financial institutions to analyze bank performance based on banks’ exposure to large syndicated loans. Syndicated loans represent one of the crucial sources of external financing for many firms and provide an ideal experimental setting for studying the interconnectedness of banks. In this study, the network between banks is constructed from data sets that contain information regarding both the borrowers and lenders of syndicated loans. The common exposures of banks are able to measure bank’s investment strategies in this market in terms of loan portfolio diversification.
Prior research provides evidence that interconnectedness has a considerable impact on the economy from the perspective of risk exposure. Interconnection between companies or industries amplifies and propagates shock within an economy [11]. Negative shock and financial distress contribute to asset fire sales [12]. Consistent with these concepts, credit concentration tends to lead to a cascade effect of shock in an economy [13]. [5] defined market connectedness using banks’ loan specializations in a syndicated loan market that reflected systemic risk. Furthermore, prior studies that have examined the role of diversification have focused on performance. For example, banks with a greater number of geographically-concentrated mortgage loans performed better than others with fewer of these loans [14]. In terms of mergers and acquisitions, diversification is correlated with fluctuations in external market friction [15].
Based on the social exchange theory as proposed by [16]; we present different perspectives to understand the banking industry in the United States; these perspectives recognize the complex and rich social relationships that define interbank network. When the economy is growing, banks actually benefit from promoting the sharing of information with network members for business expansion; as a result of this sharing, they are able increase their profits. Nonetheless, during periods of economic contraction, banks cannot force network members to restructure because they may be subject to strict constraints due to their obligations. Banks are expected to expend effort monitoring and screening their borrowers to mitigate risk exposure. Additionally, bank performance is negatively affected within a contracting economy.
To assess the level of connectedness between the banks of syndicated loan portfolios, we establish a measure of interconnectedness that utilizes the similarity between bank’s syndicated loan portfolios at the industry level as proposed by [5]. An advantage provided by the use of loan portfolios is the ability to investigate the response of banking systems via direct connections. To extract meaningful information from all-to-all connected networks, we employ the planar maximally filtered graph (PMFG) [17]. We utilize centrality measures to drive an important component that may affect whether a bank’s centrality in the interbank network created in the financial sector is related to its performance. In this paper, the centrality is measured by the principal component analysis (PCA) method based on four common measures of centrality in the context of networks: degree, eigenvector, closeness, and betweenness.
To date, only the lending relationship between banks and firms has been studied through analyzing the characteristics of individual banks or firms using corporate loan data. The aim of this paper is to study an interbank network, namely, the syndicated loan market. We investigate the evolution of several types of syndicated loans over time using a Dealscan database, with a special emphasis on the amount of syndicated loans that have been extended. More interestingly, the syndicated loan data used in this study allows us to investigate the effect of the centrality of interbank networks on bank performance.
We show that banks with a higher level of network centrality are more likely to pursue diversification and that this diversification is more likely to increase during market instability. To extend our examination of the relationship between interbank networks and bank performance, we move beyond bank-to-firm lending by studying interbank networks in the context of the syndicated loan market. We further find that banks with a high level of centrality have higher returns than do banks with a low level of centrality. Since a bank’s centrality within the network plays an important role in its loan portfolio strategy, it also plays a significant role for lending market participants. We also found that in the core group, there was a negative correlation between diversification and centrality; however, a positive relation was observed in the peripheral group.
The paper is organized as follows. Section 2 explains the methodology that we employed. Section 3 presents a description of the database used, and Section 4 contains an empirical analysis. Section 5 concludes this paper.
In this section, we explain the network construction and regression variables. For each month, we define an interconnectedness based on the similarities between syndicated loan portfolios. The results are not qualitatively sensitive to bank performance measures, e.g., we obtain essentially the same results even if we use different financial variables to measure bank performance.
In this subsection, we explain the way in which we estimate the distance between two banks based on their loan portfolios. We then describe the way in which we construct an interbank network. To map our interbank network, we obtain information on the relationships between banks and firms between 1990 and 2017 from the DealScan database.
First, we investigate bank syndicated loans in the United.States. lending industry classified using two-digit SIC industry codes. This measure was developed by [5] and uses the Euclidean distance between two banks. For each month, we calculate the distance between bank i and bank k by quantifying the similarity of these two banks in a n-dimensional space as follows.
where
We investigate how network structure affects bank performance using the banks in the United.States. between January 1, 1990 and December 31, 2017. We use the Return on asset (ROA) variable as the dependent variable to measure bank’s performance and employ several financial variables, such as the bank size, an amount of syndicated loan, etc. as control variables to examine network effect on bank’s performance.
In information theory, following [21]; the entropy of a discrete random variable X is denoted as
where
The effect of bank network centrality on bank performance is due to the importance of bank-firm lending structure in the context of information asymmetry. A bank’s network created by bank-to-firm loan information should affect the profit of lending banks. Generally, centrality refers to a bank’s location in a network compared to that of others. The four indices of centrality are frequently discussed in the social network literature [22]. These four indices are degree centrality, eigenvector centrality, closeness centrality, and betweenness centrality. These indices represent different dimensions of connectedness that affect information sharing via a network. Degree centrality is the sum of the first-degree connections of an entity in a network. The raw score is divided by the total number of nodes in the network minus 1, because the size of the interbank network changes each month [23]. Eigenvector centrality measures an individual bank’s ability to obtain or influence information within the network. This measure increases as connections with other highly connected neighbors are added. The raw score is divided by the total number of nodes in the network minus one because the size of the interbank network changes each month. Closeness centrality is the inverse of the mean of the shortest path length between an individual bank and all the other reachable banks in the network. The raw score is multiplied by the total number of nodes in the network minus one because the size of the interbank network changes each month. Betweenness centrality describes the extent to which an individual bank is connected to the other banks in the network. When the shortest path of all bank pairs passes through a bank, the betweenness centrality of that bank is high; this is the reason why it is important to control the flow of the entire network. The raw score is divided by the total number of the connected nodes because the size of the interbank network changes each month.
To generate our composite centrality index (CCI) in Table 1, we standardize the centrality indices to a mean of 0 and a standard deviation of 1. Consistent with [24–26]; we use the factor score to aggregate CCI using the first principal component for each bank with four centrality indices in the PMFG network.
Return on assets (ROA) is an indicator of how well a company generates profit from its total assets. We calculated ROA by dividing firms’ profit or loss before taxes by their total assets in month t and converted this figure to a percentage. The previous studies related to the current research area show that ROA is the best measure of performance when comparing similar companies with the same industry.
To test the hypotheses outlined in Section 1, we construct a sample of syndicated loans matched according to firm and bank characteristics. Below, we describe the sample construction and summarize the sample characteristics.
We build our datasets from a comprehensive sample of syndicated loans and the associated lender and borrower information by merging data derived from Standard & Poor’s Compustat and from Thomson Reuters’ LPC Dealscan from 1990 to 2017. The Compustat database is free of survival bias, as it contains the monthly historical accounting data of borrowing companies, and data regarding syndicated loans are included in the Dealscan database. Our starting points are the DealScan-Compustat Link [27] and the Lender link [28].a
Syndicated loans play a crucial role in the American corporate loan market. These loans are typically offered by a group of lenders. The lenders in a syndicate are large banks that fall into two categories of lenders: lead arrangers and participants. In this study, following the work of [5]; we classify lenders as lender-to-lead arrangers and participants. We designate a lender as a lead arranger if lead arranger credit of it is yes or lender role of it is administrative agent, agent, arranger, book runner, coordinating arranger, lead bank, lead manager, mandated arranger, or mandated lead arranger. We designate a lender as a participant if it is not the lead arranger. We refer to lead arrangers as banks from now on, but we do not refer to participants in this way. Following the literature, we exclude loans made to financial companies (i.e., SIC codes between 6,000 and 6,999) as well as classified companies belonging to the Fama-French 12th industrial classification (i.e., others).b
The use of syndicated loan data allows us to explore the activities of the financial intermediaries in the loan market. Our loan data, with 52,685 facilities and 35,632 packages, comprises a complex structure. After excluding banks with negative total assets, the study sample is composed of banks listed in the United States during the period 1990–2017.
Table 2 summarizes the composition of the sample in terms of diversification, centrality indices, and the control variables described in Section 2.2. The correlation coefficients of the variables are reported at the lead-arranger level. Our sample is consisted of 33,386 matched lead arranger-month sets drawn from U.S. institutions heavily invested in the U.S. syndicated loan market. Diversification (DIV) is highly correlated with the composite centrality index (CCI) (0.62) in Table 2 and Figure 1. In terms of multicollinearity, we control the effect of dummy variables related to 2008–2009 financial crisis in the centrality variables.
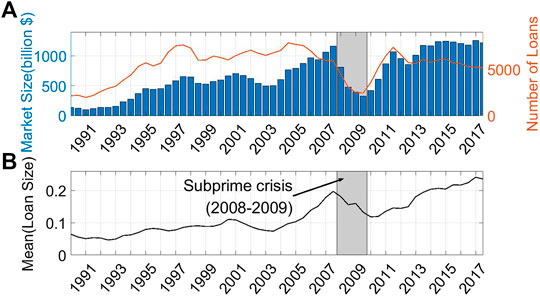
FIGURE 1. This figure is related to the syndicated loan market in the United States from 1990 to 2017. (A) describes market size and the number of loans extended by lead arrangers to borrowers every quarter. Market size is defined as the sum of the loan amounts extended by each bank. The number of loans is defined as the total number of loans extended during each quarter. (B) represents the average loan size, which is the market size divided by the number of loans during each quarter. Gray shadows represent recessions as measured as the subprime morgage crisis periods during 2008-2009.
In this section, we first empirically explore the degree distribution of the PMFG network in the U.S. syndicated loan market. We then examine the ways in which network topology and investment characteristics impact bank performance. We investigate the effect of bank network centrality on bank performance because of the importance of the bank-firm lending structure in terms of information asymmetry. The structure of an interbank network should affect bank performance. Interbank networks, which are created by the degree of information asymmetry during the bank-firm lending process, should affect the performance of lending banks. A bank with a higher level of information asymmetry might mimic the loan portfolio structure of a bank with a lower level of information asymmetry to reduce this asymmetry and generate profits. The systemic risk research has identified network connectivity and centrality as channels that transmit contagions related to negative events [1, 2, 5, 29]. This implies that a highly interconnected structure can increase systemic risk. Ultimately, increased connectivity and rapid propagation in bank-to-bank networks can allow high-centrality banks to address market instability. In summary, we expect that well-connected banks should experience lower levels of information asymmetry than do poorly connected banks and that they should also experience higher levels of market performance.
Since the amount of syndicated loans is related to exposure to assets, a decline in asset prices should affect the stability of the banking system. We analyze syndicated loans issued during each quarter from 1990 to 2017. A visual inspection of the amount of syndicated loans over time suggests that this figure reflects the state of the financial market. Figure 1A shows the amount of syndicated loans as a measure of overall banking loans and the number of syndicated loans. We measure the total amount of syndicated loans in each quarter. First, we find that both the overall amount and the number of syndicated loans follow a similar pattern. The total amount of syndicated loans started to increase in 2003 and continued to rise until Q4 of 2007, finally decreasing in 2009. After the subprime crisis, these loans rapidly increased until 2012. Second, the mean amount of syndicated loans is calculated as follows: Mean (Loan) = Market size/number of loans. Figure 1A shows a pattern similar to that of the results in Figure 1A.
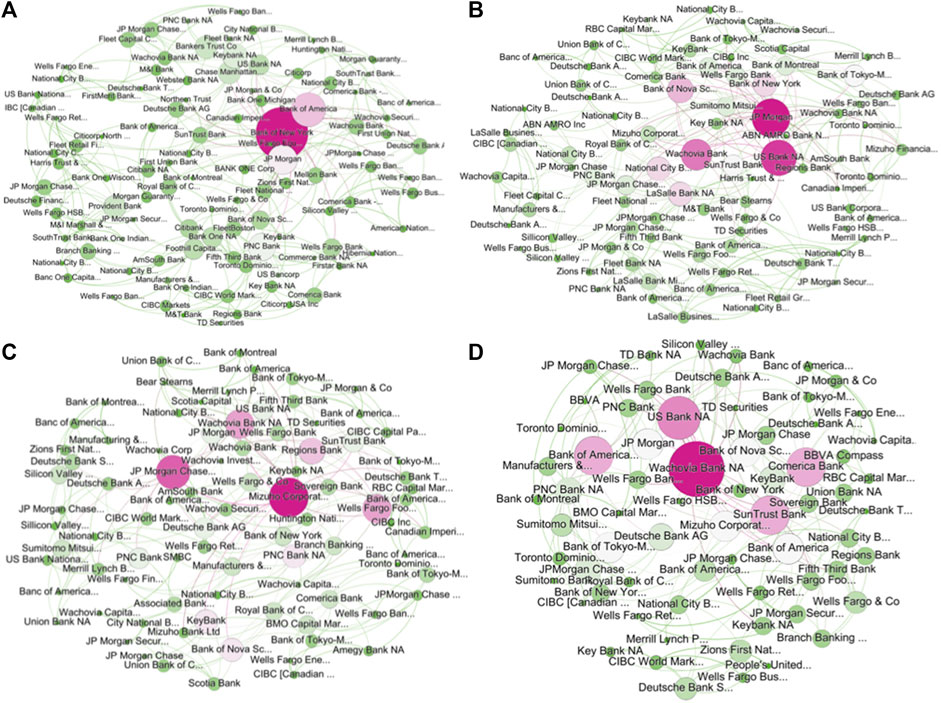
FIGURE 2. PMFG network (A) 2002 (B) 2006 (C) 2008 (D) 2010. The nodes represent each bank, and the node size is determined by the corresponding bank's degree centrality. A node with a higher degree centrality is colored pink and one with a lower degree centrality is colored light green.
The main goal of this paper is to conduct more rigorous tests on the relationship between the interconnectivity of banks and bank performance. To test the validity of our hypothesis, we construct an interbank network using the PMFG method developed by [17] based on loan portfolio data in Figure 2. In January 2002 (2006), this interbank network for the normal market status consisted of 513 (428) connections and 105 (88) nodes. The interbank network during and after the financial market crisis consisted of 423 (328) connections and 87 (68) nodes in January 2008 (2010). If the loan portfolio of each bank tended to have a distinct and unique investment strategy, then the interbank network would be disconnected, and each bank would correspond to a random network. We construct interbank networks for normal and abnormal periods based on the banks’ loan portfolio structures to test whether the characteristics of the network are related to the market status. The obtained interbank network, shown in Figure 2 A–D, displays the banks with higher connections between banks, regardless of market status, suggesting that the syndicated loan portfolios of banks are shared with other banks.
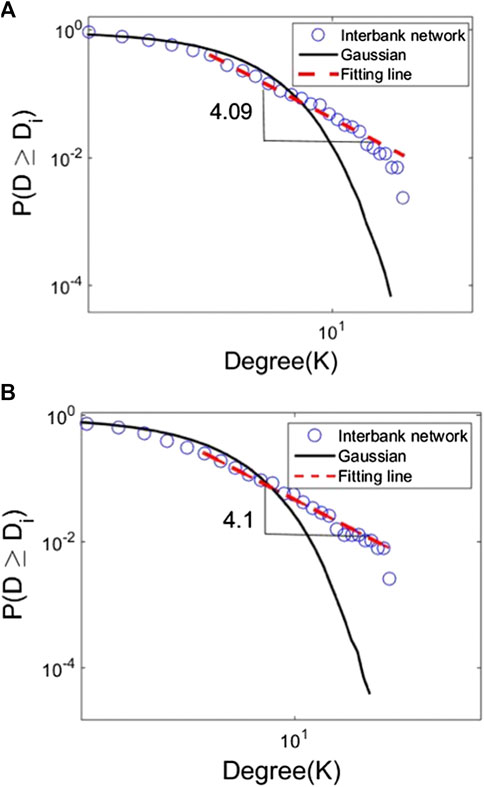
FIGURE 3. The CDF for the degree of the interbank network is plotted with a double logarithmic scale. The cumulative distribution function for the degree of network during four years (A) from 2006 to 2009 and (B) from 2010 to 2013, the Gaussian distribution, and the fitted line are denoted using dotted blue lines, a black line, and dashed red lines, respectively.
The degree (k) distribution of the interbank network indicates that most of the banks are linked to a few other banks, whereas a few banks with a large amount of capital are connected to many individual banks. As shown in Figure 3, the degree distribution in 2006 (2010) follows the power-law distribution with an exponent of 4.09 (4.1). Consistent with [30, 31]; Table 3 compiles the results of the likelihood ratio test and includes judgments supported by statistical methods for the power-law hypothesis for each distribution over four years. We find that the degree distributions follow a power-law when comparing to exponential, stretched exponential, power law with cutoff, and log normal distributions. The power-law exponents of degree distributions of PMFG network are in the range 3.49 and 4.43. As a result, we think that there are the influential banks with a lot of connections in the interbank network.
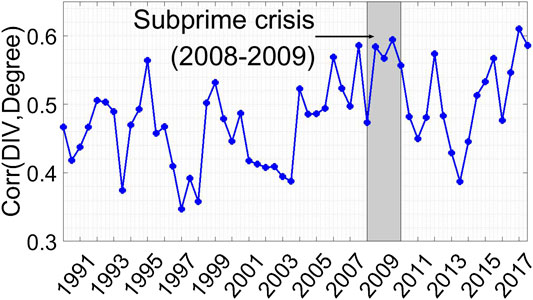
FIGURE 4. This figure shows the correlation between diversification (DIV) and the degree of the PMFG network during the sample period of six months. Gray shadows represent recessions as measured as the subprime mortgage crisis periods during 2008-2009.
The diversification of loan portfolios has important implications of the role that banks’ investment strategies play in the syndicated loan market. Is this loan portfolio strategy, i.e., the diversification of syndicated loans at the industry level, related to the interbank network? We estimate the correlation between the diversification of portfolios and network structure to test whether the investment strategy of a bank is related to the other banks in the network. Figure 4 shows the correlation between diversification and the degree of network centrality for each year. Overall, there is a positive correlation between diversification and degree of centrality, regardless of the subperiod observed. In particular, the correlation value starts to increase in 2002 and continues to rise until 2007 before the subprime crisis; after this, it decreases in 2011, suggesting that the correlation between the loan portfolio strategies of banks and the centrality of the network connectivity among banks should be understood as indicators of the financial crisis.
To observe the relationship between the degree of network centrality and portfolio strategies, we divided the whole sample into three groups according to centrality: G (high), G (middle), and G (low). Figure 5 displays the distribution function of these three groups using box plots and calculates the similarity of each distribution function using the Kolmogorov-Smirnov test (K-S test) [32]. The results are reported in Table 3. In addition, we calculate the average diversification of the three groups over time. Figure 6 shows the time evolution of the average diversification of these three groups defined according to their degrees of network centrality from January 1990 to December 2017. The diversification of the three groups is calculated based on the loan portfolios using the entropy method. The red circles, blue diamonds, and black triangles indicate the high-, middle-, and low-centrality groups, respectively. As shown in Figure 6, we find that since 2004, the diversification levels of low-centrality groups have moved more volatile than high-centrality groups.
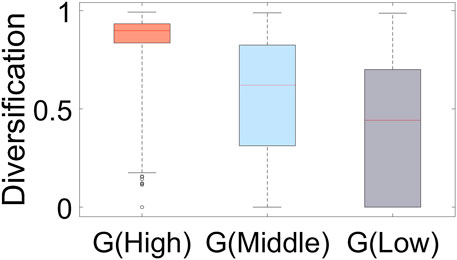
FIGURE 5. We divide banks into three groups: high, middle, and low-centrality. The banks corresponding to the highest (lowest) 10% in terms of degree centrality are designated as the core (peripheral) of banks in this paper. The core banks have higher levels of diversification than middle and low-centrality groups.
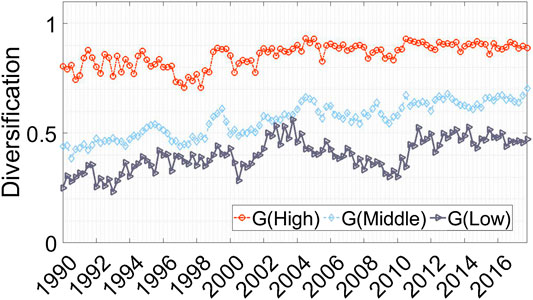
FIGURE 6. Time series of diversification of three groups according to their degree centrality. This figure shows the time series of the monthly diversification of syndicated loan portfolios from January 1990 to December 2017. The diversification of the three groups is computed by using the entropy method based on their loan portfolios. We divided sample into three groups. The red circles, blue diamonds, and black triangles indicate the high, middle, and low-centrality groups, respectively.
To the extent that interbank networks in the United States have heterogeneous characteristics, we suggest that the strategic behaviors of banks and the central characteristics of banks have impacts on performance. We focus on two properties of banks: structural properties and strategic properties. We use the four measures of centrality as structural properties in the PMFG network. The relationships between lenders and borrowers are likely to mitigate the problem of information asymmetry because lending banks collect a considerable amount of information about the corporate management of their borrowers and have stable and long-term relationships with the managers of these organizations [33]. Sometimes, banks place their directors on borrower’s boards of directors to improve the quantity and quality of information regarding operations that they receive [25]. We found that capitalized banks tend to centralize their networks. Therefore, we assume that banks with a high level of centrality in their networks have the unique abilities of quickly obtaining resources through the members of their network and of reducing the level of information asymmetry between lenders and borrowers.
Based on our assumption, centralized banks would feel more secure when expanding their business. In this context, we would expect to see that these banks hold portfolios that are more diverse. Diversification in the syndicated loan market creates the potential advantage of reducing credit risk exposure [5]. Banks become more resilient to common shocks such as exposure to risk when holding diversified portfolios. We estimate the following regression with pooled data:
where the dependent variable
By including the variables market size, market share, and bank size in this regression, we control for the systematic and idiosyncratic effects that we cannot directly observe. Market share is measured by the natural logarithm of the amount of outstanding loans held by each bank [34]. use that as a proxy for a lead arranger’s reputation in terms of market participants’ perceptions of its screening and monitoring of borrowers. We control for market share to identify the effects of banks’ reputations. Market size is calculated as the natural logarithm of the sum of the loan amounts of newly originated syndicated loans in billions of United States. dollars. Controlling high performance of bank with higher asset, bank size is estimated by the natural logarithm of total assets of each bank. In all regressions, we include market size and year fixed effects to remove the time characteristics.
We report the results related to diversification and four centrality measures of the interbank networks. In all models, the regression coefficients of the measures of diversification are statistically highly significant, and they indicate a positive relationship
Next, we estabilish dummy variable with centrality indices to exclude the financial crisis effect in 2008–2009. They are statistically significant with negative coefficients of
In this section, we examine the different ways in which the structural importance of the PMFG network affects bank’s strategic actions. We also consider the way in which the relationship between strategic actions and relative profitability identified in the full sample may vary based on banks’ degree of centrality. Several papers have highlighted the likelihood that board interlocking between banks has more power and information in the market when they reduce financial risk [22, 34, 36, 37]. Because the importance of each bank in the network is not homogeneous, we group the banks by their degrees centrality into groups consisting of core banks and of peripheral banks. We designated the upper (lower) 10% of banks in terms of degree centrality as high (low) groups to define the cores and peripheral in the PMFG network. Table 5 represents the Pearson correlation of diversification between each subset of banks. The high- and middle-centrality groups have positive correlations (0.7906), and the low-centrality groups also have positive correlations with the other groups
Table 6 shows the results of the linear regressions regarding bank diversification using the same explanatory variables we used for the subset of banks. These results indicate that core banks could obtain better private information than peripheral banks. This result is consistent with the study of [14]; who insist that concentrated lenders had higher profits than diversified lenders during the financial crisis. Additionally [38], find that the diversification of bank assets is not guaranteed to produce superior return performances or greater safety for banks. These findings are different from the comprehensive perspectives of the market power view and the resource view in terms of profit maximization. Note, however, that these studies do not control for network centrality. Consistent with the systemic risk literature [5], we consider core banks to have high levels of risk exposure, and concentrated lenders have high levels of performance during our sample periods
Banks that are centrally located in a syndicated loan network have access to better information and more influence in the syndicated loan market. Adding to the previous studies on the role of network centrality among banks, we employ a network centrality measure to test the connection between bank performance and network structure. In terms of the diversification of loan portfolios, we show that banks with higher levels of network centrality are more likely to pursue diversification, and that this diversification is more likely to increase during periods of market instability. The evidence shows that sample banks’ lending strategies exhibited a significant relationship with these banks’ degrees of network centrality, regardless of the market status. We further find that banks with a high level of centrality have higher returns than banks with a low level of centrality. We then test whether the diversification of the syndicated loan portfolios of individual banks is related to the performance of these banks according to their centrality position in the interbank network. Since a bank’s centrality in the network plays an important role in its loan portfolio strategy, this centrality also plays a significant role for lending market participants. We found that in the core group, diversification showed a negative correlation with centrality; however, a positive relation was observed in the peripheral group.
We contribute to the literature on the bank-firm lending process in the field of finance by introducing the interbank network based on the syndicated loan market. Our findings extend the existing literature on the lending mechanisms between banks and firms and show that banks’ centrality within the interbank network influences their portfolios in the syndicated loan market. Future studies can help to shed light on bank performance and lending mechanisms.
The raw data supporting the conclusions of this article will be made available by the authors, without undue reservation.
All authors listed have made a substantial, direct, and intellectual contribution to the work and approved it for publication.
This work has been supported by NRF (National Research Foundation of Korea) Grant funded by the Korean Government (NRF-2017R1A2B4009349).
The authors declare that the research was conducted in the absence of any commercial or financial relationships that could be construed as a potential conflict of interest.
aThe lenders in our sample have at least
bWe downloaded the 12 classification data at Fama-French website (http://mba.tuck.dartmouth.edu/pages/faculty/ken.french/index.html).
1. Battiston S, Puliga M, Kaushik R, Tasca P, Caldarelli G. Debtrank: too central to fail? financial networks, the fed and systemic risk. Sci Rep (2012) 2:541. doi:10.1038/srep00541
2. Demirer M, Diebold FX, Liu L, Yilmaz K. Estimating global bank network connectedness. J Appl Econom (2018) 33:1–15. doi:10.1002/jae.2585
3. Corsi F, Lillo F, Pirino D, Trapin L. Measuring the propagation of financial distress with granger-causality tail risk networks. J Financ Stabil (2018) 38:18–36. doi:10.1016/j.jfs.2018.06.003
4. Acharya VV, Pedersen LH, Philippon T, Richardson M. Measuring systemic risk. Rev Financ Stud (2017) 30:2–47. doi:10.1093/rfs/hhw088
5. Cai J, Eidam F, Saunders A, Steffen S. Syndication, interconnectedness, and systemic risk. J Financ Stabil (2018) 34:105–20. doi:10.1016/j.jfs.2017.12.005
6. Ivashina V, Scharfstein D. Bank lending during the financial crisis of 2008. J Financ Econ (2010) 97:319–38. doi:10.2139/ssrn.1297337
7. Fahlenbrach R, Prilmeier R, Stulz RM. This time is the same: using bank performance in 1998 to explain bank performance during the recent financial crisis. J Finance (2012) 67:2139–85. doi:10.3386/w17038
8. Rajpal H, Rosas F, Jensen HJ. Tangled worldview model of opinion dynamics. Frontiers in Physics (2019) 7:163. doi:10.3389/fphy.2019.00163
9. Tomassini M, Antonioni A. Public goods games on coevolving social network models. FrP (2020) 8:58. doi:10.1063/1.4991679
10. Wen S, Tan Y, Li M, Deng Y, Huang C. Analysis of global remittance based on complex networks. Front Phys (2020) 8:85. doi:10.3389/fphy.2020.00085
11. Acemoglu D, Carvalho VM, Ozdaglar A, Tahbaz-Salehi A. The network origins of aggregate fluctuations. Econometrica (2012) 80:1977–2016. doi:10.3982/ECTA9623
12. Shleifer A, Vishny R. Fire sales in finance and macroeconomics. J Econ Perspect (2011) 25:29–48. doi:10.1257/jep.25.1.29
13. Cont R, Moussa A, Santos EB. (2010). Network structure and systemic risk in banking systems. Available at SSRN: https://ssrn.com/abstract=1733528 (Accessed December 1 2010).
14. Loutskina E, Strahan PE. Informed and uninformed investment in housing: the downside of diversification. Rev Financ Stud (2011) 24:1447–80. doi:10.1093/rfs/hhq142
15. Matvos G, Seru A, Silva RC. Financial market frictions and diversification. J Financ Econ (2018) 127:21–50. doi:10.1016/j.jfineco.2017.09.006
16. Blau P. Exchange and power in social life (Routledge). London and New York: Taylor & Francis (2017). p. 372.
17. Tumminello M, Aste T, Di Matteo T, Mantegna RN. A tool for filtering information in complex systems. Proc Natl Acad Sci USA (2005) 102:10421–6. doi:10.1073/pnas.0500298102
18. Onnela J-P, Kaski K, Kertész J. Clustering and information in correlation based financial networks. Eur Phys J B (2004) 38:353–62. doi:10.1140/epjb/e2004-00128-7
19. Chi KT, Liu J, Lau FC. A network perspective of the stock market. J Empir Finance (2010) 17:659–67. doi:10.1016/j.jempfin.2010.04.008
20. Onnela JP, Chakraborti A, Kaski K, Kertész J, Kanto A. Dynamics of market correlations: taxonomy and portfolio analysis. Phys Rev E–Stat Nonlinear Soft Matter Phys (2003) 68, 056110. doi:10.1103/PhysRevE.68.056110
21. Shannon CE. A mathematical theory of communication. Bell Sys Tech J (1948) 27:379–423. doi:10.1002/j.1538-7305.1948.tb01338.x
22. Newman ME. The structure and function of complex networks. SIAM Review (2003) 45:167–256. doi:10.1137/S003614450342480
23. Wasserman S, Faust K. Social network analysis: methods and applications, Vol. 8. Cambridge, United Kingdom: Cambridge University Press (1994). p. 825.
24. Omer TC, Shelley MK, Tice FM. Do well-connected directors affect firm value?. J Appl Finance (2014) 24:17–32. doi:10.2139/ssrn.2167354
25. Omer TC, Shelley MK, Tice FM. Do director networks matter for financial reporting quality? Evidence from audit committee connectedness and restatements. Manag Sci (2019) 66:3361–88. doi:10.1287/mnsc.2019.3331
26. Larcker DF, So EC, Wang CC. Boardroom centrality and firm performance. J Account Econ (2013) 55:225–50. doi:10.1016/j.jbankfin.2018.11.002
27. Chava S, Roberts MR. How does financing impact investment? the role of debt covenants. J Finance (2008) 63:2085–121. doi:10.1111/j.1540-6261.2008.01391.x
28. Schwert M. Bank capital and lending relationships. J Finance (2018) 73:787–830. doi:10.1111/jofi.12604
29. Elliott M, Golub B, Jackson MO. Financial networks and contagion. Am Econ Rev (2014) 104:3115–53. 10.1257/aer.104.10.3115
30. Clauset A, Shalizi CR, Newman ME. Power-law distributions in empirical data. SIAM Review (2009) 51:661–703. doi:10.1137/070710111
31. Virkar Y, Clauset A. Power-law distributions in binned empirical data. Ann Appl Stat (2014) 89–119. doi:10.1214/13-AOAS710
32. Chakravarti I, Laha R, Roy J. Kolmogorov-smirnov (ks) test. Handbook Methods Appli Statis (1967) 1:392–4.
33. Sufi A. Information asymmetry and financing arrangements: evidence from syndicated loans. J Finance (2007) 62:629–68. doi:10.1111/j.1540-6261.2007.01219.x
34. Gopalan R, Nanda V, Yerramilli V. Does poor performance damage the reputation of financial intermediaries? Evidence from the loan syndication market. J Finance (2011) 66:2083–120. 10.2307/41305185
35. Hitt MA, Hoskisson RE, Kim H. International diversification: effects on innovation and firm performance in product-diversified firms. Acad Manag J (1997) 40:767–98. doi:10.5465/256948
36. Mariolis P. Interlocking directorates and control of corporations: the theory of bank control. Soc Sci Q (1975) 425–39.
37. Berger AN, Kick T, Schaeck K. Executive board composition and bank risk taking. J Corp Finance (2014) 28:48–65. doi:10.1016/j.jcorpfin.2013.11.006
Keywords: performance, connectedness, diversificiation, planar maximally filtered graph network, bank network, syndicated loan market
Citation: Oh G and Park A-y (2021) Lending Diversification and Interconnectedness of the Syndicated Loan Market. Front. Phys. 8:581994. doi: 10.3389/fphy.2020.581994
Received: 10 July 2020; Accepted: 29 October 2020;
Published: 12 January 2021.
Edited by:
Haroldo V. Ribeiro, State University of Maringá, BrazilReviewed by:
Satyam Mukherjee, Indian Institute of Management Udaipur, IndiaCopyright © 2021 Oh and Park. This is an open-access article distributed under the terms of the Creative Commons Attribution License (CC BY). The use, distribution or reproduction in other forums is permitted, provided the original author(s) and the copyright owner(s) are credited and that the original publication in this journal is cited, in accordance with accepted academic practice. No use, distribution or reproduction is permitted which does not comply with these terms.
*Correspondence: A-young Park, YXlwcGFya0BnbWFpbC5jb20=
Disclaimer: All claims expressed in this article are solely those of the authors and do not necessarily represent those of their affiliated organizations, or those of the publisher, the editors and the reviewers. Any product that may be evaluated in this article or claim that may be made by its manufacturer is not guaranteed or endorsed by the publisher.
Research integrity at Frontiers

Learn more about the work of our research integrity team to safeguard the quality of each article we publish.