 Declan J. Armstrong1*
 Timo A. Nieminen1
 Itia Favre-Bulle1,2
 Alexander B. Stilgoe1Isaac C. D. Lenton1
 Mark A. Schembri3
 Halina Rubinsztein-Dunlop1
- 1School of Mathematics and Physics, The University of Queensland, Brisbane, QLD, Australia
- 2The Queensland Brain Institute, The University of Queensland, St Lucia, QLD, Australia
- 3School of Chemistry and Molecular Biosciences, The University of Queensland, Brisbane, QLD, Australia
Escherichia coli and many other bacteria swim through media with the use of flagella, which are deformable helical propellers. When the viscosity of media is increased, a peculiar phenomenon can be observed in which the organism's motility appears to improve. This improvement in the cell's swimming speed has previously been explained by modified versions of resistive force theory (RFT) which accounts for the interaction between flagella and molecules associated with the viscosity increase. Using optical tweezers, we measure the swimming force of individual E. coli in solutions of varying viscosity. By using probe-free force measurements, we are able to quantitatively validate and compare RFT and proposed modifications to the theory. We find that the force produced by the flagellum remains relatively constant even when the viscosity of the medium increases by approximately two orders of magnitude, contrary to predictions of RFT and variants. We conclude that the observed swimming forces can be explained by allowing the flagella geometry to deform as the viscosity of the surrounding medium is increased.
1. Introduction
The swimming dynamics of single cell microorganisms is a fascinating topic that has been intensely studied since they were first observed with the aid of a microscope in the Eighteenth century [1]. These microorganisms are found in fluids where environmental conditions differ drastically from what would typically be experienced by multicellular organisms. In these fluids, inertial effects are negligible and swimming is achieved by rotating helical filaments called flagella. There are several models describing this method of propulsion that elucidate the swimming dynamics and predict properties such as swimming speeds, thrust and drag forces experienced by an organism [2–5]. These models vary drastically in degrees of complexity, although all have the same goal: to provide a mathematical description of biohydrodynamics that accurately replicates the experimentally observed motion of single cell organisms in fluids. These swimming dynamics have important biomedical ramifications since bacteria encounter fluids of varying viscosity during host infection. One process which is not predicted by the aforementioned models is an apparent increase in bacterial motility with increasing viscosity of the media. Observation of this increase in free swimming speed was first made in 1960, [6], and remains a topic of continued investigation [7–10]. This peculiar phenomenon, in which the free swimming speeds of biological swimmers is enhanced by increasing the viscosity of the medium, is counter-intuitive as in most systems an increase in viscosity will tend to hinder a particle's swimming capacity. There is substantial interest in modeling this behavior, as it would provide a better understanding of the movement of pathogenic bacteria, which encounter many different complex fluids during infection.
One of the most successful and commonly used approaches to describe swimming through low Reynolds number fluids is resistive force theory (RFT), [11]. This theory studies fluid motion governed by Stokes flow by calculating the resistance to propulsive motion that a flagellated cell will experience. Modifications to this treatment have been proposed to explain the measured increase in free swimming speeds with increasing viscosity. A mathematical explanation of the process has been proposed by Berg and Turner [9], and modeled by Magariyama and Kudo [12] (hereby referred to as mRFT). The predicted change in free swimming speed with viscosity, as predicted by RFT and mRFT, is shown in Figure 1. mRFT has since been used to produce simulations of bacterial swimming through macromolecular polymer solutions [7], which shows promising results to the velocity problem. This modification to RFT decomposes the forces experienced by bacterial flagella into parallel and perpendicular components. These two components experience viscosities which may differ from the surrounding medium. The effect arises because chemicals used to increase the viscosity of a fluid, such as polyvinylpyrrolidone (PVP), consist of long polymer chains. The cell body will move through a medium of high viscosity, interacting with these polymer chains, while flagella rotation will push these chains away from the filament surface. This interaction causes a virtual tube to form around the helix, which is devoid of polymers and hence the fluid within this region is less viscous. The motility increase has been quantitatively observed previously in terms of a cell's swimming speed with promising results for these shear thinning and slip velocity models. Indeed, Martinez et al. [10] found that modifying the type of polymer used to induce viscous changes can eliminate the initial increase in free swimming speeds. Despite these interpretations, it is unclear if this slip-viscosity model is the only effect that contributes to an increase in bacterial motility when the viscosity of the liquid surrounding it is increased. While the changes in swimming speeds have been investigated, the associated changes in swimming force provided by a cells flagella have not been determined previously.
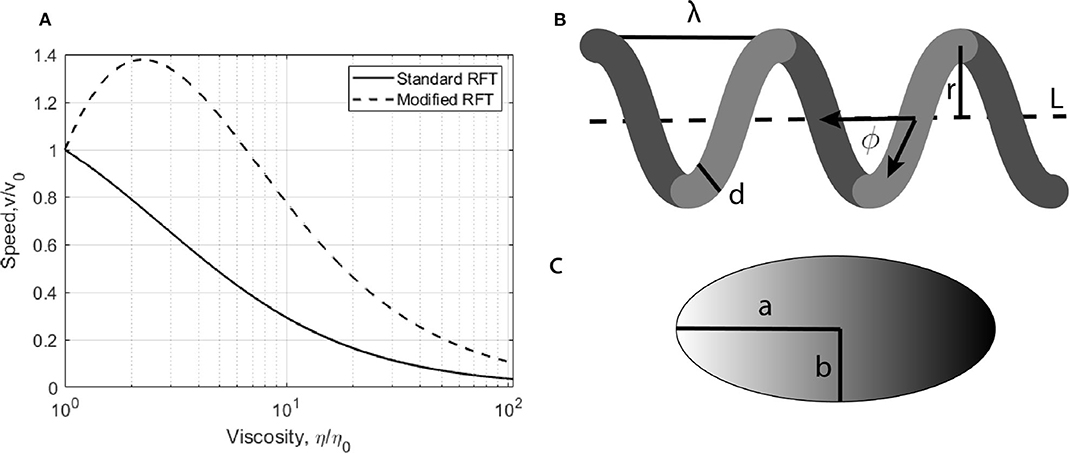
Figure 1. (A) Predicted changes in free swimming speeds as viscosity is increased calculated using standard and modified RFT. (B,C) Typical geometry of an E. coli. The body is modeled as a ellipsoid of major axis a and semi major axis b. Its propulsive helical filament, the flagella, is modeled as a helix of pitch length λ, radius r, width d, pitch angle ϕ, and length L.
Here, we carry out a direct measurement of the motility force of individual cells in media with different viscosities in order to provide new and complementary experimental data to test the validity of the mRFT model. Our method of force measurement is done using optical tweezers, which have been used extensively to study biological systems since their introduction in 1986, [13]. Optical tweezers can be used to trap cells directly without attaching probe particles or markers which might otherwise change the dynamics of the cell. By using optical tweezers in conjunction with position sensitive detectors (PSDs) or quadrant photodiodes (QPDs), the optical force and consequently the cell motility force can be directly measured, [14, 15].
Our measurements show that the variation in swimming force does not follow the predictions made by mRFT, leading us to consider how changes in the flagellar geometry might cause the observed behavior. This treatment of bacterial swimming expands on previous theories to explain the increases in free swimming speeds, which do not account for changes in flagella geometry. The flagella, used by E. coli for swimming, are long flexible tubes approximately 7 μm in length when uncoiled, 6 μm when coiled, approximately 20 nm in diameter [16], and are constructed via a process involving the self-assembly of flagellin proteins. E. coli typically produce a single flagellum located near the pole of the cell and attached to the body by a stator motor which drives the rotation. For many strains of E. coli multiple flagella can be present and rotate in combination as a single helical unit of right-handed chirality.
2. Methods
2.1. Apparatus
We used an optical tweezers setup to trap cells and carry out three-dimensional direct force measurements. This setup and the force measurement technique have been described in detail [14]. Here we provide a brief summary. The apparatus uses a 1, 064 nm fiber laser (YLR-10-1064-LP, 10W, IPG Photonics). The beam is expanded with two lenses that fill the back aperture of a water immersion microscope objective (Olympus UPlanSApo 60×, 1.2NA). The optical trap forms within two microscope coverslips separated by double-sided tape (~0.2 mm thick), the position of which can be controlled in three dimensions by a motorized piezo-stage (PI P-563.3CD). Light is collected by a condenser and directed to a three-dimensional force detection apparatus. Force measurements in the focal plane are obtained using a position sensitive detector (PSD) (On-track PSM2-10 with OT-301DL amplifier) with an operating bandwidth of 15 kHz. Axial measurements are obtained using position sensitive mask detection, utilizing a digital micromirror device, (Texas Instruments, LightCrafter DLPLCR4500EVM) and a balanced photodetector, (PDB210A/M, 1 MHz, Thorlabs). The optically trapped particle can be imaged by overhead illumination and a CMOS camera (Mikrotron MC1362, 1, 280 x 1, 024) with a typical operating frame rate of 5 kFPS. A diagram of this experimental setup is shown in Figure 2A. Radial force measurements are found by measuring the voltage difference at the PSD, given by, FN = CN/VVPSD, where FN is the force in Newtons, CN/V is a numerical factor to convert from voltage to Newtons, and VPSD is the voltage measured at the detector. The linear relationship shown in Figure 2B is used to confirm position-force measurements are synchronized and that the force varies linearly with displacement from the center of the optical trap.
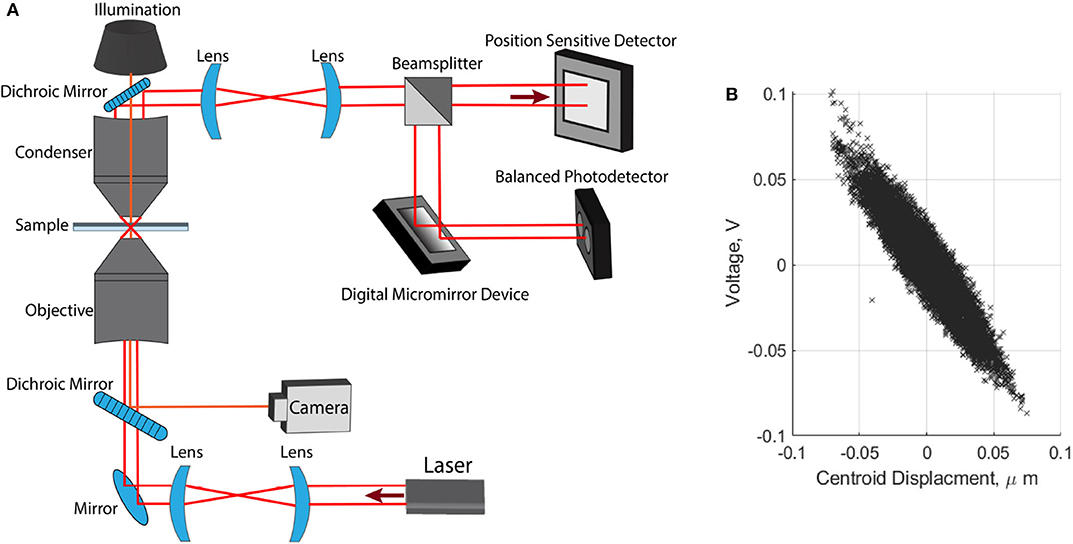
Figure 2. Optical tweezer apparatus. (A) Layout of optical tweezer setup used for trapping and three dimensional direct force detection. (B) Synchronous position-voltage measurements, used to confirm linearity of our optical trap.
2.2. Controlling Viscosity With PVP
Force measurements on E. coli were carried out in a range of fluids with a known viscosity, controlled by the addition of polyvinylpyrrolidone (PVP) to motility buffer consisting of potassium phosphate, EDTA and KCI. In the absence of PVP, the motility buffer has the same viscous value to that of water at 25°C. The viscosity of these solutions depend on the molecular weight of PVP, [17], and is extrapolated from values in literature [18]; provide the viscosity of PVP in aqueous solutions as a function of concentration as measured with a capillary viscometer at 25°C. PVP used in these experiments has an average molecular weight of 1, 300, 000 g/mol. The molecular weight determines the K-value, where PVP with a molecular weight range of 1, 000, 000−1, 500, 000 g/mol correspond to a K-value range of 81 − 94, [18]. The viscosity of an aqueous solution increases exponentially with the addition of PVP [19], fitting to literature values for PVP with an appropriate K-value yields an expression for viscosity as a function of concentration.
Force measurements are carried out in 9 solutions, produced by adding 0.02–0.16 g of PVP to 20 ml of motility buffer, corresponding to concentrations of 0−8 g/l. The viscosity of these solutions range from 1.0 mPas, when no PVP is added, to 190 mPas when 8 g/l of PVP is dissolved in the solution. The literature values and concentrations used to generate this model have been provided in Supplementary Figure 1.
2.3. Determining Optical Forces
Forces produced by optically trapped cells are determined by carrying out direct force measurements. This is the process of determining a force through the deflection of the forward-scattered light used to trap a particle [20, 21]. Optical trapping of cells can be described through ray optics by observing the difference in refractive index between the particle and the medium it resides in. The optical trap can be well-approximated as harmonic, such that when a particle moves from the center of the trap, this will cause a deflection of the trapping beam corresponding to a transfer of momentum between the beam and the particle. This deflection will direct a particle back toward the center of the optical trap. Through Abbe's sine condition [22], a change in the position of the beam's center of mass, which is tracked by a suitable detector, will correspond to a well-defined deflection angle which is used to determine the force a particle is experiencing. Force measurements in the focal plane are carried out using a PSD, and measurements in the axial direction are obtained with a balanced photodiode detector, following the methods detailed in [14].
A change in the trapping beam's position results in a voltage difference across the two dimensional PSD. Finding the force exerted by a particle is then a matter of finding the voltage-to-force conversion factor. This factor is found through absolute calibration of the detector [21], which can be used for arbitrarily shaped particles. Such a property is particularly convenient for biological particles whose size and shape can vary substantially between samples, even from the same culture.
3. Results
We use resistive force theory to estimate the way in which the forces produced by a static helical filament should change as a function of viscosity. The torque acting on the flagella (Nf) and the propulsive thrust force generated by the filament (Ff) are given by Chattopadhyay et al. [23],
v is the velocity of the cell relative to the fluid, ω is the flagella rotation rate and A, B, D are elements of the resistance matrix, given by Chattopadhyay et al. [23],
Where β = cos2ϕ, ϕ is the helix pitch angle, Kn, Kt are normal and tangential viscous coefficients and γk is the ratio, Kt/Kn ≈ 0.7 [24].
When an cell held in an optical trap it is stationary with respect to the surrounding fluid. When the cells flagella is active, the cell will move from the equilibrium center of the optical trap such that the thrust is balanced by the strength of the optical trap, Ff = −k(r − r0), where k is the trap stiffness and r, r0 represent the instantaneous and equilibrium positions of the particle.
When the cells propulsive motion is balanced by the optical trap, v = 0 and hence, Fthrust = −Bω. We are interested in predicting how the propulsive force varies with viscosity. From here, we utilize the results from [12] to incorporate the viscosities seen by normal and tangential motion of the flagella. The predicted flagella rotation frequency is given by,
Where K0 is a drag coefficient given by,
αc and βc are drag coefficients describing the cell body, while αf, βf, and γf are the drag coefficients for the flagellum, derived by Magariyama and Kudo [12]. The asterisk (*) denotes drag coefficients used for mRFT.
The modified drag coefficients, indicated by an asterisk (*), are modifications to the standard resistive force theory results which solve the observed phenomenon of increased free swimming speed of bacteria in polymer solutions. Given the geometry presented in Table 1, we can predict changes in the flagellum rotation rates and subsequent thrust (Ff = −Bω) generated by the flagellum.
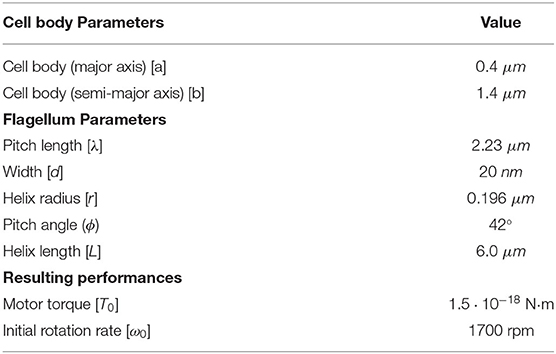
Table 1. Cell and flagellum properties used in resistive force theory (RFT) and modified resistive force theory (mRFT) to calculate cell motion.
3.1. Isolating Swimming Force Measurements
Most E. coli have several flagella, which move as one effective propulsive filament. The cells used in the current experiments (strain MC3400) have 1 (motile) or 0 (non-motile) flagella and undergo periods of both swimming and tumbling. This means that an optically trapped motile cell will be under the influence of swimming (Fswim), thermal (FBrown) and drag forces (Fdrag), such that FPSD = −Fswim − Fdrag − FBrown. Where FPSD is the force measured at the detector. To determine the swimming force produced by a single cell, Fswim must be isolated from the measurements. The drag forces can be neglected when the propulsive force generated by the cell's flagellum is balanced by the restoring force of the optical trap. When this condition is met, the cell is approximately stationary, and contributions from the drag force can be neglected. The contribution due to thermal forces can be eliminated from the measurements by subtracting the average force produced by the cell when it is in a non-motile state. This state can be determined either by measurements on dead cells or cells undergoing periods of tumbling. Eliminating the force contributions from drag and thermal motion means that Fswim ≈ −FPSD. Periods of swimming are determined by monitoring the change in centroid position of the cell. The center of the optical trap is determined by holding a non-motile particle which is only moving under the influence of Brownian motion and taking the mean position of the particle at the trap center. When a swimming E. coli is trapped and the position and forces are being recorded, only force readings taken when the cell is near the edge of the optical trap contribute toward the measured swimming force. The frames in which the particle centroid is at a maximal displacement from the trap center are stored and the synchronous force recordings from the PSD are selected.
We have used the aforementioned method to extract thrust measurements for cells in 9 solutions of known viscosity consisting of PVP and motility buffer using the technique described in section 3.1. The variation in swimming force is presented alongside the RFT and mRFT thrust predictions in Figure 3. From these results it is clear that, in general, the swimming force does not vary substantially with viscosity.
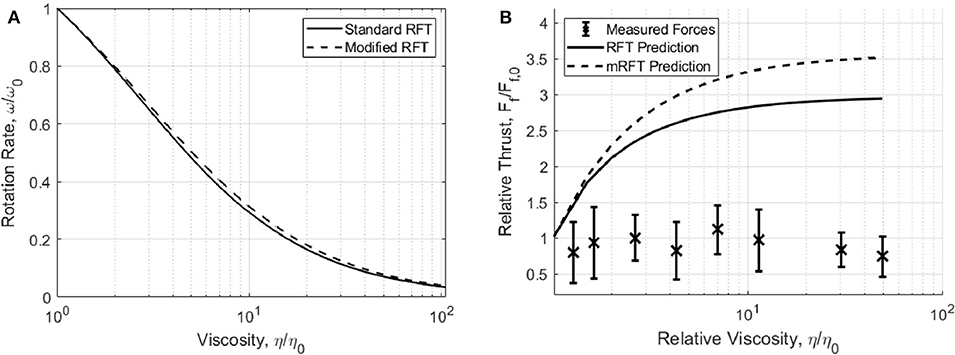
Figure 3. (A) Change in flagellum rotation rate, as predicted by RFT and mRFT, using parameters from Table 1. (B) Measured swimming forces (F = BωRFT/mRFT)with increasing viscosity. Experimental measurements are compared to propulsive force predictions made by RFT and mRFT. Error bars show one standard deviation of force measurements.
4. Discussion
We used optical tweezers to trap and carry out direct force measurements on E. coli in viscous solutions and found that the measured swimming force does not follow the trend predicted by mRFT, despite the success of mRFT in explaining changes in free swimming speeds. The viscosity of the medium was determined through microrheology, and the swimming forces exerted by individual cells were determined using 3D direct force measurements. We found that the swimming force of E. coli did not vary substantially, even under a change in viscosity close to two orders of magnitude.
For highly viscous fluids, dense polymer networks may induce non-negligible elastic effects. Such effects have not been studied here, although should be considered in more detail within future work. Movement through highly viscous solutions have the effect of increasing the relaxation time of optically trapped particles due to elastic deformation of the fluid, [25]. Additionally, such elastic properties have the potential to alter forces acting on the cell through long-range hydrodynamic memory effects [26].
Martinez et al. [10] showed that the non-monotonic increase in free-swimming speed for flagellated bacteria can be eliminated by removing molecular impurities within the solution for PVP solutions with a low molecular weight. However, for high molecular weight solutions, such as the solutions used in our experiments, the non-monotonic peak persists. An interesting future direction of this project would be to carry out propulsive force measurements in dialyzed PVP solutions. These additional measurements would further elucidate the bacterial swimming behavior through complex fluids as not only a function of viscosity, but also of viscoelastic fluid properties.
4.1. Changes in Flagellum Geometry
From experimental measurements, it is clear that RFT and mRFT over-predict the swimming forces produced by bacterial flagella and therefore there must be other mechanisms contributing to the changes in motility. This leads to examination of possible changes in flagellum geometry, which will change the swimming efficiency of the cell. It has been previously observed with fluorescence microscopy that E. coli swimming in fluids with viscosities similar to that of water have a helix pitch of ~42° [27], which is close the angle required for maximum efficiency [8]. This result is not surprising from an evolutionary perspective, since it would be expected that the efficiency of an organism would be maximized while moving through a common environment. The swimming efficiency of E. coli is typically around 2% and is a function of propulsive power output [23]. Where the propulsive power is subsequently affected by the shape of the propeller. This efficiency can be calculated from the resistance matrix elements, presented in Equations (3)–(5). Therefore, if the geometry of this helix was to change, this may result in decreased efficiency of the propeller, resulting in a lowered effective force.
For a fixed flagellum length and cell body, we seek what flagellum geometry is required to maintain a constant propulsive force. This is visualized in Figure 4. For simplicity, an extreme case for tangential viscosity is presented, wherein tangential flagellum motion sees the viscosity of water (η0) regardless of how the viscosity of the surrounding fluid is changed. This corresponds to a situation where the fluid within the helix is devoid of polymer chains. We define the initial propulsive force as F0, and are interested in determining how this force varies as a function of flagellum pitch length and radius, where all possible combinations of these variables are denoted by the function Fp,r, for a given viscosity, η. We observe that the measured propulsive force remains approximately constant, so we are seeking which flagellum geometries minimize ΔF = |F0 − Fp,r|. Figure 4 shows the normalized force difference,
for the two viscosity extremes, η = η0 = 0.89 mPas (a), and η = ηmax = 190 mPas.
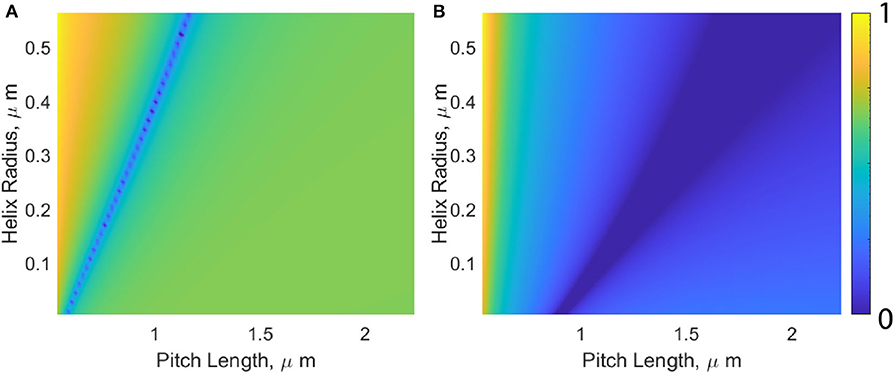
Figure 4. Visualization of how changes in helix pitch length and radius affect the propulsive force produced by the flagellum. The color-bar represents the normalized force difference, where darker colors (0 on the color-bar) indicate which values for pitch length and helix radii will produce the propulsive swimming force generated by a typical E. coli moving through water with a viscosity of η = 0.89 mPas (A) and η = 190 mPas (B).
In general, as η is increased, the band of possible geometries resulting in Ff remaining constant moves down and the right. This movement corresponds to an increase in pitch length, and decrease in the helix radius. This tightening of the coiled filament subsequently changes the pitch angle from its optimal equilibrium position, lowering the efficiency and explaining the overestimated propulsive force predicted by both RFT and mRFT.
Recent models of the internal flagellar structure indicate that curvature and twist of the helix vary continuously with changes in external moments and forces [28, 29]. Further analysis of motility enhancement would benefit in using the aforementioned models to determine analytic values for forces and torques required to cause smooth changes in helix twist and curvature, as continuous deformation of the helix may eventually lead to polymorphic transformations of the filament. Further investigation would be of benefit on this topic to determine the precise forces dense polymer solutions exert on flagella, as well as the exact viscosities required to cause polymorphic changes. The implementation of microfluidics would prove beneficial, as one would ideally like to vary the viscosity of medium in a continuous fashion and conduct all measurements on one cell. Further extensions of this study would allow for continuous force measurements of individual cells as the medium viscosity is gradually increased.
In conclusion, we have measured the propulsive thrust generated by individual cells in mediums of varying viscosity by carrying out direct force measurements with optical tweezers. We have used resistive force theory, and variants, to predict the propulsive force generated by E. coli flagellum. We find that even though a gradual increase in propulsive force is expected, experimental measurements reveal that this force remains approximately constant. We propose that the constant thrust produced may be the result of a deformation of the flagellum geometry, causing the propulsive filament to operate below its optimal efficiency.
Data Availability Statement
The raw data supporting the conclusions of this article will be made available by the authors, without undue reservation.
Author Contributions
DA: investigation, writing, and modeling. MS: supplied cells for experiments and review and editing. IL and IF-B: review and editing. TN and HR-D: funding acquisition, supervision, and review and editing. AS: review and editing and investigation. All authors contributed to the article and approved the submitted version.
Funding
This research was funded by the Australian Government through the Australian Research Council's Discovery Project (project DP180101002). DA and IL are supported by Australian Government RTP Scholarships.
Conflict of Interest
The authors declare that the research was conducted in the absence of any commercial or financial relationships that could be construed as a potential conflict of interest.
Acknowledgments
We thank Kate Peters, Steven Hancock, Minh-Duy Phan and Alvin Lo for assisting with the preparation of E. coli cultures. We would also like to thank professor Julia Yeomans from the Rudolf Peierls Center for Theoretical Physics at the University of Oxford, for helpful discussions and suggestions for modeling and testing motility enhancement.
Supplementary Material
The Supplementary Material for this article can be found online at: https://www.frontiersin.org/articles/10.3389/fphy.2020.575732/full#supplementary-material
References
4. Johnson RE. An improved slender-body theory for Stokes flow. J Fluid Mech. (1980) 99:411–31. doi: 10.1017/S0022112080000687
5. Cortez R, Fauci L, Medovikov A. The method of regularized Stokeslets in three dimensions: analysis, validation, and application to helical swimming. Phys Fluids. (2005) 17:031504. doi: 10.1063/1.1830486
6. Shoesmith J. The measurement of bacterial motility. Microbiology. (1960) 22:528–35. doi: 10.1099/00221287-22-2-528
7. Zöttl A, Yeomans JM. Enhanced bacterial swimming speeds in macromolecular polymer solutions. Nat Phys. (2019) 15:554–8. doi: 10.1038/s41567-019-0454-3
8. Schneider WR, Doetsch R. Effect of viscosity on bacterial motility. J Bacteriol. (1974) 117:696–701. doi: 10.1128/JB.117.2.696-701.1974
9. Berg HC, Turner L. Movement of microorganisms in viscous environments. Nature. (1979) 278:349. doi: 10.1038/278349a0
10. Martinez VA, Schwarz-Linek J, Reufer M, Wilson LG, Morozov AN, Poon WC. Flagellated bacterial motility in polymer solutions. Proc Natl Acad Sci USA. (2014) 111:17771–6. doi: 10.1073/pnas.1415460111
11. Zhang T, Goldman DI. The effectiveness of resistive force theory in granular locomotion. Phys Fluids. (2014) 26:101308. doi: 10.1063/1.4898629
12. Magariyama Y, Kudo S. A mathematical explanation of an increase in bacterial swimming speed with viscosity in linear-polymer solutions. Biophys J. (2002) 83:733–9. doi: 10.1016/S0006-3495(02)75204-1
13. Ashkin A, Dziedzic JM, Bjorkholm J, Chu S. Observation of a single-beam gradient force optical trap for dielectric particles. Opt Lett. (1986) 11:288–90. doi: 10.1364/OL.11.000288
14. Kashchuk AV, Nieminen TA, Rubinsztein-Dunlop H, Stilgoe AB. High-speed transverse and axial optical force measurements using amplitude filter masks. Opt Express. (2019) 27:10034–49. doi: 10.1364/OE.27.010034
15. Block SM, Blair DF, Berg HC. Compliance of bacterial flagella measured with optical tweezers. Nature. (1989) 338:514. doi: 10.1038/338514a0
16. Namba K, Yamashita I, Vonderviszt F. Structure of the core and central channel of bacterial flagella. Nature. (1989) 342:648. doi: 10.1038/342648a0
17. Bolten D, Turk M. Experimental study on the surface tension, density, and viscosity of aqueous poly (vinylpyrrolidone) solutions. J Chem Eng Data. (2011) 56:582–8. doi: 10.1021/je101277c
18. Bühler V, editor. Soluble polyvinylpyrrolidone (povidone). In: Polyvinylpyrrolidone Excipients for Pharmaceuticals: Povidone, Crospovidone and Copovidone. Wachenheim: Springer-Verlag Berlin Heidelberg. (2005) p. 5–124. Available online at: https://link.springer.com/book/10.1007/b138598
19. Aboud SR, Al-Bermany AKJ, Megahed N. Effect of temperature on some rheological properties of polyvinyl pyrrolidone (PVP). Egypt J Solids. (2009) 32:81–8. doi: 10.1038/s41598-018-28876-y
20. Farré A, Montes-Usategui M. A force detection technique for single-beam optical traps based on direct measurement of light momentum changes. Opt Express. (2010) 18:11955–68. doi: 10.1364/OE.18.011955
21. Bui AA, Kashchuk AV, Balanant MA, Nieminen TA, Rubinsztein-Dunlop H, Stilgoe AB. Calibration of force detection for arbitrarily shaped particles in optical tweezers. Sci Rep. (2018) 8:10798.
22. Abbe E. On the estimation of aperture in the microscope. J R Microsc. Soc. (1881) 1:388–423. doi: 10.1111/j.1365-2818.1881.tb05909.x
23. Chattopadhyay S, Moldovan R, Yeung C, Wu X. Swimming efficiency of bacterium Escherichia coli. Proc Natl Acad Sci USA. (2006) 103:13712–7. doi: 10.1073/pnas.0602043103
25. Gomez-Solano JR, Bechinger C. Transient dynamics of a colloidal particle driven through a viscoelastic fluid. N J Phys. (2015) 17:103032. doi: 10.1088/1367-2630/17/10/103032
26. Franosch T, Grimm M, Belushkin M, Mor FM, Foffi G, Forró L, et al. Resonances arising from hydrodynamic memory in Brownian motion. Nature. (2011) 478:85–8. doi: 10.1038/nature10498
27. Turner L, Ryu WS, Berg HC. Real-time imaging of fluorescent flagellar filaments. J Bacteriol. (2000) 182:2793–801. doi: 10.1128/JB.182.10.2793-2801.2000
28. Srigiriraju SV, Powers TR. Continuum model for polymorphism of bacterial flagella. Phys Rev Lett. (2005) 94:248101. doi: 10.1103/PhysRevLett.94.248101
Keywords: Escherichia coli, optical tweezers, direct force measurement, resistive force theory, optical trapping
Citation: Armstrong DJ, Nieminen TA, Favre-Bulle I, Stilgoe AB, Lenton ICD, Schembri MA and Rubinsztein-Dunlop H (2020) Optical Force Measurements Illuminate Dynamics of Escherichia coli in Viscous Media. Front. Phys. 8:575732. doi: 10.3389/fphy.2020.575732
Received: 24 June 2020; Accepted: 26 August 2020;
Published: 07 October 2020.
Edited by:
Ayan Banerjee, Indian Institute of Science Education and Research Kolkata, IndiaReviewed by:
Onofrio M. Marago, National Research Council (CNR), ItalyAlejandro V. Arzola, National Autonomous University of Mexico, Mexico
Copyright © 2020 Armstrong, Nieminen, Favre-Bulle, Stilgoe, Lenton, Schembri and Rubinsztein-Dunlop. This is an open-access article distributed under the terms of the Creative Commons Attribution License (CC BY). The use, distribution or reproduction in other forums is permitted, provided the original author(s) and the copyright owner(s) are credited and that the original publication in this journal is cited, in accordance with accepted academic practice. No use, distribution or reproduction is permitted which does not comply with these terms.
*Correspondence: Declan J. Armstrong, ZGVjbGFuLmFybXN0cm9uZ0B1cS5lZHUuYXU=