
94% of researchers rate our articles as excellent or good
Learn more about the work of our research integrity team to safeguard the quality of each article we publish.
Find out more
ORIGINAL RESEARCH article
Front. Phys., 06 October 2020
Sec. Medical Physics and Imaging
Volume 8 - 2020 | https://doi.org/10.3389/fphy.2020.565422
This article is part of the Research TopicApplied Nuclear Physics at AcceleratorsView all 57 articles
 Ikechi Ozoemelam1*
 Emiel van der Graaf1
 Marc-Jan van Goethem1
 Maciej Kapusta2
 Nan Zhang2
 Sytze Brandenburg1
 Peter Dendooven1
Real-time range verification of particle beams is important for optimal exploitation of the tissue-sparing advantages of particle therapy. Positron Emission Tomography (PET) of the beam-induced positron emitters such as 15O (T1/2 = 122 s) and 11C (T1/2 = 1223 s) has been used for monitoring of therapy in both clinical and preclinical studies. However, the half-lives of these nuclides preclude prompt feedback, i.e., on a sub-second timescale, on dose delivery. The in vivo verification technique relying on the in-beam PET imaging of very short-lived positron emitters such as 12N (T1/2 = 11 ms), recently proposed and investigated in feasibility experiments with a proton beam, provides millimeter precision in range measurement a few tens of milliseconds after the start of an irradiation. With the increasing interest in helium therapy, it becomes relevant to study the feasibility of prompt feedback using PET also for helium beams. A recent study has demonstrated the production of very short-lived nuclides (T1/2 = 10 ms attributed to 12N and/or 13O) during irradiation of water and graphite with helium ions. This work is aimed at investigating the range verification potential of imaging these very short-lived nuclides. PMMA targets were irradiated with a 90 AMeV 4He pencil beam consisting of a series of pulses of 10 ms beam-on and 90 ms beam-off. Two modules of a modified Siemens Biograph mCT PET scanner (21 × 21 cm2), installed 25 cm apart, were used to image the beam-induced PET activity during the beam-off periods. For the irradiation of PMMA, we identify the very short-lived activity earlier observed to be 12N (T1/2 = 11.0 ms). The range precision determined from the 12N activity profile that is measured after just one beam pulse was found to be 9.0 and 4.1 mm (1σ) with 1.3 × 10⁷ 4He ions per pulse and 6.6 × 10⁷ 4He ions per pulse, respectively. When considering 4.0 × 10⁷ 4He ions, which is about the intensity of the most intense distal layer spot in a helium therapy plan, a range verification precision in PMMA of 5.7 mm (1σ) can be realized. The range precision scales approximately with the inverse square root of the number of 4He ions, i.e., the relative statistical accuracy of the number of coincidence events. Thus, when summing data over about 10 distal layer spots, this study shows good prospects for obtaining 1.8 mm (1σ) precision in range verification, within 50 ms after the start of a helium irradiation by in-beam PET imaging (scanner 29% solid angle) of 12N.
Charged particles (in particular protons and carbon ions) are increasingly used for radiotherapy of cancers. The main rationale for their use, compared to irradiation with photons, is their favorable dose distribution: a reduced integral dose and an energy-dependent depth for the dose maximum (so called Bragg peak). Such dose distributions fulfill the therapeutic goal of having a sufficient dose in the tumor while minimizing the dose to co-irradiated healthy tissues. While protons and carbon ions remain the main charged particles used in cancer therapy, a renewed interest in therapy with helium ions has developed in recent years [1–5], with implementation planned for centers such as the Heidelberg Ion Beam Therapy Center (HIT) [6–8]. In pioneering clinical trials at the Lawrence Berkeley Laboratory, around 2,000 patients were treated with helium ions [9–11]. The rising interest in helium ions is driven by their advantages over protons and carbon ions: a smaller lateral penumbra compared to protons (see e.g., [4, 12]); and factors related to their lesser fragmentation [13] and potentially cheaper implementation cost relative to carbon ions.
In spite of the theoretical benefits attributed to the precise dose deposition of charged particles, the practical realization is hampered by the enhanced sensitivity of particle beams to differences between the data and models on which treatment plans are based and the actual situation during patient irradiation. These deviations originate, among others, from range uncertainties due to factors such as inaccuracies in the patient model (CT imaging and conversion to stopping power required for dose calculation), patient motion, setup errors and anatomical changes [14, 15]. Consequently, mitigation strategies including the use of larger safety margins [15, 16], robust optimization ([17–21], and review [22]) and sub-optimal beam directions [23] are adopted to provide robustness against these effects. Such strategies ensure tumor coverage at the expense of a larger dose to healthy tissue/organs at risk (OAR), and thus sub-optimally exploit the inherent dosimetric benefit of charged particle therapy. Motivated by the need to fully exploit these benefits, dual energy CT ([24, 25] and review by [26]) and proton imaging [27–29], which provide better information on the relative stopping power and thus lead to less range uncertainties, are being investigated. In addition to these imaging techniques, in vivo range verification techniques have been introduced and are being investigated as quality assurance tools for monitoring of the accuracy of dose delivery (see e.g., reviews [23, 30, 31]). A treatment protocol employing such a technique could enable the use of smaller range margins during treatment planning and/or the use of more optimal beam directions, i.e., also stopping the beam in close vicinity of OARs, effectively reducing the volume of irradiated healthy tissue. This contributes to minimizing the probability of complications, which increases the quality of life and reduces follow-up health care costs.
Given the absence in particle therapy of primary radiation exiting the patient body, in vivo verification techniques rely on the detection of secondary emissions resulting from particle interactions in the body: annihilation photons ([32–36] among others; review papers [37–39]), prompt gamma rays ([40–48] among others and review [49]), other secondary particles [50–52], and iono-acoustic waves [53–57].
Positron Emission Tomography (PET) imaging is the pioneering technique for in vivo range verification [32]. The technique relies on the imaging of the photons originating from the annihilation of positrons emitted in the radioactive decay of beam-induced radionuclides. An advantage of the PET technique is that it is based on a well-established nuclear medicine imaging technology and thus requires less effort in translation to routine clinical use. Three main strategies have been proposed for clinical implementation: “In-beam” imaging during the irradiation with a scanner integrated into the beam delivery nozzle [36, 58, 59]; “in-room” imaging after completion of the irradiation with a PET scanner installed in the treatment room and starting within about 2 min after the irradiation [35, 60, 61]; and offline imaging after completion of the irradiation with a PET scanner installed outside the treatment room and starting more than 5 min after irradiation [62–65]. The delayed data acquisition with respect to the irradiation, in the in-room and offline implementations, presents an advantage for the PET in vivo verification technique. For these implementations, the PET signal is essentially free of background signal interference from other beam-induced signals (neutrons, prompt photons and other secondary particles). Handling such interference is possible with the in-beam PET implementation. Its realization depends on the width and period of the beam pulses; coincidence window and time resolution of the scanner and may require pile-up rejection. A simulation study evaluating the performance of these strategies in terms of achievable count statistics (not including very-short lived positron emitters), image quality, cost of integration and impact on the treatment workflow is presented in [66]. Although, according to [66], the in-beam strategy gives the best performance, it faces a foremost challenge of a high integration cost. Consequently, the authors recommend the in-room strategy as a compromise between the high cost of integration of in-beam PET and the loss of count statistics as well as workflow impediments associated with the offline strategy.
The retrieval of prompt feedback (i.e., on a sub-second timescale) on dose delivery by individual irradiation spots requires the collection of sufficient counting statistics within a short period. The in-beam PET implementation, previously investigated at synchrocyclotrons, are incapable of providing such statistics due to the imaging of positron emitting nuclides with half-lives between 2 and 20 min during the irradiation pauses. For example, Pennazio et al. [59] reach a 1–2 mm range precision 190 s after the start of the irradiation. Thus, the absence of prompt feedback precludes the intra-fraction initiation of corrective actions to improve the dose delivery accuracy. We have shown that in addition to these longer-lived nuclides, very short-lived nuclides such as 12N (T1/2 = 11 ms) are copiously produced during proton irradiation of carbon-rich tissues [67, 68]. Based on this finding, Buitenhuis et al. [69] and Ozoemelam et al. [70] performed experiments on the potential of imaging 12N for range verification. A drawback of 12N imaging is the positron range blurring, due to the high positron endpoint energy of 16.4 MeV, which will impact the retrieval of range information. Despite the large 12N positron range, millimeter precision range measurements can be performed when imaging the 12N produced by 5 × 10⁸ protons on both graphite and PMMA targets [69, 70].
As treatment with helium ions regains new interest, the optimal use of this ion would also benefit from an in-vivo verification technique. In contrast to protons and other therapeutic ions, there is a paucity of studies on PET monitoring of helium beam therapy. Early investigations [32] show that positron emitting isotopes [15O (T1/2 = 2.05 min) and 11C (T1/2 =20.3 min)] are produced on carbon-rich materials and soft tissues, and could potentially indicate the range of helium beams, provided that technical limitations of the prevalent imaging hardware could be resolved. The limitations experienced at that time include the unavailability of on-line detection systems which allow the detection of short-lived nuclides and reduce biological washout of the nuclides; signal deterioration by background radiation; poor detector spatial resolution and sensitivity. Several decades after this investigation, most of these limitations have received significant attention and detection systems for on-line monitoring with improved detector resolution and sensitivity [35, 36, 59, 69–73] and methods for suppressing background radiation [69, 74] have been developed. More recent investigations into the feasibility of in-beam PET for therapeutic 3He beams [75] and off-line PET with 4He beams [76] provide a quantitative estimation of the production rates of the relevant radionuclides mentioned in Ref. [32], and highlight significant reduction in measured activity levels, especially in oxygen-rich materials, when changing from an in-beam detection to off-line strategies. As the imaging of the longer-lived nuclides, presented in these studies, does not provide prompt feedback on beam-delivery, alternative approaches based on the detection of prompt gamma photons have been investigated [77, 78].
The production of a very short-lived activity with a half-life of about 10 ms, attributed to 12N and/or 13O, was observed during irradiation of both carbon-rich and oxygen-rich targets with helium ions [79]. This activity could potentially be used to obtain prompt feedback on dose delivery. In this paper, we investigate the near-real time range verification capabilities, especially the precision, in helium beam radiotherapy by PET imaging of this very short-lived activity.
The experiment was performed at the AGOR cyclotron of the KVI-Center for Advanced Radiation Technology (KVI-CART), University of Groningen. Figure 1 shows the experimental setup. A beam of 90 AMeV 4He ions was used to irradiate PMMA targets (see section Target and PET Scanner Setup). The beam was delivered through a horizontal beam line to the experimental area. The intensity of the beam was monitored with an air ionization chamber [beam intensity monitor (BIM)] placed after the exit window of the beam line. A paddle-shaped (100 × 100 mm2 area and 1 cm thick) NE102A plastic scintillation detector, capable of counting each 4He ion at low beam intensity, was used to calibrate the BIM in terms of beam intensity. The width of the beam at the target position was 6.5 mm FWHM in both vertical and horizontal direction, as measured using a harp-type (wire grid) beam profiler. To allow imaging of the short-lived PET nuclides without interference from the prompt radiation associated with the beam pulses, the 4He beam was delivered in pulses consisting of 10 ms beam on and 90 ms beam off. The beam pulsing was realized with an electrostatic beam chopper in the injection line of the cyclotron. The chopper was controlled by a pulse generator that was also used to switch the detectors on and off. Two beam intensities were used: 1.3 × 10⁷ and 6.6 × 10⁷ 4He ions per 10 ms pulse. After switching the beam on, the full beam intensity is reached within about 0.5 ms. Switching off the beam is slower: the intensity drops to 3% of its value after 3.0 ms. The targets were irradiated for 600 cycles (60 s) with data acquired during the beam pauses and an additional 70 s, while still pulsing the detectors, after the end of the irradiation. The data from the first second of irradiation are used to determine the range precision using the very short-lived activity (see section Range Verification Using 12N). The longer irradiation time enables to compare the number of counts from the very short-lived and the longer-lived activities (see section Time Spectrum of Activity).
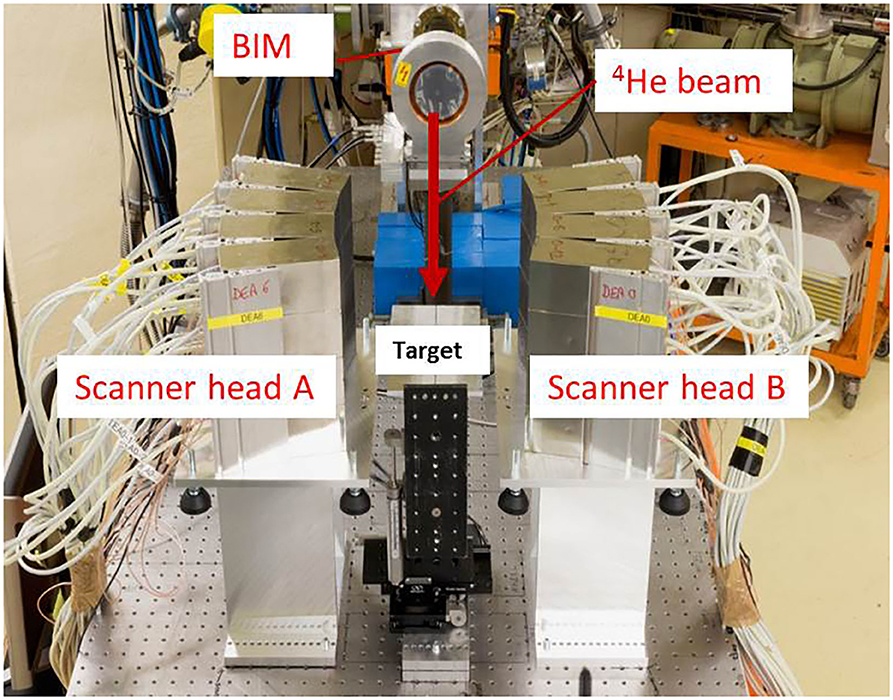
Figure 1. Setup for imaging beam-induced positron activity. The 4He beam direction is indicated by the red arrow. The beam bombards PMMA targets installed in-between two modules of a Siemens Biograph mCT PET Scanner, Scanner head A, and B. The beam intensity monitor (BIM) is indicated.
The dimensions of the PMMA targets (width × height × length) were 120 × 120 × 100 mm3. The targets were installed with their short side parallel to the beam direction. As the ion range in PMMA calculated using SRIM [80] is 55 mm, the target thickness was sufficient to completely stop the ion beam and the positrons emitted by 12N/13O. Table 1 shows the threshold for production of 12N/13O and other short-lived positron emitters during irradiation of carbon and oxygen with 4He. Only the reaction channels with the lowest threshold energy are shown. The lowest threshold energy, for the production of 18Ne on 16O, of 29.7 MeV represents a helium range in water of 0.7 mm. The other reactions have threshold energies from 50.6 to 75.4 MeV, corresponding to a helium range in water from 1.9 to 3.9 mm. Thus, the distal edge of the activity profile is located few mm proximal to the ion range. Compared to protons, the proximal shift of the activity distal edge relative to the range is smaller because of the higher stopping power of helium.
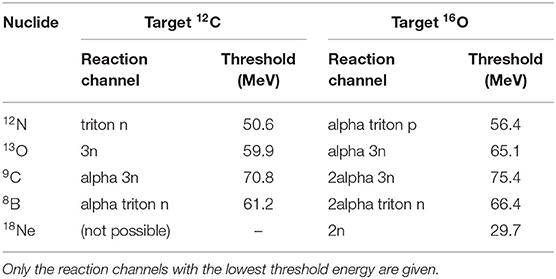
Table 1. Reaction threshold energies for the production of very short-lived positron emitters produced by 4He on carbon and oxygen (from https://www.nndc.bnl.gov/qcalc/index.jsp).
The target was mounted such that the center of the field of view (FoV) of the scanner corresponded to a depth of 55 mm in the target. The central axes of the target and the scanner FoV were aligned with the beam direction. The distance between the centers of the two scanner modules was 252 mm. To investigate the range verification performance, PET data was acquired for the following target configurations: nominal and insertion of 1.9 ± 0.1, 3.0 ± 0.1, 4.9 ± 0.1, and 9.4 ± 0.3 mm PMMA range shifters at the proximal surface of the targets.
The PET system used in this experiment is 1/6 of a Siemens Biograph mCT clinical scanner with custom-modified detectors. Two detector panels were installed opposite each other for PET imaging of the beam-induced positron activity. Each panel has an area 210 × 210 mm2 and is composed of a 4 × 4 array of block detectors. A block detector comprises a 13 × 13 array of 4 × 4 × 20 mm3 LSO scintillation crystals read out by 4 photomultiplier tubes (PMTs). The energy signals are transmitted through Ethernet cables (CAT 6A twisted pair cables with RJ-45 jacks) to two Detector Electronics Assemblies (DEA) which encode position, energy and time of arrival of the photons. A coincidence unit receives the processed signals from the DEA, determines valid coincidence events and transmits the data to a data acquisition computer. A coincidence time window of 4 ns and an energy discrimination window of 435–650 keV were used. The panels were installed such that they curve around the vertical axis with a radius of curvature of 42 cm (see Figure 1).
Custom modifications were implemented to ensure good detector performance under the high radiation levels present during the helium beam irradiation. As each block detector is exposed to a γ-ray flux of around 108 s−1, estimated from [81], during the beam-on periods, which exceeds the capacity of the PMTs, the PMT voltage dividers were modified such that the detectors can be effectively switched off during the beam-on periods. The detector pulsing is controlled by a TTL signal that is synchronized with the beam pulsing. After the detector is switched on, a period of 300 μs is required for the detector to become operational, while a shorter time of 130 μs is required to switch the PMT off. Despite the short time required to switch the PMT on, a longer delay of the start of the data acquisition after switching off the beam was used. An optimum delay of 3 ms was experimentally determined and applied as a compromise between exposure of the detector to prompt radiation resulting from the tail of the beam-on pulse and early detection of the beam-induced PET counts. Although the PMT becomes operational within 300 μs, a temporarily lowering of the PMT gain with a recovery time of about 25 ms was observed. This effect was investigated and quantified with 68Ge radioactive sources in a coincidence setup with 2 block detectors as well as with data from part of the post-irradiation period (50–70 s after end of irradiation) using the complete scanner. In this period, the PET activity is due to the decay of long-lived positron emitters, thus the time spectrum should have a constant activity within the 90 ms detector-on period. The time spectrum of coincidence events from both these investigations is shown in Figure 2. A period of about 5 ms is required to attain 90% of the maximum count rate in the 435–650 keV pulse height window used. We compared the detector recovery for irradiation with the two beam intensities applied in this study. No significant difference was observed for the intensity range used here. It cannot be excluded that an intensity dependence exists over a larger intensity range. The time spectra have been corrected with a time dependent normalization factor as shown in Figure 2 to take the PMT gain recovery into account. Applying this correction on the data collected 30–50 s after the completion of the 60 s irradiation results in a constant count rate in the detector-on period, correctly reflecting the constant PET activity.
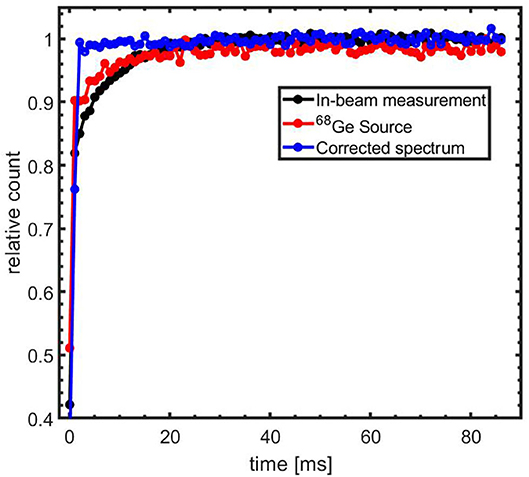
Figure 2. Time spectrum of coincidence events after switching-on the PMTs. Spectrum for acquisition using radioactive lab sources (red) and 50–70 s post-irradiation measurement (black). The blue line represents a corrected spectrum of the 30–50 s post-irradiation data using the 50–70 s post-irradiation data as a normalization factor.
The images of the beam-induced activity were reconstructed using the algorithm introduced in Ref. [69] and further described in Ref [70]. The reconstruction algorithm creates a 2D histogram of the intersection of the Lines of Response (LoR) with the plane coinciding with the helium pencil beam (i.e., the beam central axis). The Depth of Interaction (DoI) in the detector was set to a depth of 8 mm. Although more sophisticated algorithms such as the 3D maximum-likelihood expectation-maximization [82] provide a more accurate depiction of the activity distribution, these require high count statistics and a significant processing time. As the imaging of the short-lived nuclides is aimed at near real-time feedback using the relatively small short-lived positron activity and also given the accurate knowledge of the position of the pencil beam, the image reconstruction algorithm used here is considered sufficient for this purpose. A reconstruction grid over an area of 208 × 208 with 8 × 8 mm2 pixel was used.
The LoR is determined from the IDs of the two coincident crystals. This information and the time tags of the coincidence events were recorded in a list-mode data file by the PET system. Time tags were inserted into the data stream at 1 ms intervals. The inclusion of the time tags was necessary to ensure proper identification of the short-lived nuclide activity contribution (See section Reconstruction of the Short-Lived Positron Emitter Contribution). The time tag values were inserted relative to the beginning of data acquisition. The beam pulsing was synchronized with the detector switching, but could not be synchronized with the start of the PET data acquisition. Irradiation was started shortly after the start of the data acquisition of the scanner. Due to the asynchronous start of data acquisition and irradiation, the exact start of the irradiation with respect to the time tags was determined through an analysis of the variations in the event rate. The data acquisition generally starts with a low pre-irradiation count rate followed by a marked increase in the coincidence rate due to beam-induced activity. As targets with no measurable initial activity were used in all measurement runs, the clear gradient in the count rate, seen in the acquired data, was used to identify the first beam-off period which served as reference for the subsequent pulses, which were identified by adding 100 ms time tag intervals.
The recovery of the coincidence rate (section PET System) was taken into account during the image reconstruction by weighting each LoR by a factor equal to the inverse of the coincidence recovery factor associated with the time bin of the LoR. Further to this correction, the 2D images were corrected for the non-uniform sensitivity of the PET system determined through measurements with calibrated 68Ge line sources crossing the center of the scanner FoV. The absolute sensitivity of the scanner, measured with a calibrated 68Ge point source (activity accuracy 0.6% 1σ) in the center of the FoV, was 2.2%.
The beam-induced positron emitters are indistinguishable on the basis of the 511 keV annihilation photons. To reconstruct the distribution of the short-lived nuclides, a weighted subtraction of images reconstructed for two different time windows in the beam-off period was performed. The first image, also referred to as the early image, was reconstructed using events from the time period 1–59 ms and contains contributions from both 12N and longer-lived nuclides. The second image, referred to as the late image, was reconstructed using events from the period 60–86 ms and contains only counts from longer-lived nuclides. A weighting factor of 2.19, corresponding to the ratio of the duration of the early to late time windows, was used to scale the late image before the image subtraction step.
To determine the shift in the range of the 4He ions due to changes in target configuration, 1D activity profiles, with bin width of 8 mm, along the direction of the ion beam were obtained from the 2D images reconstructed using the method described in section Reconstruction of the Short-Lived Positron Emitter Contribution. The 1D activity profile is a projection of the 2D image on the horizontal axis. The algorithm for detection of the range shift follows that used in Ref. [83] where the points in a given profile are shifted in the x-direction and compared to a reference profile to obtain the shift which minimizes the summed absolute difference between the two profiles. In this work, the activity profiles were normalized to their respective maximum and linearly interpolated in 0.08 mm bin widths and shifted in 0.08 mm steps relative to a reference profile. For each shift δthe root mean square difference between the profiles was calculated as
where i is the index of the reference (Aref) and range-shifted (Ashift) activity profiles; T is the number of bins in the profile. Indices in the activity profiles, starting from 500 bins (i.e., 40 mm) from the downstream edge of the FoV (depth bin = 0) to the 80% activity level on the proximal slope of the activity peak, were included in the comparison. The proximal slope represents the edge of the target where the beam enters the target. Figure 3 shows the Region of Interest (RoI) used for profile comparison. Because of potentially non-overlapping ROIs, the bin offset between the proximal edges of the ROIs, δo, was determined. For a proximal shift of the profile as depicted in Figure 3, δo bins with zero counts were appended to the left side of the profile with a corresponding number of bins removed from the right side of the profile. For a distal shift, the appendage and clipping of bins was performed on the range-shifted profile. The range shift in mm was found as
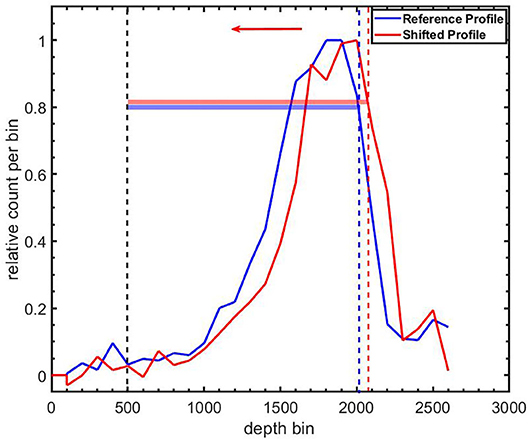
Figure 3. Definition of regions of interest (RoIs) for comparing a shifted 12N profile (Red line) to a reference 12N profile (blue line). The corresponding colored horizontal bars indicate the extent of the RoIs. The lower level of both RoIs are the same and correspond to 500 bins (bin width = 0.08 mm) from the downstream edge of the field-of-view (depth bin = 0). The beam direction is indicated by the leftward arrow.
Figure 4 (left) shows the time spectrum of the beam-off periods of the first five pulses summed over ten irradiations with 6.6 × 10⁷ 4He ions per pulse. Each irradiation was performed with a fresh target. The decay of a short-lived contribution on top of a longer-lived contribution is clearly seen. A fit of the first pulse, as shown in Figure 4 (right), gives a contribution with a half-life of 11.1 ± 0.3 ms. This fit value is consistent with 12N and thus resolves the 12N/13O ambiguity in our previous study [79]. In the subsequent text we will therefore refer to the very short lived contribution as being due to 12N. Figure 5 shows the evolution of the longer-lived activity contributions within the first 10 s of a single irradiation. Shown are the total counts from long-lived contributions in the time window 1–59 ms, as well as the ratio of the long-to-total counts. At the start of the irradiation, 71% of the total count is due to 12N. However, this fraction reduces to only 9% by 10 s into the irradiation due to a build-up of relatively fast decaying longer-lived nuclides. To identify and retrieve the fractions of these nuclides, the spectrum was fitted with a three-component exponential growth-in function:
with F1, F2, F3, and C representing the contributions of three components and a constant. The decay constants of the components are represented by λ1, λ2and λ3. The combination of components consisting of 9C (T1/2 = 127 ms), 8B (T1/2 = 770 ms), 18Ne (T1/2 = 1.7 s), and a constant due to contributions of longer-lived nuclides [10C (T1/2 = 19.3 s), (17F (T1/2 = 64.8 s), 14O (T1/2 = 70.6 s), 15O (T1/2 = 122 s),13N (T1/2 = 598 s),11C (T1/2 = 1223 s), and 18F (T1/2 = 6586 s)], as expected from the measurements presented in ref. [79], was found to give the best fit to data.
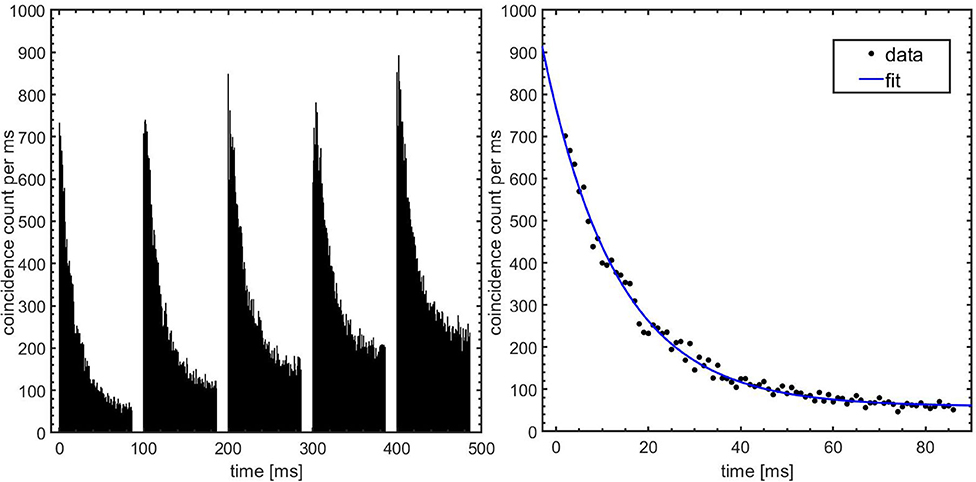
Figure 4. Time spectrum of beam-induced activity. Left: Coincidence counts vs. time for the first five beam periods. The data shown are summed over 10 irradiations with 6.6 × 10⁷ 4He ions per pulse. The beam-on periods during which the detectors are switched off are easily recognized. Right: Fit of the corrected data after the first irradiation pulse with a single decay contribution and a constant. The fit considers data in the interval 2–86 ms.
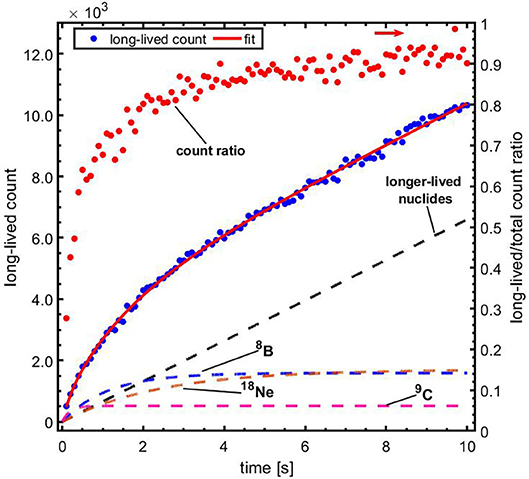
Figure 5. The contribution of long-lived nuclides vs. time, during the first 10 s of the irradiation. Blue data, left vertical axis: total counts from long-lived contributions in the time window 1–59 ms of each beam-off period, with a fit to the data using Equation (3); red data, right vertical axis (indicated by the rightward arrow): ratio of the long-lived to total counts. The respective contributions of the indicated nuclides and the longer-lived nuclides are represented with the dashed lines.
The reconstructed images after corrections for the detector coincidence recovery and scanner sensitivity, as described in section Image Reconstruction, are displayed in Figure 6. The images were reconstructed from events arising from the first pulse (left column) and the sum of the first 10 pulses (right column) during the irradiation of PMMA with pencil beams of 1.3 × 10⁷ 4He ions per pulse. The 12N images were reconstructed with ~200 and 2,000 counts (without corrections for scanner uniformity and detector recovery) due to the decay of 12N, respectively. A higher variance in pixel values and also pixels with negative values are seen in the 12N images due to the weighted subtraction of the late image from the early image. Figure 7 shows 1-dimensional profiles perpendicular to the beam of an image reconstructed following irradiation with 6.6 × 10⁹ 4He ions (sum of the first 10 pulses of 10 datasets obtained from irradiations with 6.6 × 10⁷ 4He ions per pulse). The broader lateral width of the 12N profile is caused by the much larger 12N positron range.
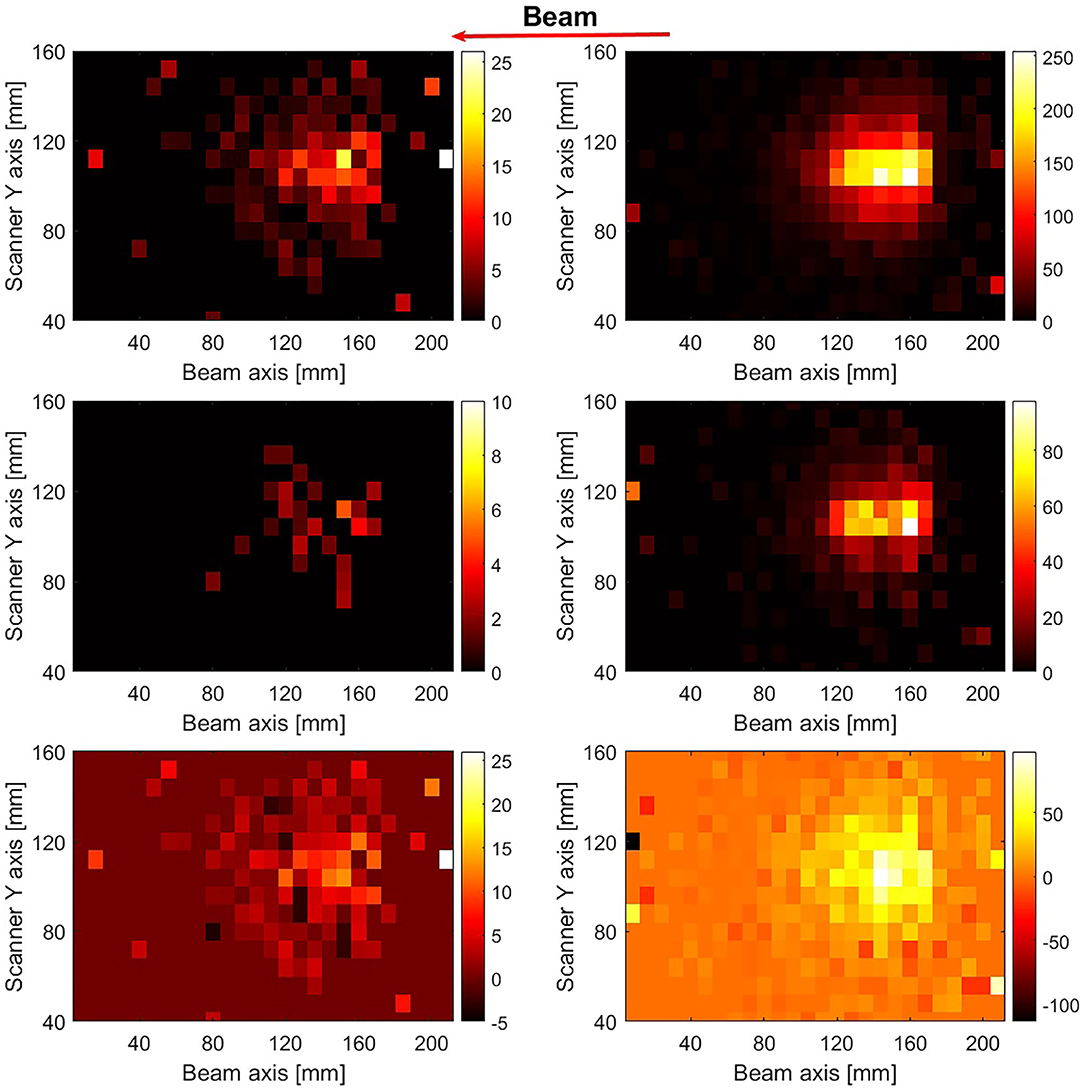
Figure 6. 1-dimensional profiles of the beam-induced activity. Profiles along the scanner axis perpendicular to the beam are shown for the late (red) and 12N (blue) images. The lines are included to guide the eyes.
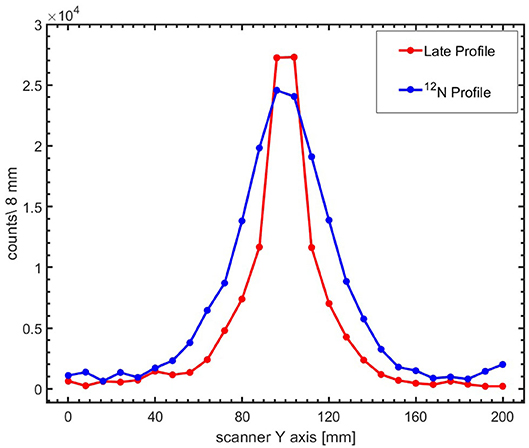
Figure 7. 2D reconstructed PET images of the first pulse (left column) and the sum of the first 10 pulses (right column) for irradiation of PMMA with 1.3 × 10⁷ 4He ions per pulse. The beam direction is indicated by the leftward arrow. The images in the top and middle row were reconstructed using events occurring between beam-off time 1–59 ms (early image) and 60–86 ms (late image), respectively. The images were corrected for the scanner sensitivity and the coincidence recovery. The bottom row shows the 12N image after the scaled subtraction of the late images from the early images.
The range verification performance of imaging 12N was assessed through irradiation of PMMA targets in various configurations. The pixel values of 2D images were summed along the vertical axis into 1D activity profiles. To minimize the effect of the rather quick build-up of the long-lived nuclides as an irradiation progresses (see Figures 4, 5) which increases the statistical uncertainty in the 12N profiles, only data obtained from the first second of an irradiation, containing 10 4He ion pulses, were evaluated. In the first second of irradiation, the fractional contribution of the long-lived nuclides to the total count is smallest and varies between 29% in the first pulse to 68% in the 10th pulse (mean value = 0.58 ± 0.14). Nevertheless, the count variation is averaged out in the analysis that follows and we thus consider the 12N profiles from the 10 pulses in the first second as nominally identical.
The range shift relative to a nominal (reference) target configuration was determined by comparing the 1-dimensional range-shifted profile of the modified target configuration with the reference profile. The best matching shift was retrieved as described in section Detection of Range Shifts. The reference profile was obtained from the average of 2 independently measured profiles and corresponds to a statistics of 1.32 × 10⁹ 4He ions. The independently measured profiles were obtained as follows
a. The count data of 100 pulses were randomly sampled with replacement (the randomly sampled data can be re-used) from the first second (10 pulses) of irradiation with 6.60 × 10⁷ 4He ions per pulse, giving a data set equivalent to the sum of 10 pulses or 6.60 × 10⁸ 4He ions.
b. The sampled count data were summed and reconstructed into 1-dimensional profiles.
The range shifts for the range-shifted target configurations when irradiating the targets with the experimentally applied 4He beam intensities (1.34 × 10⁷ and 6.60 × 10⁷ 4He ions per pulse) were determined as the mean of the shifts of the 10 profiles reconstructed from the first second of irradiation. The uncertainties associated with the measured range shifts were determined from the standard deviation of the shifts.
As clinical applications may involve irradiations using beam intensities other than 1.34 × 10⁷ and 6.60 × 10⁷ 4 He ions per pulse, a bootstrap sampling technique [84] was used to generate quasi-independent samples. Sampling from the first 10 pulses of an irradiation was performed to combine counts from multiples pulses, thus providing 12N counts consistent with an irradiation with a higher number of 4He ions per pulse. Samples having statistics corresponding to irradiations with (2.68, 6.71, 10.7, and 13.4) × 107 4He ions were generated by summing the counts from two, five, eight and ten pulses of 1.34 × 10⁷ 4He ions randomly sampled with replacement from the first second of the irradiation. The same sampling was performed for irradiations with 6.60 × 10⁷ 4He ions per pulse to obtain statistics corresponding to irradiations with (1.32, 3.3, 5.28, and 6.60) × 108 4He ions. To get good quality estimators (the mean and standard deviation) while approaching statistical independence, 500 bootstrapped samples were generated. After the bootstrapped sampling, the 1-dimensional profiles for each of these samples were constructed and the range shift determined using the procedure described in section Detection of Range Shifts.
In Figure 8, the 12N profiles are shown for the nominal target configuration and with PMMA range shifters of 1.9 ± 0.1, 4.9 ± 0.1, and 9.4 ± 0.3 mm directly upstream of the target. The 12N profiles displayed were obtained for statistics corresponding to an irradiation with 6.6 × 10⁸ 4He ions (realized by bootstrap sampling with replacement from 10 pulses of irradiation with 6.6 × 10⁷ 4He ions per pulse, as described above). Four out of the 500 bootstrapped sample profiles are shown alongside the reference profile for each case. As seen in Figure 8, the introduction of range shifters upstream of the target moves the profiles upstream with respect to the reference profile.
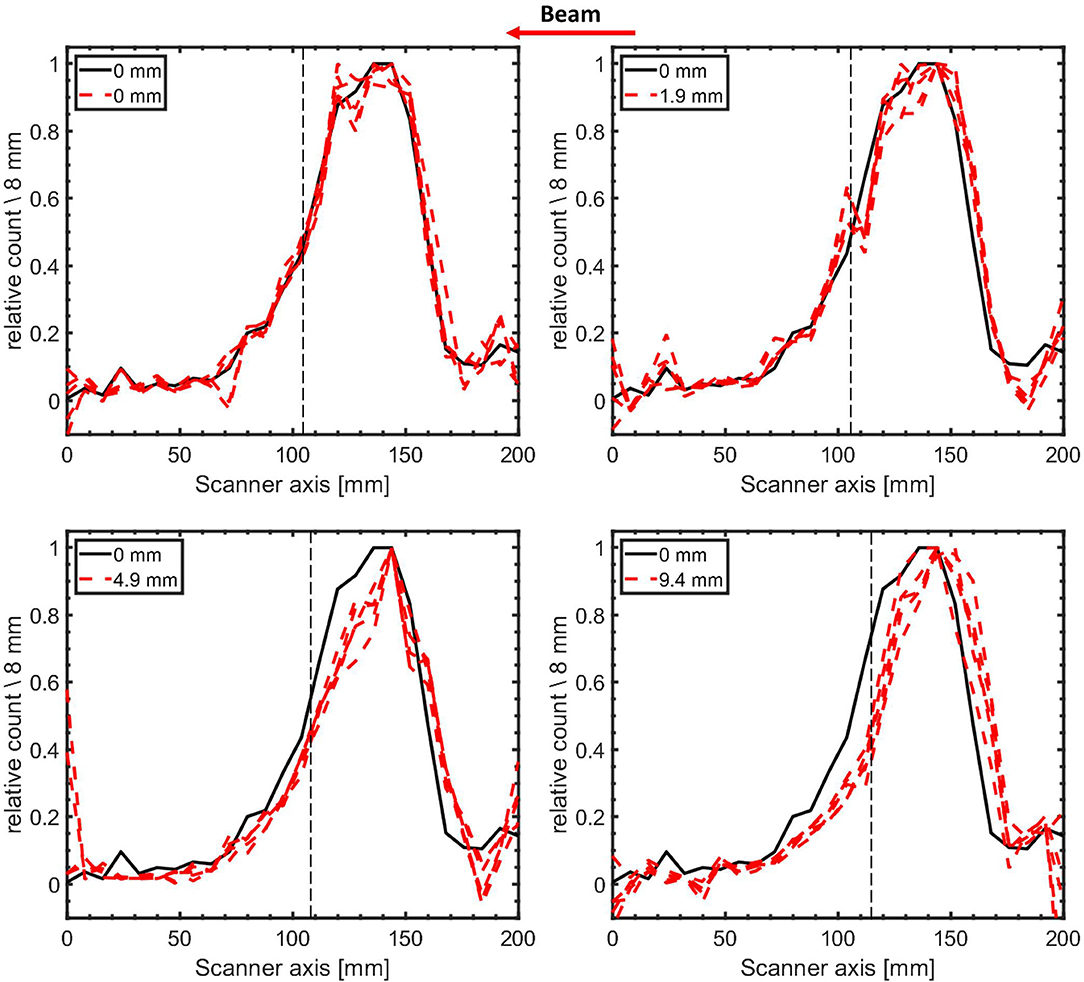
Figure 8. 1-dimensional 12N activity profiles (4 bootstrapped samples) of modified target configurations (red dashed lines) contrasted with the reference profile obtained in the nominal configuration (black line). The expected range shift for all four profiles is indicated by the label values. The helium ion range is indicated by the dashed vertical black lines. The activity profiles for the modified targets were reconstructed from the counts following an irradiation with 6.6 × 10⁸ 4He ions (10 pulses of irradiations with 6.6 × 10⁷ 4He ions per pulse sampled with replacement from the first second of irradiation). The profiles have been normalized to their respective maximum activity. The beam direction is indicated by the arrow.
The distribution of the range shifts obtained from the bootstrapped samples is shown in Figure 9 for two values of the number of 4He ions per pulse. The mean value of the shifts of the sampled profiles is taken as the measured range shift due to the change in the target configuration. The measured range shifts for different configurations are summarized in Table 2. The precision of the measured range shifts was determined as the standard deviation of the range shifts from the 500 bootstrapped samples. The weighted mean deviations from the pre-set shifts are also given in Table 2. The weighted mean deviations indicate that the pre-set shifts are reproduced within the error bars for the respective number of ions.
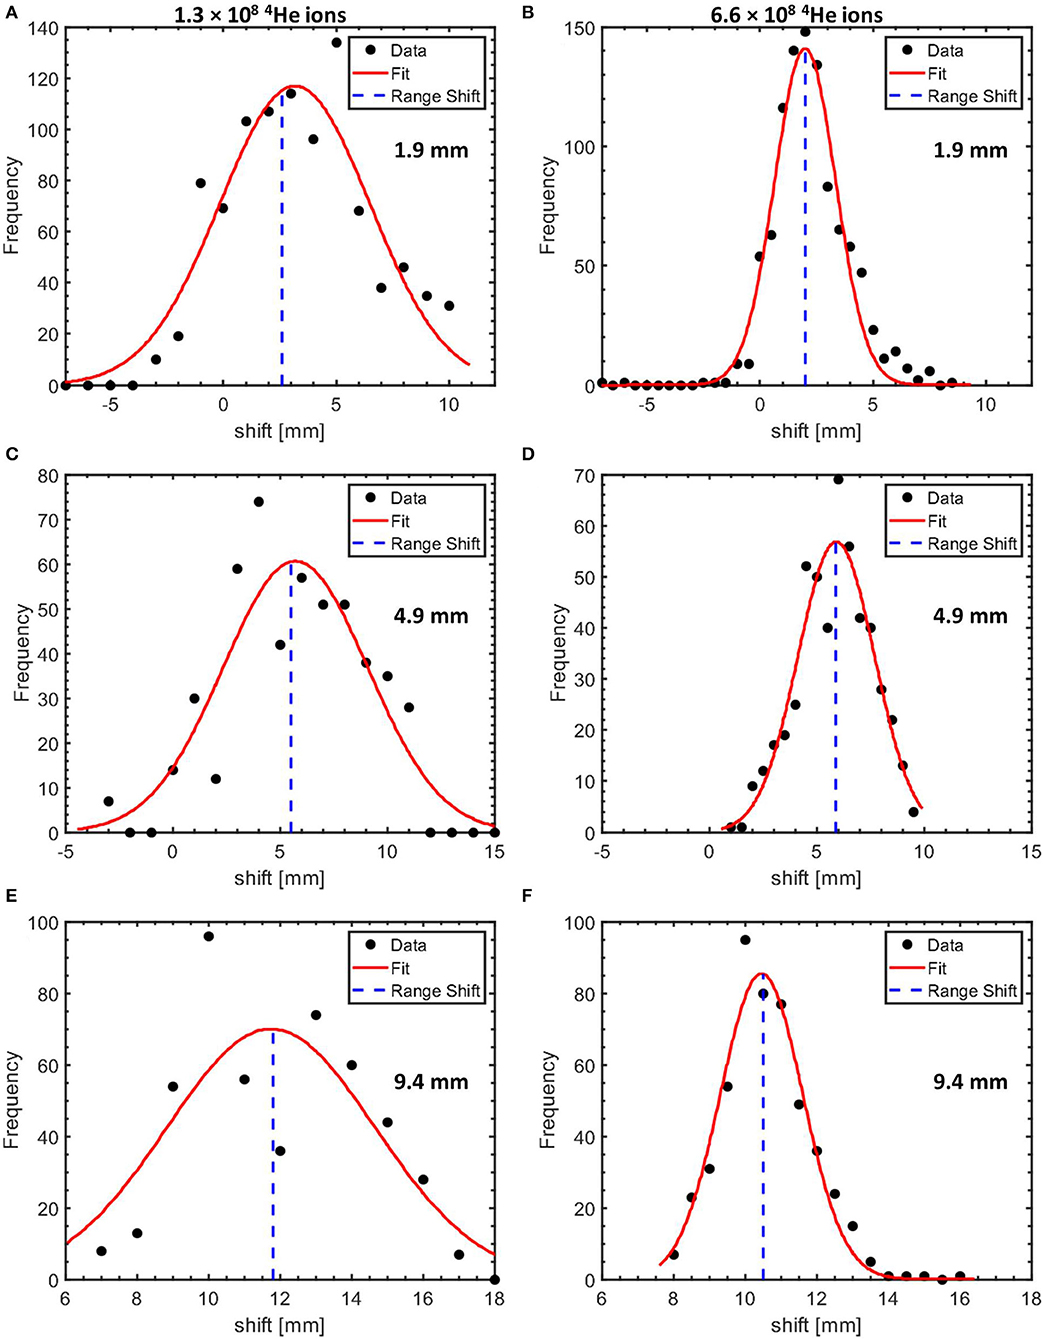
Figure 9. Histograms of the measured range shifts for target configurations with 1.9 mm (A,B), 4.9 mm (C,D), and 9.4 mm (E,F) PMMA affixed to the PMMA target proximal surface. The shifts obtained using datasets equivalent to an irradiation of a PMMA target with 1.3 × 10⁸ and 6.6 × 10⁸ 4He ions are shown in the left and the right column, respectively. The histograms are fitted with a Gaussian with the mean values indicated by the blue dotted line.

Table 2. Precision of range verification for various configurations of PMMA targets and number of 4He ions.
The precision in the range shift measurement using 12N profiles as function of the number of 4He ions is shown in Figure 10. The data points represent the mean precision of the different configurations. The data points were then fitted with a power law function of the form: BN−0.5, where N is the number of 4He ions, the exponent 0.5 representing the effect of counting statistics. The fit parameter is: B = (363.2 ± 9.3) × 102. The higher precision as the number of 4He ions increases is clearly seen and conforms quite well to the fitting function. It shows that non-statistical contributions, for e.g., scanner spatial resolution, to the precision are very small. Using this fitting model and parameters, we estimate that the precision on the measured range shifts when irradiating PMMA with 4.0 × 10⁷ (a single distal layer spot), 1.2 × 10⁸ (3 distal layer spots), and 4.0 × 10⁸ (10 distal layer spots) 4He ions is 5.7 mm (1σ), 3.3 mm (1σ), and 1.8 mm(1σ), respectively.
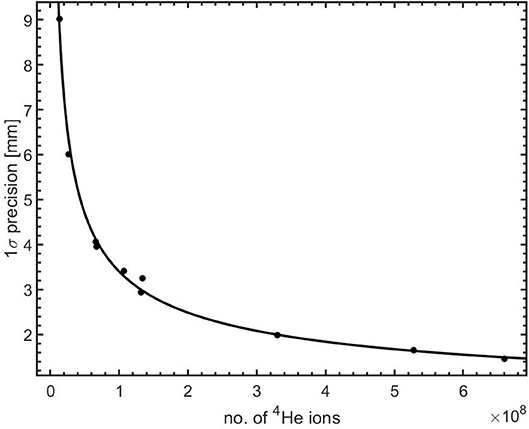
Figure 10. Precision in range shift measurement as a function of the number of 4He ions irradiating a PMMA target. The solid line is a power law (BN−0.5) fit to the data.
Although PET-based range verification can be implemented through the imaging of longer-lived positron emitters such as 15O (T1/2 = 122 s) and 11C (T1/2 = 1218 s) during irradiations with 3He ions [75] and 4He ions [32, 76], the realization of a fast feedback on the ion range is hampered by the half-lives of the positron emitters which necessitate rather long data acquisition periods. We present, in this current study, the performance of a PET-based near real time range verification technique for helium beam radiotherapy which relies on the imaging of the short-lived positron emitter 12N with half-life of 11 ms.
A PET scanner consisting of two modified PMT-based detector modules from a Siemens Biograph mCT PET scanner was used to monitor the beam-induced activity following irradiation with 4He ions. As mentioned in section PET System, the PMTs were switched off during the beam-on as a protective measure against the high radiation flux during the beam-on periods. Despite the fast recovery of the PMT signal of about 300 μs, it was observed that recovery of the coincidence count rate took 20–30 ms. Further investigations into the origin of this effect showed it to be due to a time-dependent gain shift of the PMTs. This recovery has been accounted for in the data analysis through the time-dependent efficiency correction factor. For future applications, a PMT gain shift correction could be implemented in either hardware or software, leading to 30% more coincidence counts and thus about 15% better precision in range measurement as the precision is largely determined by the counting statistics.
Analysis of the time spectrum of the coincidence events (Figure 4) shows that a very short-lived contribution with half-life of 11.1 ± 0.3 ms is produced, confirming our previous study [79]. Whereas, our previous study makes no specific claims as to which combination of the short-lived nuclides 12N (T1/2 = 11.000 ± 0.016 ms) and 13O (T1/2 = 8.58 ± 0.05 ms) is produced, the half-life of the activity contribution seen here strongly suggests that almost exclusively 12N is produced on PMMA.
The images of the activity contributions were reconstructed using the intersection of the LoR with the vertical plane containing the beam central axis. A weighted subtraction of two images, reconstructed using data acquired early and late into the beam-off period, was adopted to disentangle the 12N contribution from the longer-lived ones. This approach, however, impacts the uncertainties in the 12N distribution and the precision of the range measurement. A potentially more robust approach, that would be worth further study, for retrieval of the short-lived contribution could involve a half-life analysis of the pixel values of dynamic images acquired during the beam-off period as implemented for dual-isotope imaging in standard PET imaging [85]. Such analysis can also be performed on the 1D profiles. A suitable model would comprise two components: a single exponential term for the 12N contribution and a constant for longer lived contributions. A foremost challenge, however, foreseen in this approach is its susceptibility to the low counting statistics observed during irradiation.
With the image subtraction technique used in this work, we measured the shifts in the activity profiles relative to a reference profile for range shifters of different thickness. The observed mean deviations from the ground truth are consistent with the precision for the respective number of 4He ions per pulse. The precision, as a function of the number of 4He ions per pulse, for measuring range shifts was evaluated by calculating the standard deviation of the measured shifts for several profiles using bootstrap sampling. It is clear from Figure 10 that increasing the number of helium ions per pulse results, as expected, in a better precision of the range shift measurement. The precision of the range measurement should be ideally better than 2 mm in order for it to be clinically relevant [86, 87]. For the delivery of a dose of 1 Gy during irradiations with protons, the most intense distal layer spot contains about 2 × 10⁸ protons [43]. Given the 4 times higher stopping power of 4He ions, the delivery of the same dose would require a conservative estimate of 4 × 10⁷ 4He ions in the highest weight distal layer spot. As such, the corresponding precision of 5.7 mm (1σ) for a single spot in this layer is poorer than the desired value of 2 mm. One approach to reach better statistics is to group neighboring spots together. By aggregating 10 distal layer spots, all containing a total of 4 × 10⁸ 4He ions, we calculate that the precision of range shift measurement using 12N, in an optimized irradiation condition, is 1.8 mm (1σ). For a precision of 2 mm to be clinically useful, the range accuracy (difference between measured dose range and dose range in the treatment plan) needs to be smaller than the precision.
The experimental results presented in this work apply to a scanner with a solid angle coverage of 29% and a pulsed irradiation with a beam pulse duration of 10 ms and a 3 ms delay between irradiation and data acquisition. We envision that in future clinical deployment, the range verification precision could be further improved by increasing the solid angle coverage of the scanner, reducing the pulse duration and minimizing the delay before data acquisition starts as much as possible. Table 3 shows the realizable precision for various scanner geometries, scanner panel separation distances and beam delivery and data acquisition time structures. The values given in Table 3 have been estimated using the inverse dependence of the precision on , where R represents the ratio of the 12N counts for the extrapolated system and the one used here. The ratio of the 12N counts seen by two different scanner geometries depends mainly on the solid angle coverage of the system provided that other factors are the same. These factors include the amount of beam-induced activity, intrinsic detector efficiency, the amount of attenuation in the target and the 511 keV net peak fraction. The values in Table 3 are thus valid for a 12-cm thick PMMA target (equivalent to 15 cm of water). Additional factors in precision of 1.15, 1.13, and 1.10 account for the additional count rate for (1) an optimal system with no PMT gain shift, (2) a reduction of the pulse duration from 10 to 3 ms and (3) elimination of the 3 ms delay before the start of the data acquisition, respectively. As seen in Table 3, for the highest weighted distal layer spot, a gain in precision by a factor of 2 is expected when imaging with a scanner having 56% solid angle coverage, optimized irradiation pulse duration and prompt data acquisition. Using such a scanner with an aggregation of 10 highly weighted distal layer spots, a precision of 0.9 mm (1σ) can be realized.
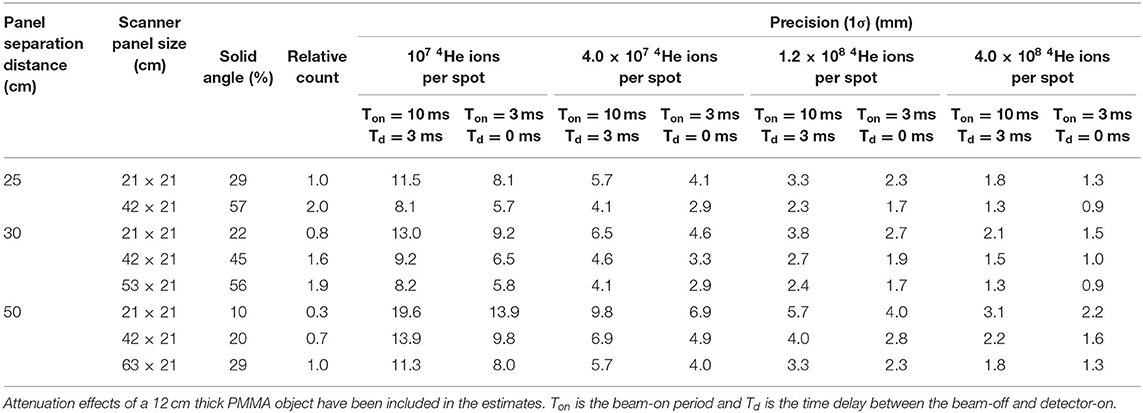
Table 3. Estimation of the precision for helium ion range measurement using various scanner geometries and time structures of beam delivery and data acquisition.
For in vivo verification purposes, the measured 12N activity range needs to be connected to the dose range, the clinically relevant quantity. The minimum distance between the edges of a positron emitter activity and the dose is the range of a helium beam with an energy equal to the threshold energy of the nuclear reaction leading to the positron emitter. The thresholds for the very short-lived positron emitters observed in this work (see Figure 5) are given in Table 2. Only the reaction channels with the lowest threshold energy are given. The lowest threshold energy, for the production of 18Ne on 16O, of 29.7 MeV represents a helium range in water of 0.7 mm. The other reactions have threshold energies from 50.6 to 75.4 MeV, corresponding to a helium range in water from 1.9 to 3.9 mm. The thresholds for production of 12N on 12C and 16O correspond to a helium range of 1.9–2.3 mm in water. When implementing 12N imaging in clinical practice, the distance between the activity and beam ranges will need to be determined with an accuracy and precision that is better than the 12N activity range uncertainty such that the overall beam range uncertainty is dominated by the experimental uncertainty in the 12N activity range. The uncertainty in the distance between the 12N activity range and beam range depends on the shape and the definition of the location of the distal edge of both the 12N activity and the dose profile. This requires that the shape of the reaction cross section at low energy is known. The shape of the dose distal edge, determined by the initial beam energy spread and the amount of energy straggling, follows from the treatment planning system (TPS) and will be as accurate as the dose calculation of the TPS. The way to implement this in clinical practice is to incorporate the energy dependence of the cross section with sufficient detail into the TPS and that way determine the relationship between the 12N activity range (which is measured) and the dose range (which is the clinically relevant quantity). To this end, the production cross sections of the relevant very short-lived positron emitters need to be determined in future work.
Clinical implementation of range verification based on 12N imaging will require a modification of the standard pencil beam delivery scheme in which beam spots are delivered as fast as possible in order to minimize the overall duration of the irradiation. 12N imaging of individual spots as we present in this work needs a beam pause of about 50 ms between spots. Having such pauses throughout a full irradiation would extend the duration too much. However, such a pause only makes sense for spots (or accumulation of some neighboring spots) that have sufficient intensity to give sufficiently accurate range information. This limits the introduction of beam pauses between spots to at most the few most distal layers. The extension of an irradiation can be further limited by introducing beam pauses only between distal layer spots located in carefully selected critical regions. This strategy of using so-called probe beams has in recent years been proposed by several authors [88–90]. It is expected that information from these spots can be used to assess the accuracy of the remaining spots in the treatment plan. The delivery scheme may thus be planned such that the beam is first delivered to these critical regions with sufficient beam-off time to measure the 12N decay. Depending on the outcome of this initial range verification, a decision can then be reached on the continuation of beam delivery or the implementation of corrective actions.
Imaging making use of the PET events from both the short and long-lived activities will enhance the count statistics and the range measurement precision. However, as an irradiation progresses, the events from the long-lived activities created during previously irradiated spots, layers and treatment fields, make real-time feedback impossible. Real-time feedback including the longer-lived activities shown in Figure 5, when using the image reconstruction method adopted in this study, works only in the very beginning of an irradiation. The 2D image reconstruction method is unable to discriminate positron annihilation events that originate from different lateral positions along the direction between the scanner panels. One way to disentangle these is event selection using a Time-of-Flight (ToF) system with a Coincidence Resolving Time (CRT) of at least 130 ps (given the 20 mm RMS 12N positron range) and verifying the spots or group of spots separated laterally by this distance. The use of PET scanners with significantly better CRT than the 550 ps of our present scanner is being considered to investigate the utility of ToF in the reconstruction.
The proof-of-principle of real-time range verification using short-lived positron emitters has been demonstrated for helium beam radiotherapy by irradiating PMMA targets. We showed that monitoring an irradiation on the basis of 12N activity imaging, at clinical beam intensity, is feasible and that near real-time feedback can be retrieved within 50 ms (i.e., 5 half-lives of 12N) into an irradiation. The attainable precision of range measurements was found to be promising for future clinical application. The range measurement precision with the most intense distal pencil beam spot of 4 × 10⁷ ions, using a scanner with a sensitivity of 2.2% at the center of the FoV and solid angle coverage of 29%, is 5.7 mm (1σ). By aggregating counts from 10 distal layer spots, further improvement by a factor of 3.2 [1.8 mm (1σ)] can be achieved. Aggregated imaging of 10 distal layer spots with a scanner of 56% solid angle coverage and beam spot durations much shorter than 10 ms will lead to a precision gain by a factor of 6.3 [0.9 mm (1σ)]. The increase of long-lived positron emitter activity as an irradiation progresses decreases the precision of real-time feedback via 12N imaging. In future studies, methods to reduce the effect of the long-lived nuclides will be explored. Furthermore, given the characteristic timescales of the fast component of biological washout in tissues occurring within several tens of seconds after production [91], the very short-lived nuclides utilized in this work are not susceptible to the washout effect.
The raw data supporting the conclusions of this article will be made available by the authors under reasonable request.
PD, IO, and SB: conceptual design of the experiments. MK and NZ: design and production of the detector modifications and support in scanner operations. IO, PD, EG, and M-JG: experiments. IO, PD, SB, EG, MK, NZ, and M-JG: critical revision of manuscripts. All authors contributed to the article and approved the submitted version.
The PET scanner used in this work was made available under a collaboration agreement between the University of Groningen and Siemens Healthcare Nederland B.V.
MK and NZ were employed by the company Siemens Medical Solutions. The authors declare that this study received funding from Siemens Medical Solutions. The funder had the following involvement with the study: the PET scanner with custom-modified detectors was provided and comments on the manuscript were given.
The authors would like to thank the following people for their contributions: F. Olivari and T. Rodriguez for their assistance during the experiments. P. Lemmens and S. Piersma for the design and production of the TTL switching box for PMT control. H. Kiewiet for assistance in installing the experimental setup at the irradiation hall and beam intensity calibrations. The operators of the AGOR cyclotron for stable beam operations.
1. Kempe J, Gudowska I, Brahme A. Depth absorbed dose and LET distributions of therapeutic 1H, 4He, 7Li, and 12C beams. Med Phys. (2006) 34:183–92. doi: 10.1118/1.2400621
2. Grün R, Friedrich T, Krämer M, Zink K, Durante M, Engenhart-Cabillic R, et al. Assessment of potential advantages of relevant ions for particle therapy: a model based study. Med Phys. (2015) 42:1037–47. doi: 10.1118/1.4905374
3. Tommasino F, Scifoni E, Durante M. New ions for therapy. Int J Particle Ther. (2015) 2:428–38. doi: 10.14338/IJPT-15-00027.1
4. Durante M, Paganetti H. Nuclear physics in particle therapy: a review. Rep Prog Phys. (2016) 79:096702. doi: 10.1088/0034-4885/79/9/096702
5. Knäusl B, Fuchs H, Dieckmann K, Georg D. Can particle beam therapy be improved using helium ions? – a planning study focusing on pediatric patients. Acta Oncol. (2016) 55:751–9. doi: 10.3109/0284186X.2015.1125016
6. Krämer M, Scifoni E, Schuy C, Rovituso M, Tinganelli W, Maier A, et al. Helium ions for radiotherapy? Physical and biological verifications of a novel treatment modality. Med Phys. (2016) 43:1995–2004. doi: 10.1118/1.4944593
7. Mairani A, Dokic I, Magro G, Tessonnier T, Kamp F, Carlson DJ, et al. Biologically optimized helium ion plans: calculation approach and its in vitro validation. Phys Med Biol. (2016) 61:4283–99. doi: 10.1088/0031-9155/61/11/4283
8. Tessonnier T, Mairani A, Chen W, Sala P, Cerutti F, Ferrari A, et al. Proton and helium ion radiotherapy for meningioma tumors: a Monte Carlo-based treatment planning comparison. Radiat Oncol. (2018) 13:2. doi: 10.1186/s13014-017-0944-3
9. Jermann M. Particle Therapy Patient Statistics (per end of 2018). Ptcog.ch. (2018). Available online at: https://ptcog.ch/images/patientstatistics/Patientstatistics-updateDec2018.pdf (accessed Febraury 25, 2020).
10. Saunders W, Castro JR, Chen GTY, Collier JM, Zink SR, Pitluck S, et al. Helium-ion radiation therapy at the lawrence berkeley laboratory: recent results of a northern california oncology group clinical trial. Radiat Res. (1985) 104:S227–34. doi: 10.2307/3576652
11. Castro JR, Char DH, Petti PL, Daftari IK, Quivey JM, Singh RP, et al. 15 years experience with helium ion radiotherapy for uveal melanoma. Int J Radiat Oncol Biol Phys. (1997) 39:989–96. doi: 10.1016/S0360-3016(97)00494-X
12. Tessonnier T, Mairani A, Brons S, Haberer T, Debus J, Parodi K. Experimental dosimetric comparison of 1H, 4He, 12C and 16O scanned ion beams. Phys Med Biol. (2017) 62:3958–82. doi: 10.1088/1361-6560/aa6516
13. Rovituso M, Schuy C, Weber U, Brons S, Cortés-Giraldo M, La Tessa C, et al. Fragmentation of 120 and 200 MeV u−1 4He ions in water and PMMA targets. Phys Med Biol. (2017) 62:1310–26. doi: 10.1088/1361-6560/aa5302
14. Lomax AJ. Intensity modulated proton therapy and its sensitivity to treatment uncertainties 1: the potential effects of calculational uncertainties. Phys Med Biol. (2008) 53:1027–42. doi: 10.1088/0031-9155/53/4/014
15. Paganetti H. Range uncertainties in proton therapy and the role of monte carlo simulations. Phys Med Biol. (2012) 57:R99–117. doi: 10.1088/0031-9155/57/11/R99
16. Albertini F, Hug EB, Lomax AJ. Is it necessary to plan with safety margins for actively scanned proton therapy? Phys Med Biol. (2011) 56:4399–13. doi: 10.1088/0031-9155/56/14/011
17. Unkelbach J, Bortfeld T, Martin BC, Soukup M. Reducing the sensitivity of IMPT treatment plans to setup errors and range uncertainties via probabilistic treatment planning. Med Phys. (2009) 36:149–63. doi: 10.1118/1.3021139
18. Unkelbach J, Chan TCY, Bortfeld T. Accounting for range uncertainties in the optimization of intensity modulated proton therapy. Phys Med Biol. (2007) 52:2755–73. doi: 10.1088/0031-9155/52/10/009
19. Pflugfelder D, Wilkens J, Oelfke U. Worst case optimization: a method to account for uncertainties in the optimization of intensity modulated proton therapy. Phys Med Biol. (2008) 53:1689–700. doi: 10.1088/0031-9155/53/6/013
20. Fredriksson A, Forsgren A, Hårdemark B. Minimax optimization for handling range and setup uncertainties in proton therapy. Med Phys. (2011) 38:1672–84. doi: 10.1118/1.3556559
21. Unkelbach J, Paganetti H. Robust proton treatment planning: physical and biological optimization. Semin Radiat Oncol. (2018) 28:88–96. doi: 10.1016/j.semradonc.2017.11.005
22. Unkelbach J, Alber M, Bangert M, Bokrantz R, Chan TCY, Deasy JO, et al. Robust radiotherapy planning. Phys Med Biol. (2018) 63:22TR02. doi: 10.1088/1361-6560/aae659
23. Knopf A, Lomax A. In vivo proton range verification: a review. Phys Med Biol. (2013) 58:R131–60. doi: 10.1088/0031-9155/58/15/R131
24. Hünemohr N, Krauss B, Dinkel J, Gillmann C, Ackermann B, Jäkel O, et al. Ion range estimation by using dual energy computed tomography. Zeitschrift Medizinische Physik. (2013) 23:300–13. doi: 10.1016/j.zemedi.2013.03.001
25. Bär E, Lalonde A, Royle G, Lu HM, Bouchard H. The potential of dual-energy CT to reduce proton beam range uncertainties. Med Phys. (2017) 44:2332–44. doi: 10.1002/mp.12215
26. van Elmpt W, Landry G, Das M, Verhaegen F. Dual energy CT in radiotherapy: current applications and future outlook. Radiother Oncol. (2016) 119:137–44. doi: 10.1016/j.radonc.2016.02.026
27. Huesman RH, Rosenfeld AH, Solmitz FT. Comparison of Heavy Charged Particles and X-Rays for Axial Tomograpic Scanning. Davis, CA: California Univ Davis; Dept of Engineering (1975). doi: 10.2172/4146950
28. Esposito M, Waltham C, Taylor JT, Manger S, Phoenix B, Price T, et al. PRaVDA: the first solid-state system for proton computed tomography. Phys Med. (2018) 55:149–54. doi: 10.1016/j.ejmp.2018.10.020
29. Volz L, Piersimoni P, Bashkirov VA, Brons S, Collins-Fekete CA, Johnson RP, et al. The impact of secondary fragments on the image quality of helium ion imaging. Phys Med Biol. (2018) 63:195016. doi: 10.1088/1361-6560/aadf25
30. Parodi K, Polf J. In vivo range verification in particle therapy. Med Phys. (2018) 45:e1036–50. doi: 10.1002/mp.12960
31. Parodi K. In vivo dose verificatio. In: Paganetti H, editor. Proton Therapy PhysicsBoca. Raton, FL: CRC Press (2011). p. 489–524. doi: 10.1201/b11448-17
32. Maccabee HD, Madhvanath U, Raju MR. Tissue activation studies with alpha-particle beams. Phys Med Biol. (1969) 14:213–24. doi: 10.1088/0031-9155/14/2/304
33. Bennett GW, Goldberg AC, Levine GS, Guthy J, Balsamo J, Archambeau JO. Beam localization via 15O activation in proton-radiation therapy. Nucl Inst Methods. (1975) 125:333–8. doi: 10.1016/0029-554X(75)90246-3
34. Paans AMJ, Schippers JM. Proton therapy in combination with PET as monitor: a feasibility study. IEEE Trans Nucl Sci. (1993) 40:1041–4. doi: 10.1109/23.256709
35. Nishio T, Miyatake A, Ogino T, Nakagawa K, Saijo N, Esumi H. The development and clinical use of a beam ON-LINE PET system mounted on a rotating gantry port in proton therapy. Int J Radiat Oncol Biol Phys. (2010) 76:277–86. doi: 10.1016/j.ijrobp.2009.05.065
36. Enghardt W, Crespo P, Fiedler F, Hinz R, Parodi K, Pawelke J, et al. Charged hadron tumour therapy monitoring by means of PET. Nucl Inst Methods Phys Res Sect A. (2004) 525:284–88. doi: 10.1016/j.nima.2004.03.128
37. Studenski MT, Xiao Y. Proton therapy dosimetry using positron emission tomography. World J Radiol. (2010) 2:135. doi: 10.4329/wjr.v2.i4.135
38. Fiedler F, Kunath D, Priegnitz M, Enghardt W. Online irradiation control by means of PET. In: Linz U, editor. Ion Beam Therapy. Berlin: Springer (2012). p. 527. doi: 10.1007/978-3-642-21414-1_31
39. Zhu X, El Fakhri G. Proton therapy verification with PET imaging. Theranostics. (2013) 3:731–40. doi: 10.7150/thno.5162
40. Min CH, Kim CH, Youn MY, Kim JW. Prompt gamma measurements for locating the dose falloff region in the proton therapy. Appl Phys Lett. (2006) 89:183517. doi: 10.1063/1.2378561
41. Polf JC, Peterson S, Ciangaru G, Gillin M, Beddar S. Prompt gamma-ray emission from biological tissues during proton irradiation: a preliminary study. Phys Med Biol. (2009) 54:731–43. doi: 10.1088/0031-9155/54/3/017
42. Testa E, Bajard M, Chevallier M, Dauvergne D, Le Foulher F, Freud N, et al. Monitoring the Bragg peak location of 73 MeV/u carbon ions by means of prompt γ-ray measurements. Appl Phys Lett. (2008) 93:093506. doi: 10.1063/1.2975841
43. Smeets J, Roellinghoff F, Prieels D, Stichelbaut F, Benilov A, Busca P, et al. Prompt gamma imaging with a slit camera for real-time range control in proton therapy. Phys Med Biol. (2012) 57:3371–405. doi: 10.1088/0031-9155/57/11/3371
44. Golnik C, Hueso-González F, Müller A, Dendooven P, Enghardt W, Fiedler F, et al. Range assessment in particle therapy based on prompt γ -ray timing measurements. Phys Med Biol. (2014) 59:5399–422. doi: 10.1088/0031-9155/59/18/5399
45. Perali I, Celani A, Bombelli L, Fiorini C, Camera F, Clementel E, et al. Prompt gamma imaging of proton pencil beams at clinical dose rate. Phys Med Biol. (2014) 59:5849–71. doi: 10.1088/0031-9155/59/19/5849
46. Hueso-González F, Fiedler F, Golnik C, Kormoll T, Pausch G, Petzoldt J, et al. Compton camera and prompt gamma ray timing: two methods for in vivo range assessment in proton therapy. Front Oncol. (2016) 6:80. doi: 10.3389/fonc.2016.00080
47. Xie Y, Bentefour EH, Janssens G, Smeets J, Vander Stappen F, Hotoiu L, et al. Prompt gamma imaging for in-vivo range verification of pencil beam scanning proton therapy Int J Radiat Oncol Biol Phys. (2017) 99:210–8. doi: 10.1016/j.ijrobp.2017.04.027
48. Hueso-González F, Rabe M, Ruggieri TA, Bortfeld T, Verburg JM. A full-scale clinical prototype for proton range verification using prompt gamma-ray spectroscopy. Phys Med Biol. (2018) 63:185019. doi: 10.1088/1361-6560/aad513
49. Krimmer J, Dauvergne D, Létang JM, Testa É. Prompt-gamma monitoring in hadrontherapy: a review. Nuclear Inst Methods Phys Res Sect A. (2018) 878:58–73. doi: 10.1016/j.nima.2017.07.063
50. Rucinski A, Battistoni G, Collamati F, De Lucia E, Faccini R, Frallicciardi PM, et al. Secondary radiation measurements for particle therapy applications: charged particles produced by 4He and 12C ion beams in a PMMA target at large angle. Phys Med Biol. (2018) 63:055018. doi: 10.1088/1361-6560/aaa36a
51. Henriquet P, Testa E, Chevallier M, Dauvergne D, Dedes G, Freud N, et al. Interaction vertex imaging (IVI) for carbon ion therapy monitoring: a feasibility study. Phys Med Biol. (2012) 57:4655–69. doi: 10.1088/0031-9155/57/14/4655
52. Gwosch K, Hartmann B, Jakubek J, Granja C, Soukup P, Jäkel O, et al. Non-invasive monitoring of therapeutic carbon ion beams in a homogeneous phantom by tracking of secondary ions. Phys Med Biol. (2013) 58:3755–73. doi: 10.1088/0031-9155/58/11/3755
53. Hayakawa Y, Tada J, Arai N, Hosono K, Sato M, Wagai T, et al. Acoustic pulse generated in a patient during treatment by pulsed proton radiation beam. Radiat Oncol Invest. (1995) 3:42–45. doi: 10.1002/roi.2970030107
54. Patch SK, Santiago-Gonzalez D, Mustapha B. Thermoacoustic range verification in the presence of acoustic heterogeneity and soundspeed errors –Robustness relative to ultrasound image of underlying anatomy. Med Phys. (2019) 46:318–27. doi: 10.1002/mp.13256
55. Kellnberger S, Assmann W, Lehrack S, Reinhardt S, Thirolf P, Queirós D, et al. Ionoacoustic tomography of the proton Bragg peak in combination with ultrasound and optoacoustic imaging. Sci Rep. (2016) 6:29305. doi: 10.1038/srep29305
56. Lehrack S, Assmann W, Bertrand D, Henrotin S, Herault J, Heymans V, et al. Submillimeter ionoacoustic range determination for protons in water at a clinical synchrocyclotron. Phys Med Biol. (2017) 62:L20–30. doi: 10.1088/1361-6560/aa81f8
57. Jones KC, Nie W, Chu JCH, Turian JV, Kassaee A, Sehgal M, et al. Acoustic-based proton range verification in heterogeneous tissue: simulation studies. Phys Med Biol. (2018) 63:025018. doi: 10.1088/1361-6560/aa9d16
58. Parodi K, Ponisch F, Enghardt W. Experimental study on the feasibility of in-beam PET for accurate monitoring of proton therapy. IEEE Trans Nucl Sci. (2005) 52:778–86. doi: 10.1109/TNS.2005.850950
59. Pennazio F, Battistoni G, Bisogni MG, Camarlinghi N, Ferrari A, Ferrero V, et al. Carbon ions beam therapy monitoring with the INSIDE in-beam PET. Phys Med Biol. (2018) 63:145018. doi: 10.1088/1361-6560/aacab8
60. Min CH, Zhu X, Winey BA, Grogg K, Testa M, El Fakhri G, et al. Clinical application of in-room positron emission tomography for in vivo treatment monitoring in proton radiation therapy. Int J Radiat Oncol Biol Phys. (2013) 86:183–9. doi: 10.1016/j.ijrobp.2012.12.010
61. Min CH, Zhu X, Grogg K, El Fakhri G, Winey B, Paganetti H. A recommendation on how to analyze in-room PET for in vivo proton range verification using a distal PET surface method. Technol Cancer Res Treat. (2015) 14:320–5. doi: 10.1177/1533034614547457
62. Parodi K, Paganetti H, Shih HA, Michaud S, Loeffler JS, DeLaney TF, et al. Patient study of in vivo verification of beam delivery and range, using positron emission tomography and computed tomography imaging after proton therapy. Int J Radiat Oncol Biol Phys. (2007) 68:920–34. doi: 10.1016/j.ijrobp.2007.01.063
63. Nishio T, Miyatake A, Inoue K, Gomi-Miyagishi T, Kohno R, Kameoka S, et al. Experimental verification of proton beam monitoring in a human body by use of activity image of positron-emitting nuclei generated by nuclear fragmentation reaction. Radiol Phys Technol. (2008) 1:44–54. doi: 10.1007/s12194-007-0008-8
64. Knopf AC, Parodi K, Paganetti H, Bortfeld T, Daartz J, Engelsman M, et al. Accuracy of proton beam range verification using post-treatment positron emission tomography/computed tomography as function of treatment site. Int J Radiat Oncol Biol Phys. (2011) 79:297–304. doi: 10.1016/j.ijrobp.2010.02.017
65. Nischwitz SP, Bauer J, Welzel T, Rief H, Jäkel O, Haberer T, et al. Clinical implementation and range evaluation of in vivo PET dosimetry for particle irradiation in patients with primary glioma. Radiother Oncol. (2015) 115:179–85. doi: 10.1016/j.radonc.2015.03.022
66. Shakirin G, Braess H, Fiedler F, Kunath D, Laube K, Parodi K, et al. Implementation and workflow for PET monitoring of therapeutic ion irradiation: a comparison of in-beam, in-room, and off-line techniques. Phys Med Biol. (2011) 56:1281–98. doi: 10.1088/0031-9155/56/5/004
67. Dendooven P, Buitenhuis HJT, Diblen F, Heeres PN, Biegun AK, Fiedler F, et al. Short-lived positron emitters in beam-on PET imaging during proton therapy. Phys Med Biol. (2015) 60:8923–47. doi: 10.1088/0031-9155/60/23/8923
68. Dendooven P, Buitenhuis HJT, Diblen F, Heeres PN, Biegun AK, Fiedler F, et al. Corrigendum: short-lived positron emitters in beam-on PET imaging during proton therapy (2015 Phys. Med. Biol. 60 8923). Phys Med Biol. (2019) 64:129501. doi: 10.1088/1361-6560/ab23d7
69. Buitenhuis HJT, Diblen F, Brzezinski KW, Brandenburg S, Dendooven P. Beam-on imaging of short-lived positron emitters during proton therapy. Phys Med Biol. (2017) 62:4654–72. doi: 10.1088/1361-6560/aa6b8c
70. Ozoemelam I, van der Graaf E, van Goethem M-J, Kapusta M, Zhang N, Brandenburg S, et al. Feasibility of quasi-prompt PET-based range verification in proton therapy. Phys Med Biol. (2020). doi: 10.1088/1361-6560/aba504. [Epub ahead of print].
71. Kraan AC, Battistoni G, Belcari N, Camarlinghi N, Ciocca M, Ferrari A, et al. Online monitoring for proton therapy: a real-time procedure using a planar PET system. Nucl Instrum Methods Phys Res Sect A. (2015) 786:120–6. doi: 10.1016/j.nima.2015.03.059
72. Tashima H, Yoshida E, Inadama N, Nishikido F, Nakajima Y, Wakizaka H, et al. Development of a small single-ring OpenPET prototype with a novel transformable architecture. Phys Med Biol. (2016) 61:1795–809. doi: 10.1088/0031-9155/61/4/1795
73. Yoshida E, Tashima H, Shinaji T, Shimizu K, Wakizaka H, Mohammadi A, et al. Development of a whole-body dual ring OpenPET for in-beam PET. IEEE Trans Radiat Plasma Med Sci. (2017) 1:293–300. doi: 10.1109/TRPMS.2017.2703823
74. Crespo P, Barthel T, Frais-Kolbl H, Griesmayer E, Heidel K, Parodi K, et al. Suppression of random coincidences during in-beam PET measurements at ion beam radiotherapy facilities. IEEE Trans Nucl Sci. (2005) 52:980–7. doi: 10.1109/TNS.2005.852637
75. Fiedler F, Crespo P, Parodi K, Sellesk M, Enghardt W. The feasibility of in-beam PET for therapeutic beams of 3He. IEEE Trans Nucl Sci. (2006) 53:2252–9. doi: 10.1109/TNS.2006.877854
76. Bauer J, Tessonnier T, Debus J, Parodi K. Offline imaging of positron emitters induced by therapeutic helium, carbon and oxygen ion beams with a full-ring PET/CT scanner: experiments in reference targets. Phys Med Biol. (2019) 64:225016. doi: 10.1088/1361-6560/ab48b4
77. Mattei I, Bini F, Collamati F, Lucia ED, Frallicciardi PM, Iarocci E, et al. Secondary radiation measurements for particle therapy applications: prompt photons produced by 4 He, 12 C and 16 O ion beams in a PMMA target. Phys Med Biol. (2017) 62:1438. doi: 10.1088/1361-6560/62/4/1438
78. Dal Bello R, Magalhaes Martins P, Graça J, Hermann G, Kihm T, Seco J. Results from the experimental evaluation of CeBr scintillators for He prompt gamma spectroscopy. Med Phys. (2019) 46:3615–26. doi: 10.1002/mp.13594
79. Ozoemelam I, van der Graaf E, Brandenburg S, Dendooven P. The production of positron emitters with millisecond half-life during helium beam radiotherapy. Phys Med Biol. (2019) 64:235012. doi: 10.1088/1361-6560/ab51c3
80. Ziegler J, Ziegler M, Biersack J. SRIM—the stopping and range of ions in matter. Nucl Instrum Methods Phys Res B. (2010) 268:1818–23. doi: 10.1016/j.nimb.2010.02.091
81. Hueso-González F, Biegun AK, Dendooven P, Enghardt W, Fiedler F, Golnik C, et al. Comparison of LSO and BGO block detectors for prompt gamma imaging in ion beam therapy. J Inst. (2015) 10:P09015. doi: 10.1088/1748-0221/10/09/P09015
82. Shepp LA, Vardi Y. Maximum likelihood reconstruction for emission tomography. IEEE Trans Med Imaging. (1982) 1:113–22. doi: 10.1109/TMI.1982.4307558
83. Knopf A, Parodi K, Paganetti H, Cascio E, Bonab A, Bortfeld T. Quantitative assessment of the physical potential of proton beam range verification with PET/CT. Phys Med Biol. (2008) 53:4137–51. doi: 10.1088/0031-9155/53/15/009
84. Efron B. Bootstrap methods: another look at the jackknife. Ann Stat. (1979) 7:1–26. doi: 10.1214/aos/1176344552
85. Huang SC, Carson RE, Hoffman EJ, Kuhl DE, Phelps ME. An investigation of a double-tracer technique for positron computerized tomography. J Nucl Med. (1982) 23:816–22.
86. Parodi K. On- and off-line monitoring of ion beam treatment. Nucl Instrum Methods Phys Res Sect A. (2016) 809:113–9. doi: 10.1016/j.nima.2015.06.056
87. Pausch G, Berthold J, Enghardt W, Römer K, Straessner A, Wagner A, et al. Detection systems for range monitoring in proton therapy: needs and challenges. Nucl Instrum Methods Phys Res Sect A. (2020) 954:161227. doi: 10.1016/j.nima.2018.09.062
88. Chen M, Zhong Y, Shao Y, Jiang S, Lu W. Mid-range probing—towards range-guided particle therapy. Phys Med Biol. (2018) 63:13NT01. doi: 10.1088/1361-6560/aaca1b
89. Mumot M, Algranati C, Hartmann M, Schippers JM, Hug E, Lomax AJ. Proton range verification using a range probe: definition of concept and initial analysis. Phys Med Biol. (2010) 55:4771–82. doi: 10.1088/0031-9155/55/16/010
90. Hammi A, Koenig S, Weber DC, Poppe B, Lomax AJ. Patient positioning verification for proton therapy using proton radiography. Phys Med Biol. (2018) 63:245009. doi: 10.1088/1361-6560/aadf79
Keywords: helium ion therapy, range uncertainties, N-12 production, imaging, dose delivery verification
Citation: Ozoemelam I, van der Graaf E, van Goethem M-J, Kapusta M, Zhang N, Brandenburg S and Dendooven P (2020) Real-Time PET Imaging for Range Verification of Helium Radiotherapy. Front. Phys. 8:565422. doi: 10.3389/fphy.2020.565422
Received: 25 May 2020; Accepted: 28 August 2020;
Published: 06 October 2020.
Edited by:
Marco Durante, GSI Helmholtz Center for Heavy Ion Research, GermanyReviewed by:
Maria Giuseppina Bisogni, University of Pisa, ItalyCopyright © 2020 Ozoemelam, van der Graaf, van Goethem, Kapusta, Zhang, Brandenburg and Dendooven. This is an open-access article distributed under the terms of the Creative Commons Attribution License (CC BY). The use, distribution or reproduction in other forums is permitted, provided the original author(s) and the copyright owner(s) are credited and that the original publication in this journal is cited, in accordance with accepted academic practice. No use, distribution or reproduction is permitted which does not comply with these terms.
*Correspondence: Ikechi Ozoemelam, aWtlY2hpc2FtdWVsQGdtYWlsLmNvbQ==
Disclaimer: All claims expressed in this article are solely those of the authors and do not necessarily represent those of their affiliated organizations, or those of the publisher, the editors and the reviewers. Any product that may be evaluated in this article or claim that may be made by its manufacturer is not guaranteed or endorsed by the publisher.
Research integrity at Frontiers

Learn more about the work of our research integrity team to safeguard the quality of each article we publish.