 Alonso Saldaña-Heredia1*
 Víctor Martínez-Calzada1Pedro Antonio Márquez-Aguilar2
 Daniel Hernández-Cruz3
- 1Universidad Politécnica Metropolitana de Hidalgo, Tolcayuca, Mexico
- 2Universidad Autónoma del Estado de Morelos, Cuernavaca, Mexico
- 3Universidad Autónoma de Chiapas, Tuxtla Gutiérrez, Mexico
We present a simple but accurate correlation between an experimental characterization and a simple analytical prediction of a wave propagation induced by the impact of a pendulum in a box filled with fine sand; this research is based on optical measurements and was carried out using the digital image correlation technique to determine the motion on the surface of the box visually observed by the reflection of the laser. We suggest that the reaction to the impact in the body will be similar to an equivalent damped mass-spring system, obtaining an average error of 3.67208 × 10⁻⁴.
1. Introduction
Laser-based measurements have been widely used over the years with different arrays and applications; those optical systems can measure through destructive and non-destructive procedures [1–4]. This paper is focused on a non-destructive technique that helps to calculate the relative motion using a laser light reflection adopting an image-matching methodology.
According to Snell's law, when a laser beam is reflected on a mirror-like surface at a certain angle, its reflection comes out at the same angle as the incident one [5]. But when the surface is rough, the reflection comes out as a speckle pattern [6]. One of the non-destructive methods was developed by studying this phenomenon with a simple image matching procedure called Cross-Correlation (CC), and it can be performed either in physical space [7, 8] or in Fourier space, as the use of Fast Fourier Transforms (FFT) helps to evaluate the CC function quickly [9]. Anuta took advantage of the high speed of the FFT algorithm when carrying out digital multispectral and multi-temporal statistical pattern recognition [10]. Kuglin and Hines observed that information about the displacement of one image to another is included in the phase component of the cross-power spectrum of the images [11]. Correlation techniques were applied when analyzing the strain evolution of a rubber-like material under multi-axial stresses [12]; they were also applied for strain measurements using a Vic 2D system to obtain the strain diagram of a compound material [13], and the displacement field in steel was measured using a resistance heating tensile test [14].
In 1993, a group presented an approach that attempted to analytically predict the material damage to an impact [15]. Another research study showed the use of a pendulum device to evaluate the energy and impulse transferred to structures by detonating explosives [16]. In the same way, research about pendulum impact testing was applied to evaluate a specific section of a barrier [17]; tests allowed them to understand the performance of the barrier and when it attained considerable damage. Additionally, research using optical techniques was used to understand the behavior during the impact test of chrome steel spheres over steel and copper plates [18]; they applied stereo digital speckle photography.
On the other hand, it is well-known that characterization of impact phenomena is a very difficult task, even in the field of low-velocity impacts (when there is almost no strain rate effect). Such difficulty arises from designations that are not homogeneous for all authors, i.e., for common sense, the “hardness” and the “softness” of an object are relative [19]. In this way, impact phenomena descriptions can be stated in different manners; for instance, there are researchers interested in the wave propagation phenomena when the impact takes place, describing the interaction between the soft impactor and a rigid surface or explaining the shockwave propagating inwards or outwards of one or both objects in contact [20, 21]. Others prefer to study changes in forces, energy, and material properties before, during, and after the impact occurs [22]. In this study, we used a simple optical non-destructive technique and an analytical model, which can help us to understand the reaction of an object when it is struck with a pendulum. The model proposed is a damped single-degree-of-freedom system, which is not adequate to describe wave interactions or reverberations caused by the impact but is good enough to model and describe the rigid body motion, as can be seen in the results section. To characterize this impact response, a laser was used as a light source, and the speckle pattern was generated by its reflection. This pattern was then captured by a digital camera to produce 2D images. These images were processed using Digital Image Correlation. After this image-matching procedure, we obtained a representation of the media reaction to a pendulum impact. Once data were obtained, we applied the Gauss-Newton and least square methods to the curve fitting with a nonlinear function.
2. Methodology
2.1. Optical Measurement
In this research, we implemented an optical technique that uses a laser as a light source. It is well known that laser light has physical properties such as a unidirectional wave, a specific wavelength, and a finite cross-section [23]. According to the transverse mode, the laser used for this research has a Gaussian intensity distribution [24], which is described as follows:
where I0 and ω0 are related to the initial intensity, which is a function of the radial distance r = (x2+y2)1/2 and the beam waist at z = 0. Figure 1 shows the intensity distribution when z = 0. The parameters ω(z) and R(z) depend on the propagation axis z—they are related to the beam spot size and the wave front radius of the curvature [25]. In this research, the laser beam propagates through an optical lens with a defined focal length f, and this transmittance is proportional to exp(kr2/2f) [26], where k is the wave-vector. We can therefore write
When laser light is focused, it strikes a rough material; as the majority of the surfaces are extremely rough on the scale of an optical wavelength, the intensity reflected back of such surfaces results in interference of scattered components that form a granular pattern that is known as the speckle pattern [27]. As this pattern was produced from a laser source, its intensity distribution can be expressed:
with σ2 defined by
where ak is an independent amplitude for each speckle, and I is the intensity given by the sum of the squared real and imaginary part of the field [27]. As the number of speckles N is very large, the amplitudes are asymptotically Gaussian since it follows the central limit theorem [28].
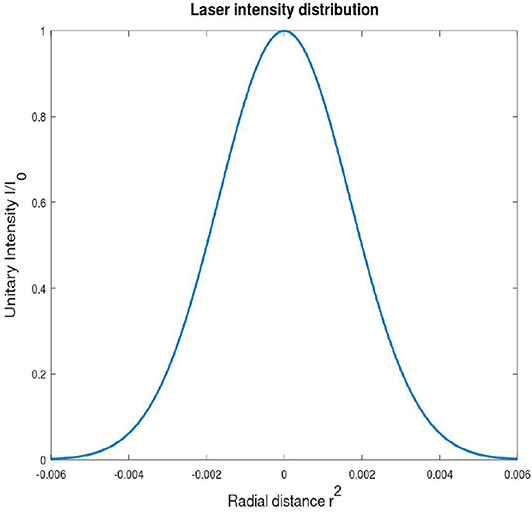
Figure 1. The intensity distribution of a laser when TEM00 and z=0.
2.2. Metrology System
Following the speckle generated, in this section, the reflection will be treated as a 2D image. Image matching is a discipline of computer vision that is of central importance to many practical applications, such as stress-strain, flow, and medical issues [29].
Digital Image Correlation is one of the most commonly applied procedures based on image matching; it is an optical method that examines image data along with a physical phenomenon. It consists of capturing consecutive images with a digital camera to evaluate the change in surface characteristics and helps to understand the behavior of the specimen while it is subjected to any change, such as consecutive stress, an external force, vibration, etc. [30, 31].
First, let us consider a pair of 2D images A and B, where A represents the reference image and B the deformed image. To evaluate the correlation between them using the Fourier domain it follows that
where −1 implies a 2D inverse Fourier transform, F is the Fourier transform of the first image, and G* is the complex conjugate Fourier transform of the second [12, 14, 32].
In this research, the displacement field (Df) is calculated:
where M, and are related to image size, the standard deviation of A and B, respectively. By performing this procedure, normalization is carried out, assuming a totally Gaussian intensity distribution in the speckle pattern [32, 33].
2.3. Theoretical Analysis
We are applying impacts generated with a pendulum; this harmonic wave can be modeled through the following differential equation:
where m is the mass of the object, g is the action of gravity on Earth, and l is the length of the chord [34].
When impact takes place, the system will react to it. We thus propose that it will move as a damped oscillator, i.e., describing a forced damped motion in the impact direction (see Figure 2). Assuming that the impact can be modeled as a Dirac δ-function, then the motion is described as
where P denotes de magnitude of impact force, P = mgsin(θ), and we suggest that this force is associated with the pendulum movement. The solution of (8) is therefore
The nonlinear model can be expanded with a Taylor series of function x(t, m, c, k)
where parameters m, c and k in the argument were omitted; j is the initial value and j + 1 a new estimate. Δ(*) = (*)j+1 − (*)j. Clearly, the expansion was truncated after first derivatives, and the equation has now been linearized with respect to m, c, and k. Substituting (11) in (10)
Using matrix notation, (12) is rewritten as
where Zj is a matrix with the partial derivatives of function at the initial value j. Vector D contains the difference between data and function values, vector A represents parameter values, i.e.,
where n is the number of data. After applying the least square method to Equation (14), we obtain
In this way, we solve for A (parameters vector) until a specified tolerance is attained. In this study we use a tolerance defined as
If we assume that the data is a true solution and function x(t, m, c, k) is the analytical approach, it is then possible to calculate the error E as the sum of the squares of the residuals [35]:
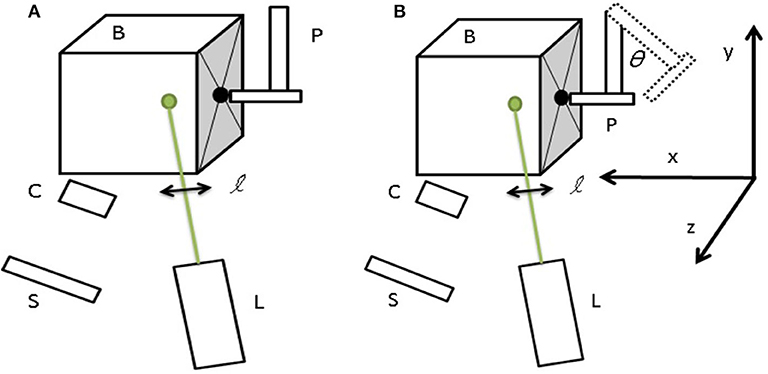
Figure 2. Experimental setup: (A) Sample totally still at t = 0, (B) Characterization of the pendulum impact.
3. Experimental Setup and Data Processing
A box (B) with dimensions of 25 × 27 × 45 cm was made from galvanized smooth sheet caliber 261; it was filled with fine sand reaching a total mass of 33 kg and was used to propagate five pendulum impacts across it. All impacts were induced using a 0.575 kg mass at an initial angle θ = 30° with a pendulum (P) with 30 cm chord length. Figure 2 schematically represents our experimental setup. The output of a Diode-Pumped Solid-State laser (L), with a wavelength λ=532 nm and power of 220 mW2, is placed 40 cm from the box, and the laser beam propagates through a converging lens (ℓ) with a focal length of f=7 cm that is placed at this distance—far from (B)—to focus the beam light on a specific area. Subsequently, the scattering generated is reflected in a screen (S), which is placed in front of the box at 40 cm; the box is completely still, and it is then impacted with a pendulum in the perpendicular face, as seen in Figure 2. While this action is taking place, the speckles generated are recorded with a video camera (C) that is placed in front of the screen, slightly off from the propagation axis. In the following illustration, it can be observed that the pendulum at a position t0 (dashed object) and at position t1 (solid line object).
Pendulum impacts are generated along the x axis, and the laser beam irradiates across the z axis and hits at an initial height in y axis. The video camera used for this experiment can record at a rate of 240 frames per second with a 1,980 × 1,080 image resolution, and it has a pixel size of 1.2 μm. Once the video is recorded, Video to JPG free software3 was used to convert the video into single JPG images by splitting it in each frame. A program was written in Octave® to perform Digital Image Correlation (DIC). In Figure 3, part of the procedure is described: image loading (Figure 3A), the treatment to gray scale (Figure 3B), and the crop of the region of interest in Figure 3C.
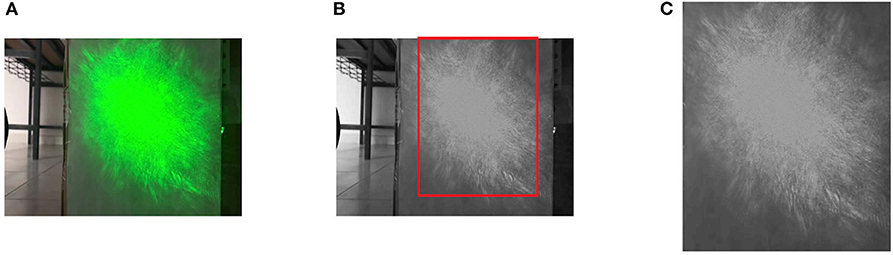
Figure 3. Image processing: (A) Speckle reflection, (B) Gray-scale image, and (C) Region of interest.
Once digital image processing has been performed, we follow Equations (5, 6). Those equations give us a matrix-type result, and we thus define the maximum amplitude point logically. As this is an iteratively process, from the second to the n image, those peak amplitudes are plot as scalar values measured in millimeters according to [33].
4. Results and Discussion
The data that were recorded experimentally and the analytical approximations, both explained previously, are presented in this section. Data are shown by broken lines in all figures together with smooth model approximation. It is clearly seen that abrupt changes in its slope are recorded perfectly in our optical metrology system; however, our analytical approximation is not able to reproduce all these small variations, though total motion is restored flawlessly. In Figures 4–8, we show the obtained results:
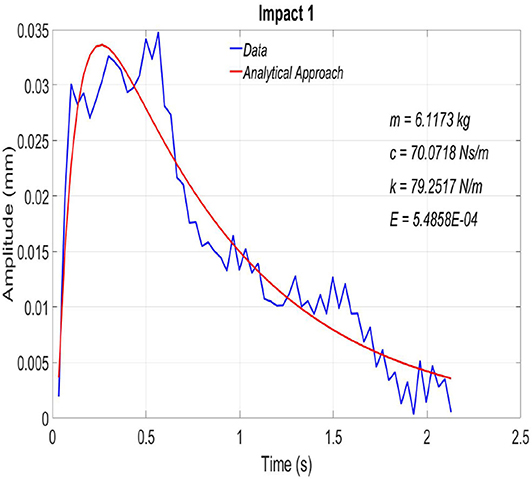
Figure 4. Test 1, Optical characterization (blue) and Analytical results (red).
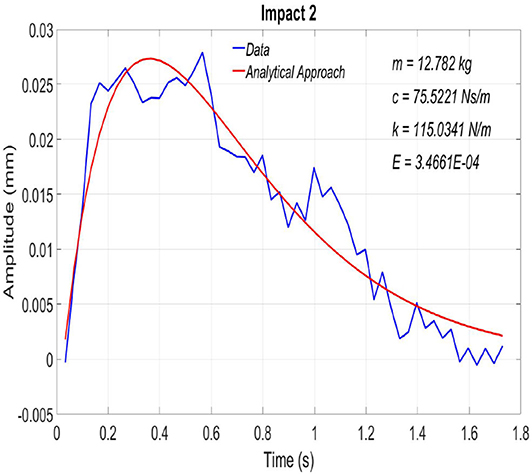
Figure 5. Test 2, Optical characterization (blue) and Analytical results (red).
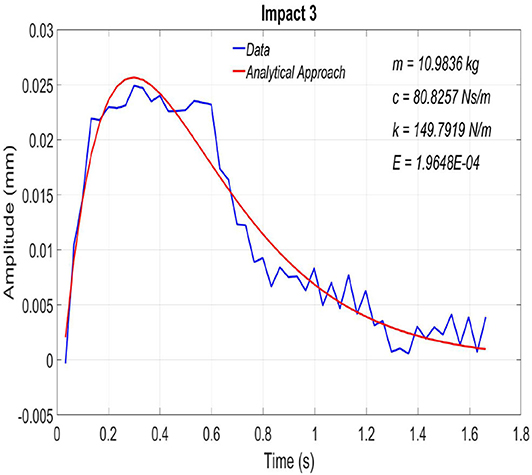
Figure 6. Test 3, Optical characterization (blue) and Analytical results (red).
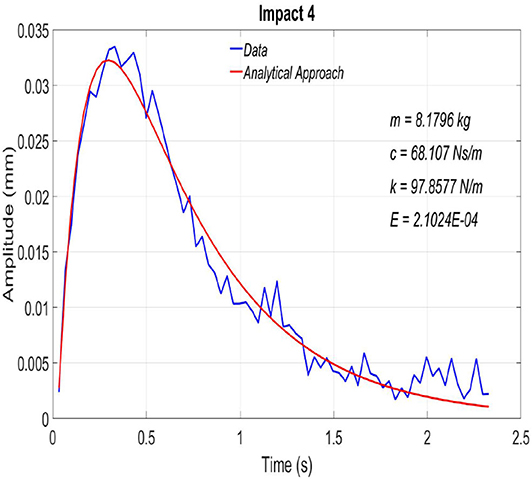
Figure 7. Test 4, Optical characterization (blue) and Analytical results (red).
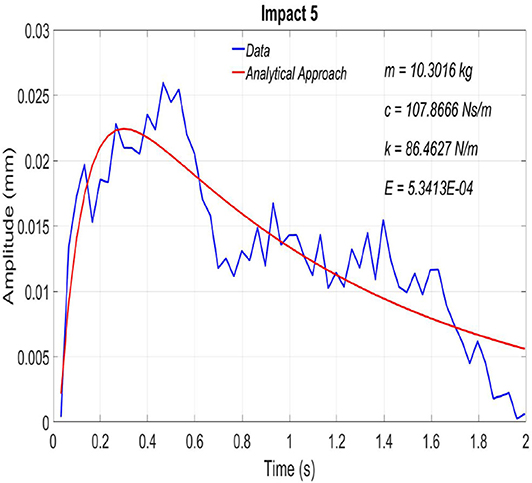
Figure 8. Test 5, Optical characterization (blue) and Analytical results (red).
In this first approach, the sampling time for this impact reaction was about 2.1 s. Here we obtained the smallest mass in the equivalent damped mass-spring system. It can be observed that during the whole time interval, the measured motion is rightly reproduced with the proposed analytical procedure. According to this result, the analytical approach therefore clearly corresponds to the optical characterization. Based on the error definition, this is the worst analytical approximation.
For the second test, the elapsed time for the impact reaction was around 1.7 s. The calculated equivalent mass in this test was the biggest. The amplitude displacement is around 0.027 mm, and although data present important peaks, the analytical approach fits the motion. Again, the proposed model describes the phenomenon studied.
The duration for the third test was near 1.7 s as well, and, according to the defined error, this is the best approximation. As can be seen, data show broken behavior; however, the analytical approach overlaps the data during the last 0.7 s of this interval. Once more, the optical measurements are closely modeled by the analytical approach.
The elapsed time for the fourth test was a little bit longer than the other ones, 2.3 s. At a glance, it seems to be the best analytical approach; in the middle and last part of the time interval, however, a gap was observed between data and the analytical approach.
Similarly, as in the first test, this seems to be the worst analytical approach; however, it seems to be the case that the error is just a little bit smaller. Important gaps can, however, be seen between the data and analytical approach during the whole time interval.
Table 1 summarizes the obtained values for all tests done. We can observe that the equivalent mass mean value is 9.672 kg, in which impacts 1 and 2 have the greatest deviation (± 3 kg). For the viscous damping coefficient, the fifth test is the only impact out of the mean value. We can, however, observe that all experimental results are congruent to the analytical model, recalling that we are assuming a rigid body system. Our approach has an average error of 3.67208 x10⁻⁴.
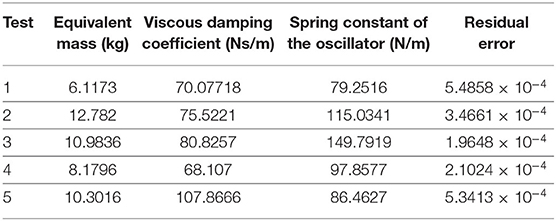
Table 1. Characterization of pendular impacts according to the damped-mass spring system.
5. Conclusions
In this work, we use a simple mathematical model to analyze the response of a structure to an impact generated by a pendulum movement; for that, we characterized this response with a laser-system coupled with image-matching procedure. We obtained the values for the damped mass-equivalent system and observed that all tests had a reaction similar to x(t) = Ae(−Bt)sin(Kt), which corresponds to a damped oscillation; values for this equation are equivalent to the amplitude (related to the impact force), the damping coefficient, and the frequencies. As we are following a rigid-body system, this response agrees with this type of setup. As declared before, this study is based on characterizing how an impact is transmitted, and it is thus an opportunity to further study the energy transmission system, what amount of energy is reflected back, and that which is absorbed by heat in order to propose a suitable model to this phenomenon.
Data Availability Statement
The raw data supporting the conclusions of this article will be made available by the authors, without undue reservation.
Author Contributions
AS-H and PM-A developed the optical technique of Gaussian beams propagation for mechanical measurements. DH-C helped us with the application of the in-situ experimental set-up and the application of image processing. VM-C helped with the numerical approximation of the experimental results. All the Mechanical theoretical part and the development of a code to fit the experimental analysis with the numerical part. All authors contributed to the article and approved the submitted version.
Conflict of Interest
The authors declare that the research was conducted in the absence of any commercial or financial relationships that could be construed as a potential conflict of interest.
Acknowledgments
AS-H thanks PRODEP for the post-doc grant. The value of the critical assistance of one of the reviewers cannot be overemphasized. Without his severe but kindly criticisms, this paper would have been much less acceptable.
Footnotes
1. ^https://www.fortacero.com/lamina-galvanizada/Galvanizedsheet, (Ene. 2020).
2. ^Laserglow Technologies, LCS-0532 Low-Cost DPSS Laser System Laserglow Part Number: C53200XSX, Laser Product Datasheet generated on (2015).
3. ^https://free-video-to-jpg-converter.uptodown.com/windows Video to JPG converter, free software (Dic. 2017).
References
1. Sánchez-Beitia S, Crespo de Antonio M, Acuña L. Applicability of the Hole-Drilling procedure for stresses quantification in timber bending elements in service. Construct Build Mater. (2015) 93:798–805. doi: 10.1016/j.conbuildmat.2015.05.091
2. Maekawa A, Noda M, Suzuki M, Shintani M, et al. Development of noncontact measurement methods using multiple laser displacement sensors for bending and torsional vibration stresses in piping systems. Int J Press Vessels Pip. (2016) 137:38–45. doi: 10.1016/j.ijpvp.2015.05.002
3. Premper J, Sander D, Krischner J. In situ stress measurements during pulsed laser deposition of BaTiO3 and SrTiO3 atomic layers on Pt(001.) Appl Surf Sci. (2015) 335:44–9. doi: 10.1016/j.apsusc.2015.02.009
4. Saldańa-Heredia A, Márquez Aguilar PA, Ocampo AM. Laser-beam reflection for steel stress-strain characterization. Measurement. (2018) 113:92–8. doi: 10.1016/j.measurement.2017.08.047
5. Pedrotti F, Pedrotti L. Introduction to Optics. 2nd Edn. Englewood Cliffs, NJ: Prentice Hall International Inc. (1993).
7. Peters WH, Ranson WF. Digital imaging techniques in experimental stress analysis. Opt Eng. (1982) 21:213–427. doi: 10.1117/12.7972925
8. Hild F, Roux S. Digital image correlation: from displacement measurement to identification of elastic properties - a Review. Strain. (2006) 42:69–80. doi: 10.1111/j.1475-1305.2006.00258.x
9. Chen DJ, Chiang FP, Tan YS, Don HS. Digital speckle-displacement measurement using a complex spectrum method. Appl Opt. (1993) 32:1839–52. doi: 10.1364/AO.32.001839
10. Anuta PE. Spatial registration of multispectral and multitemporal digital imagery using fast Fourier transform techniques. IEEE Trans Geosci Electron. (1970) 8:353–68. doi: 10.1109/TGE.1970.271435
11. Kuglin CD, Hines DC. The phase correlation image alignment method. In: Proc. Int'l Conference of Cybernetics and Society. Palo Alto, CA (1975). p. 163–5. Available online at: http://boutigny.free.fr/Astronomie/AstroSources/Kuglin-Hines.pdf
12. Chevalier L, Calloch S, Hild F, Marco Y. Digital image correlation used to analyze the multiaxial behavior of rubber-like materials. Eur J Mech A. (2001) 20:169–87. doi: 10.1016/S0997-7538(00)01135-9
13. Cintrón R, Saouma V. Strain measurements with digital image correlation systemVic-2D. In: The George E Brown, Jr. Network for Earthquake Engineering Simulation, CU-NEES-08-06 (2008). Available online at: https://www.researchgate.net/publication/265230722_Strain_Measurements_with_Digital_Image_Correlation_System_Vic-2D
14. Pradille C, Bellet M, Chastel Y. A Laser speckle method for measuring displacement field. Application to resistance heating tensile test on steel. Appl Mech Mater. (2010) 24:135–40. doi: 10.4028/www.scientific.net/AMM.24-25.135
16. Enstock LK, Smith PD. Measurement of mpulse from the close-in explosion of doped charges using a pendulum. Int J Impact Eng. (2007) 34:487–94. doi: 10.1016/j.ijimpeng.2005.12.005
17. Gabauer DJ, Kusano KD, Marzougui D, Opiela K, Hargrave M, Gabler HC. Pendulum testing as a means of assessing the crash performance of longitudinal barrier with minor damage. Int J Impact Eng. (2010) 37:1112–37. doi: 10.1016/j.ijimpeng.2010.03.003
18. Prentice HJ, Proud WG, Walley SM, Field JE. Optical techniques for the investigation of the ballistic impact of thin plates. Int J Impact Eng. (2011) 38:849–63. doi: 10.1016/j.ijimpeng.2011.06.007
19. Kśchlina P, Potapovc S. Classification of soft and hard impacts. Nucl Eng Des. (2009) 239:613–8. doi: 10.1016/j.nucengdes.2008.10.016
20. Wilbeck JS. Impact Behavior of Low Strength Projectiles. Dayton, OH: Wright-Patterson Air Force Base (1978).
21. Rein M. Phenomena of liquid drop impact on solid and liquid surfaces. Fluid Dyn Res. (1993) 12:61–93.
22. Stronge WJ. Planar impact of rough compliant bodies. Int J Impact Eng. (1994) 15:435–50. doi: 10.1016/0734-743x(94)80027-7
23. Alda J. Laser and Gaussian Beam Propagation and transformation. Encyclop Opt Eng. (2003) 999–1013. doi: 10.1081/E-EOE120009751
28. Dainty JC. Laser Speckle and Related Phenomena. New York, NY: Springer-Verlag Berlin Heidelberg (1975).
29. Sutton MA. Image Correlation for Shape, Motion and Deformation Measurements. New York, NY: Springer US (2009).
30. Hyoung-Suk C, Cheung J-H, Kim S-H, Ahn J-H. Structural dynamic displacement vision system using digital image processing. NDT& E Int. (2011) 44:597–608. doi: 10.1016/j.ndteint.2011.06.003
31. Chen F, Brown GM, Song M. Overview of three-dimmensional shape measurement using optical methods. Opt Eng. (2000) 389:10–22. doi: 10.1117/1.602438
32. Frike-Begemann T. Optical measurement of deformation fields and surface processes with digital speckle correlation (Ph.D. Thesis), Bielefeld, Germany. Available online at: http://oops.uni-oldenburg.de/219/2/friopt02.pdf
33. Saldańa-Heredia A, Aguilar PA, Vidal-Villegas JA. In-plane displacement for analytical strain determination. J Mater Sci Eng. (2019) 8:510. doi: 10.4172/2169-0022.1000510
Keywords: laser speckle, digital image correlation, mass-spring system, pendular impact, wave propagation
Citation: Saldaña-Heredia A, Martínez-Calzada V, Márquez-Aguilar PA and Hernández-Cruz D (2020) Optical Characterization of a Pendular Impact. Front. Phys. 8:329. doi: 10.3389/fphy.2020.00329
Received: 07 May 2020; Accepted: 16 July 2020;
Published: 22 October 2020.
Edited by:
Olivier J. F. Martin, École Polytechnique Fédérale de Lausanne, SwitzerlandReviewed by:
Eugene G. Bortchagovsky, National Academy of Sciences of Ukraine (NAN Ukraine), UkraineJianming Wen, Kennesaw State University, United States
Copyright © 2020 Saldaña-Heredia, Martínez-Calzada, Márquez-Aguilar and Hernández-Cruz. This is an open-access article distributed under the terms of the Creative Commons Attribution License (CC BY). The use, distribution or reproduction in other forums is permitted, provided the original author(s) and the copyright owner(s) are credited and that the original publication in this journal is cited, in accordance with accepted academic practice. No use, distribution or reproduction is permitted which does not comply with these terms.
*Correspondence: Alonso Saldaña-Heredia, YWhlcmVkaWEmI3gwMDA0MDt1cG1oLmVkdS5teA==