 Tao Zhao
 Gengshe Yang1
 Ki-iL Song
94% of researchers rate our articles as excellent or good
Learn more about the work of our research integrity team to safeguard the quality of each article we publish.
Find out more
ORIGINAL RESEARCH article
Front. Phys., 25 September 2020
Sec. Interdisciplinary Physics
Volume 8 - 2020 | https://doi.org/10.3389/fphy.2020.00322
This article is part of the Research TopicPhysics and Seismicity of RocksView all 18 articles
The contact part between shaft wall and rock is affected by many factors, such as temperature and formation pressure, in the commonly used freezing method in coal mine development through quicksand and water-rich strata. To confine the relationships between these factors and the compressive strength of the contact surface, the sandstone which contacts with the outer well wall was selected in this study to prepare a complex of sandstone and C40 concrete mortar. The factorial design of the multi-factors affecting the uniaxial compressive strength of the complex specimens based on the freeze–thaw cycles test, the uniaxial compression test, and the statistical principle was used to study the interactive effect of various factors. Significant analysis was performed via analyzing the sample water content, the freezing temperature, and the number of freeze–thaw cycles based on the factorial design principle. The results show that the uniaxial compressive strength (UCS) of the dry sandstone–concrete complex specimens is significantly higher than that of the water-saturated sandstone–concrete complex specimens. After freeze–thaw cycles, the UCS of both the dry sandstone–concrete complex specimens and water-saturated sandstone–concrete complex specimens decrease significantly. In addition, the significant effects of main effect and primary and secondary interaction on unconfined compressive strength were obtained, and the major interaction among the factors was synergistic interaction, and the minor interaction among the factors is non-interactive interaction and antagonism.
- The mechanical properties of sandstone–concrete complex specimen under different freeze–thaw conditions were obtained.
- UCS of the dry sandstone–concrete specimens is higher than that of the water-saturated specimens.
- The UCS of both the dry and water-saturated sandstone–concrete specimens decrease significantly after freeze–thaw cycles.
With the rapid development of national economy, the energy demand has been further enhanced. Also, the raising of strategic conception of “Belt and Road” creates great potential for coal and the development of other energy sources in the western China region [1]. According to incomplete statistics, no <50 mine shafts in water-abundant bedrock were built with a depth of over 400 m since 2000 AD. Most of these mine shafts crossed the water-abundant rocks with characteristics such as low strength, weak cementation, and softening after contact with water which were formed during the Cretaceous and the Jurassic. Thus, freezing shaft sinking method is the most commonly used method in these mine shaft excavations [2–4]. However, shaft lining, horsehead water inrush, and even flooded shaft need to be solved urgently in the process of freezing shaft sinking [5].
A possible solution to overcome the aforementioned problems is to study the mechanical characteristics of well-bore and surrounding medium (rock and concrete) at a low-temperature environment. Therefore, researchers all across the world show much interest in the physical and mechanical properties of frozen rocks in recent decades. Matsuoka et al. studied the mechanism of freezing and thawing failure of rock and the influence of freezing and thawing cycle number on rock strength [6, 7]. Yambae tested the thermal expansion strain of sandstone after one freeze–thaw cycle and its unconfined compressive strength (UCS) at different temperatures; they found that the axial deformation of dry rock samples remained elastically deformed whereas the axial deformation of the water-saturated rock sample became plastically deformed; moreover, UCS increased with the decrease of temperature after one freeze–thaw cycle [8]. Yang et al. studied the water-saturated rocks at different freezing temperatures by CT imaging technology; they analyzed the relationship between the rock damage and the freezing temperature and relationship between the rock damage and the freezing speed [9, 10]. Yang et al. performed the single-axis and tri-axial compression tests at different confining pressure and different temperature conditions using hydraulic servo rock pressure tester; they analyzed the influences of confining pressure and low temperature on the strength characteristics of different rocks, and deduced the non-linear failure criterion of frozen rock considering temperature [4, 11]. Xi et al. studied the effects of freezing temperature on submit strength, adhesion force, internal friction angle, and residual strength of sandy mudstone, and analyzed the relationship between the confining pressure and the submit strength and the relationship between the confining pressure and the residual strength [12]. Yang et al. studied the design theory of shaft freezing method at home and abroad, especially the design theory of shaft freezing method at home, and carried a prospect analysis on the design theory of shaft freezing method in coal mine [13]. Wang et al. conducted the uniaxial compression test of five different strain rates and different water cuts (dry, saturated) in the Hokkaido Nobile frozen tuff using MTS 312.21 electro-hydraulic servo test machine. Also, the empirical formula of the uniaxial compressive strength considering the strain rate of the saturated frozen rock sample was established after analyzing the reason and effect caused by the strain rate [14]. Xie et al. developed a statistical damage constitutive model considering whole joint shear deformation and Wang et al. studied the fracture behavior of rock [15, 16]. Xu et al. conducted uniaxial and tri-axial compression tests on dry and water-saturated red sandstone and shale at the temperature range of −20 to 20°C; they found that UCS and elastic modulus of the two investigated rocks increase with the decrease of temperature. Moreover, the strength of red sandstone is influenced by temperature more profoundly. They also come out with the conclusion that the influence of water content on the strength of frozen rock is significant [17]. There are many reports that focused on the influence of low-temperature environment in the concrete strength as well. Shi et al. conducted the freeze–thaw cycle test on concrete specimens [18] and Zou et al. performed scanning electron microscopy on concrete specimens to compare the relationship between the internal structure of concrete and the number of freeze–thaw cycles before and after freezing and thawing [19]. Shang et al. established the correlative mathematical expressions to clarify the relationship between the freeze–thaw cycles and the uniaxial compressive strength and the relationship between freeze–thaw cycles and the tensile strength of concrete [20].
All the aforementioned reports studied the UCS of rock or concrete materials separately, and there are few studies on the mechanics of rock and concrete complexes. Xiang et al. established the damage softening statistical constitutive model of the complex sample before and after freezing and thawing by freeze–thaw cycle test and uniaxial compression test and micro-scanning test [21]. Yi et al. established a two-media and two-body two-mechanical model to study the mechanical properties of the interface between the two media by relative experimental tests [22]. Shen et al. studied on meso-debonding process of the sandstone–concrete interface induced by freeze–thaw cycles using NMR technology [23]. Tian et al. investigated the durability of engineered cementitious composites-to-concrete interface under salt freeze–thaw cycles [24]. These studies mainly use rock, concrete separately, and a combination of them as the research object to carry out the low-temperature mechanical test, including freeze–thaw cycle number, freezing temperature, surrounding rock pressure, and water content. Also, all these reported studies only focused on the influence of a single factor, which is far from the actual project.
The aim of the present work is to study the influence of the interaction between drying state, saturation zone, freezing and thawing cycle number, and freezing temperature on the non-lateral compressive strength of the Cretaceous sandstone–concrete composite. The factorial design method was used to analyze the significance of different factors and their interaction effects.
Factorial experiment design is a kind of multi-factor cross-grouping design, which can not only check whether there is a difference between two factors or among even more factors at different levels but can also check whether there is an interaction between/among the investigated factors. The factorial experimental design of three factors can not only study whether there are differences among different levels of factors A, B, and C but can also study whether there are first-order interactions (A × B, A × C, B × C) or second-order interactions (A × B × C) among the three factors. Interactive interaction refers to the fact that the single effect of one factor varies with the change of another factor. In this circumstance, we deem that there is an interactive interaction between the two factors. As for the circumstance that there exist three factors A, B, and C, factor A has r levels: A1, A2, A3, …, Ar; factor B has s levels: B1, B2, B3, …, Bs; factor C has t levels: C1, C2, C3, …, Ct; the freedom degree of factor A is r−1, the freedom degree of factor B is s−1, and the freedom degree of factor C is t−1; and factors A, B, and C are independent compared with each other in the horizontal combination (Ar, Bs, Ct) [25].
Denoting that rstm = n, then
It can be verified by Equation (9) that the sum of the intersection terms in the ST decomposition formula is 0. If T2 = nX2, the following equations can be obtained:
Therefore, the following equations can be deduced:
Table 1 shows the critical value of the F test. It can be easily found that the significance analysis is the same as the single factor analysis.
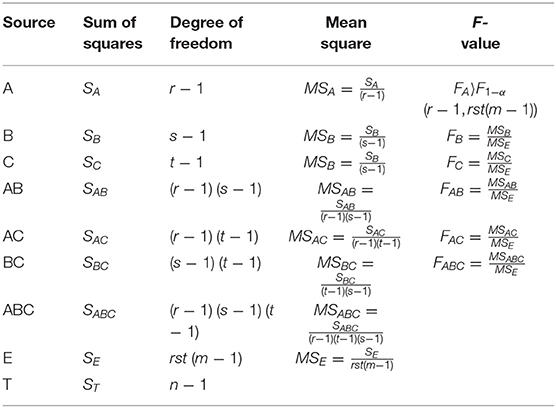
Table 1. Three-factor analysis of variance of interaction effects.
If FB〉F1−α(s − 1, rst(m − 1)), H02 is rejected and factor B is considered to have a significant influence on the index value.
If FC〉F1−α(t − 1, rst(m − 1)), H03 is rejected and factor C is considered to have a significant influence on the index value.
If FAB〉F1−α((r − 1)(s − 1), rst(m − 1)), H04 is rejected and the interaction of factors A and B has a significant influence on the index value.
If FAC〉F1−α((r − 1)(t − 1), rst(m − 1)), H05 is rejected and the interaction between factors A and C is considered to have a significant impact on the index value.
If FBC〉F1−α((t − 1)(s − 1), rst(m − 1)), H06 is rejected and the interaction between factors B and C is considered to have a significant impact on the index value.
If FABC〉F1−α((r − 1)(t − 1)(s − 1), rst(m − 1)), H07 is rejected and the interaction between factors A and B and C is considered to have a significant influence on the index value.
The size of the significant effect is defined as follows:
If, its significance is defined as I;
If, its significance is defined as II;
If, its significance is defined as III;
If α ≥ 0.1, its significance is defined as IV.
There are two or more independent variables in the experiment. When the effect of one independent variable is different at each level of another independent variable, it indicates that there is interactive interaction between/among these independent variables. When there exists interactive interaction, it is of little significance to study the effect of one single factor but it is necessary to study the effect of the factor at different levels of another factor. The interaction in the experimental design method indicates that the effect of the simultaneous action of two or more factors can be strengthened or weakened compared with the effect of the single level factor and interactive interaction is a factor that must be considered in the study. The three common interactions are mainly non-interactive interaction, synergistic interaction, and antagonism, as shown in Figure 1 [26].
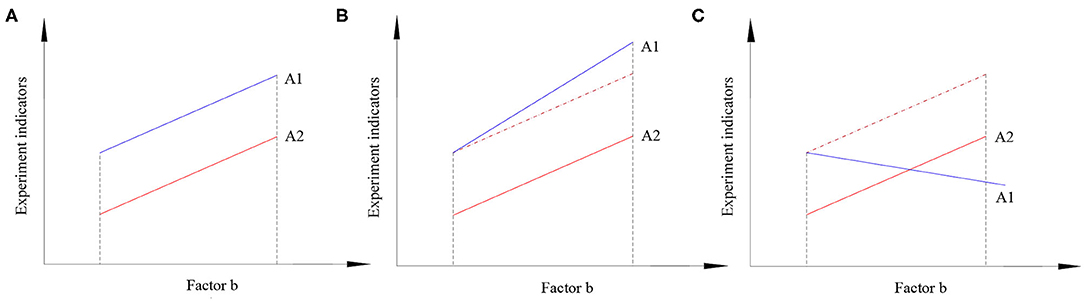
Figure 1. The working period of CLS backfill applied in upward sublevel filling method. (A) Before filling; (B) cold releasing; (C) cold fully released.
In the design of factorial experiments, if changing the level of one factor causes a change in the response difference between the other levels, there is an interaction between these factors. As shown in Figures 1B,C, the straight line A1 intersects with the straight line A2. For the factors at the same level, the factors take different levels, and the results are different. That is, the effect of the factor depends on the level chosen by the factor. Therefore, there is an interactive interaction between factors and factors, and interactions include synergy and antagonism. As shown in Figure 1A, the straight line A1 and the straight line A2 are almost parallel, indicating that there is no interactive interaction between the factors. If there is an interactive interaction between the two factors, the individual effects of each factor must be analyzed one by one in the statistical analysis; if there is no interactive interaction between the two factors, the main effects of each factor can be analyzed one by one.
The 2 × 4 × 4 factorial design refers to that there are 3 factors, including 2 levels, 4 levels, and 4 levels, respectively. There are 32 combinations, as shown in Table 2. Three factors were selected in this experiment: moisture content, the number of freeze–thaw cycles, and freezing temperature. Moisture content (A) takes 2 levels: saturated state and unsaturated state. The number of freeze–thaw cycles (B) was set at four levels: one time, five times, eight times, and 12 times; freezing temperature (C) takes 4 levels: −5, −10, −20, and −30°C.
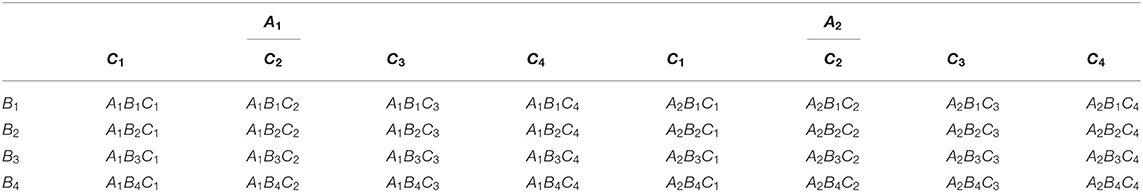
Table 2. 2 × 4 × 4 factorial experimental design model.
The rocks in Cretaceous strata have characteristics such as low strength, easy softening in water, and well-developed pores (fractures). Fresh and complete cretaceous sandstone samples were taken from a coal mine freezing construction site in Gansu province and sealed, boxed, and transported with polyethylene material to ensure the rock moisture content is basically unchanged and the integrity of the overall structure remains. According to the specification of rock test regulations for water conservancy and hydropower projects (DL/T5368-2007), cylindrical specimens with a diameter of 50 mm and a length of 100 mm were sampled by water drilling.
According to C40 concrete and the principle of similar proportion in construction site, the C40 concrete mortar required for the test were prepared. Also, the uniaxial compressive strength of concrete mortar specimens was carried out. The ratio of concrete mortar determined according to the UCS of concrete mortar specimens is the same as the UCS of specimens in Cretaceous strata. The rock cutter is used to cut along the central axis of the round section of the sandstone specimen, and the cutting surface is roughened with a steel chisel. The semi-cylindrical rock specimen will be placed in the mold with inner diameter of 50 mm and length of 100 mm, and then the mold was filled with concrete mortar. After 28-days standard maintenance, the product of ϕ 50 × 100 mm standard sandstone–concrete complexes as shown in Figure 2 was obtained.
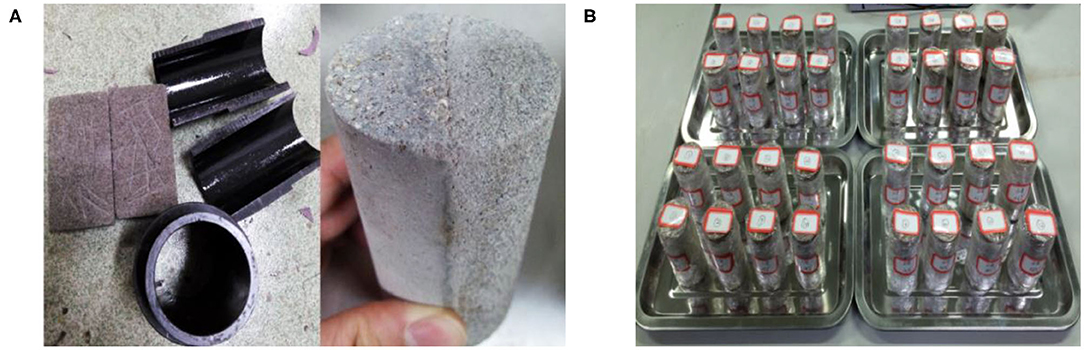
Figure 2. Sandstone–concrete samples used in the experiments. (A) Combination test piece and mold; (B) compression test assembly test piece.
The complex specimens were screened preliminarily after preparation and processing, and the ones with obvious defects on the interface and large surface porosity were removed. Half of the test piece was placed in vacuuming equipment for 24 h to prepare the non-saturated combination specimens.
The number of freeze–thaw cycles of the designed complex specimens is 1 time, 5 times, 8 times, and 12 times. As shown in Figure 2B, the prepared unsaturated and water-saturated combination test pieces were placed in the DWX-30 cryogenic chamber for testing. The pieces were frozen at −30°C for 4 h and then thawed into a freeze–thaw cycle for 12 h at 25°C (Figure 3A). The designed combination specimens were subjected to a freeze–thaw cycle test at freezing temperatures of −5, −10, −20, and −30°C, respectively. Also, a mechanical test was performed on a RE-TES uniaxial compression tester. The designed testing scheme is illustrated in Figure 3B.
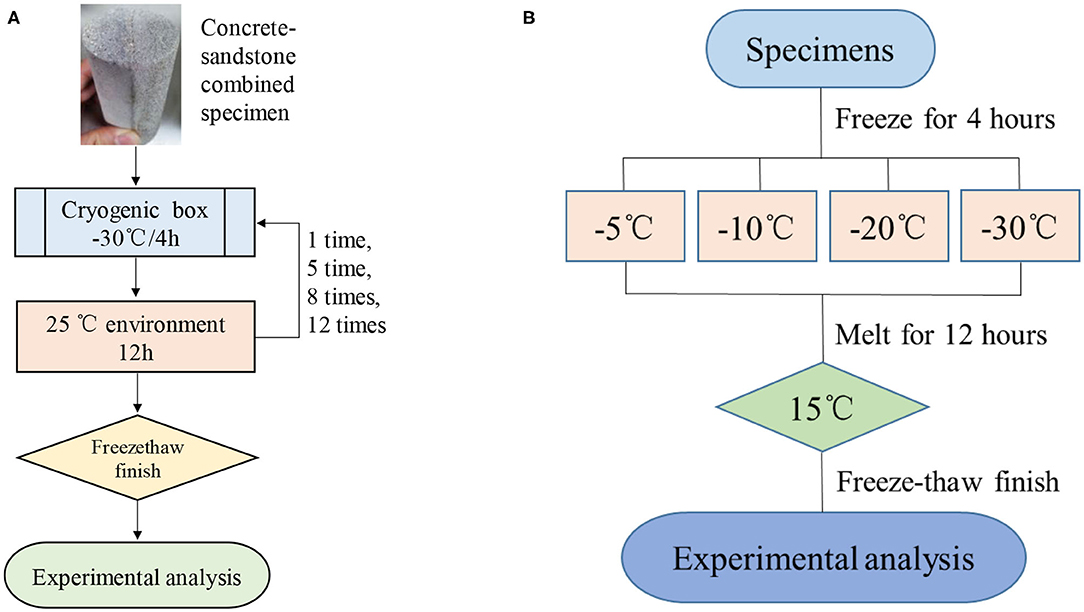
Figure 3. Experimental design of different freeze–thaw methods. (A) Different freeze–thaw cycles; (B) different freezing temperatures.
Figure 4 shows the stress–strain curves of sandstone–concrete complex specimens without lateral limit single-axis compression under various freezing and thawing conditions, and some typical experimental results are given here. Generally speaking, the stress–strain relationship of sandstone–concrete composite specimens can be roughly divided into: compaction stage, elastic stage, yield stage, and failure stage.
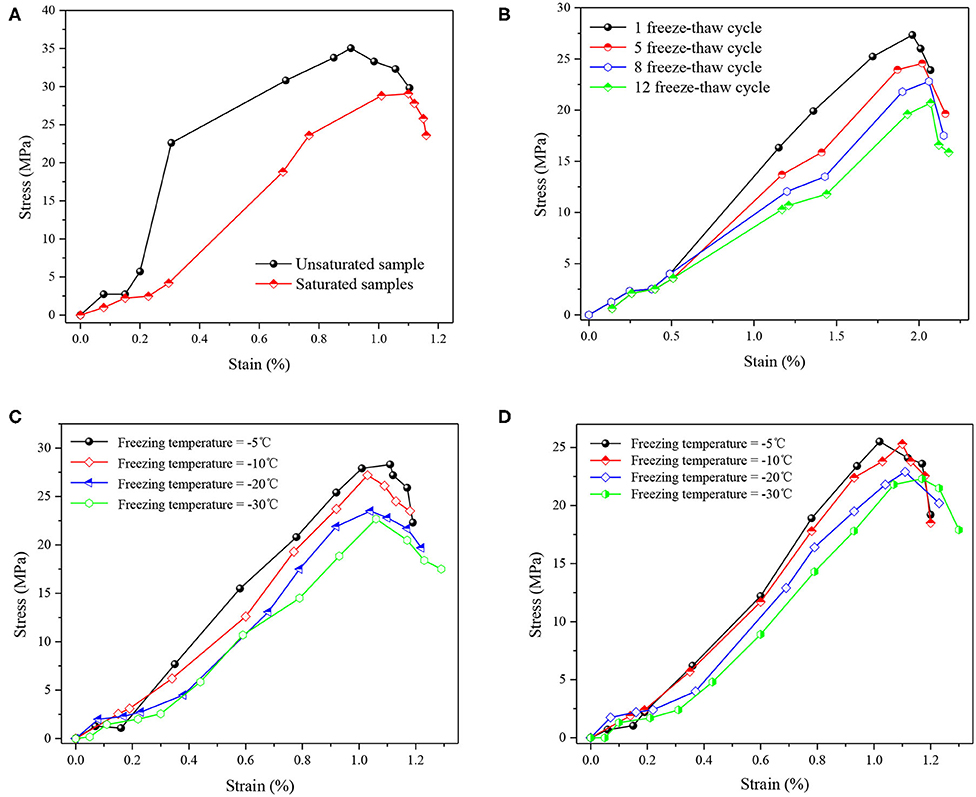
Figure 4. Stress–strain curves of sandstone–concrete composite under different freeze–thaw conditions: (A) freezing temperature = −10°C, freeze–thaw cycle = 1; (B) water-saturated specimen, freezing temperature = −10°C; (C) unsaturated specimen, freeze–thaw cycle = 1; (D) water-saturated specimen, freeze–thaw cycle = 1.
Figure 4A shows the stress–strain curves with only one freeze–thaw cycle for the complex specimens with different moisture contents (factor A) under freezing temperature of −10°C. Before the damage, the compressive strength of the unsaturated specimen was significantly higher than that of the water-saturated specimen; however, the plasticity stage of the feeding specimen was advanced and significant. The reason is that water has little effect on the compressive strength of concrete, mainly because the sandstone part of the complex specimen is softened by water and thus the strength is lowered, which leads to the decrease of the compressive strength of the specimen.
Figures 4C,D shows stress–strain curves with only one freeze–thaw cycle for unsaturated specimens (Figure 4C) and water-saturated (Figure 4D) complex specimens at different freezing temperatures (factor C). As the freezing temperature continues to decrease, the compressive strength of the test piece also decreases. The reason is that the lower the freezing temperature, the more sufficient the water freezing degree in the complex specimen, the greater the frost heaving force generated, and the more serious the damage to the specimen.
Figure 4B shows the stress–strain curve shape of the sandstone–concrete composite specimen, which is obviously changed by the number of freeze–thaw cycles. With the increasing number of freeze–thaw cycles, the compaction stage increases, the elastic stage decreases, the elastic modulus decreases, and the compressive strength also decreases. The reason is that with the increase of the number of freeze–thaw cycles, the number of pores and cracks in the specimen also increased, which leads to the deterioration of the internal degradation damage and the decrease of strength of the composite specimen.
The factorial design results of UCS of the sand–concrete complex specimens with different water contents, different freeze–thaw cycle times, and different freezing temperatures are shown in Table 3. Table 3 shows the degrees of freedom and mean sum of square of each main effect and interaction effect affecting UCS of the complex specimens according to the distribution characteristics of UCS and the factorial experiment principle in Experimental programs section. Therefore, through joint hypotheses test (F test), all the aforementioned influencing factors have different degrees of influence on UCS. According to the calculation, it can be concluded that factor A, factor B, factor C, and interaction A × B have a more prominent effect on UCS.
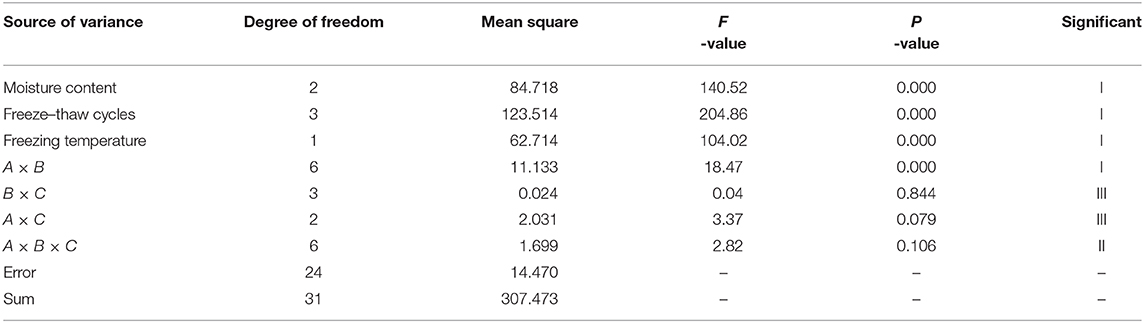
Table 3. Analysis of unconfined compressive strength of sandstone–concrete samples.
Figure 5 shows the Pareto diagram of the standardized effect. The Pareto diagram can determine the magnitude and importance of the effect. The magnitude corresponding to the reference line in this figure is 2.06. It can be seen from Figure 5 that the significance of the main effect and the interaction of the first and second order on the UCS of the complex specimen is decreased in the order of freeze–thaw cycle number (factor B), moisture content (factor A), freezing temperature (factor C), first-order interaction A × B, first-order interaction B × C, second-order interaction A × B × C, and first-order interaction A × C. According to the standardization effect, the main factors affecting UCS are the main effect B, A, C and interaction A × B. The standardization effect for effect B is about 1.3 times that for main effect A, and about four times of those for main effect C and interaction A × B; the standardization effect for main effect A is about three times as large as those for main effect C and interaction A × B; the standardized effects of main effect C and interaction A × B is almost the same (~2.2).
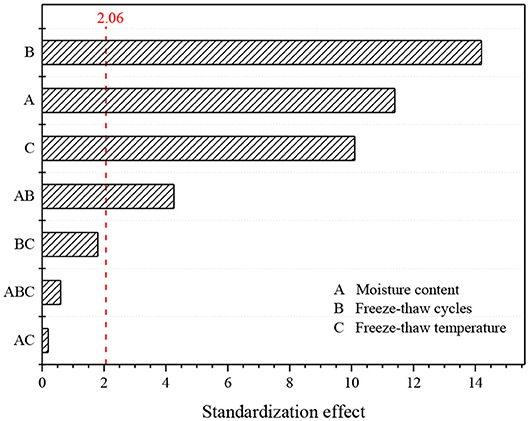
Figure 5. Pareto diagram of standardization effect.
Through the six interaction diagrams of factors A, B, and C displayed in Figure 6, it can be concluded that synergistic interaction is the main interactive interaction among these three investigated factors, whereas non-interactive interaction and antagonistic effect are the auxiliary. The synergistic interaction is evident in the freeze–thaw cycle one time and five times, freezing temperature from −5 to −10°C.
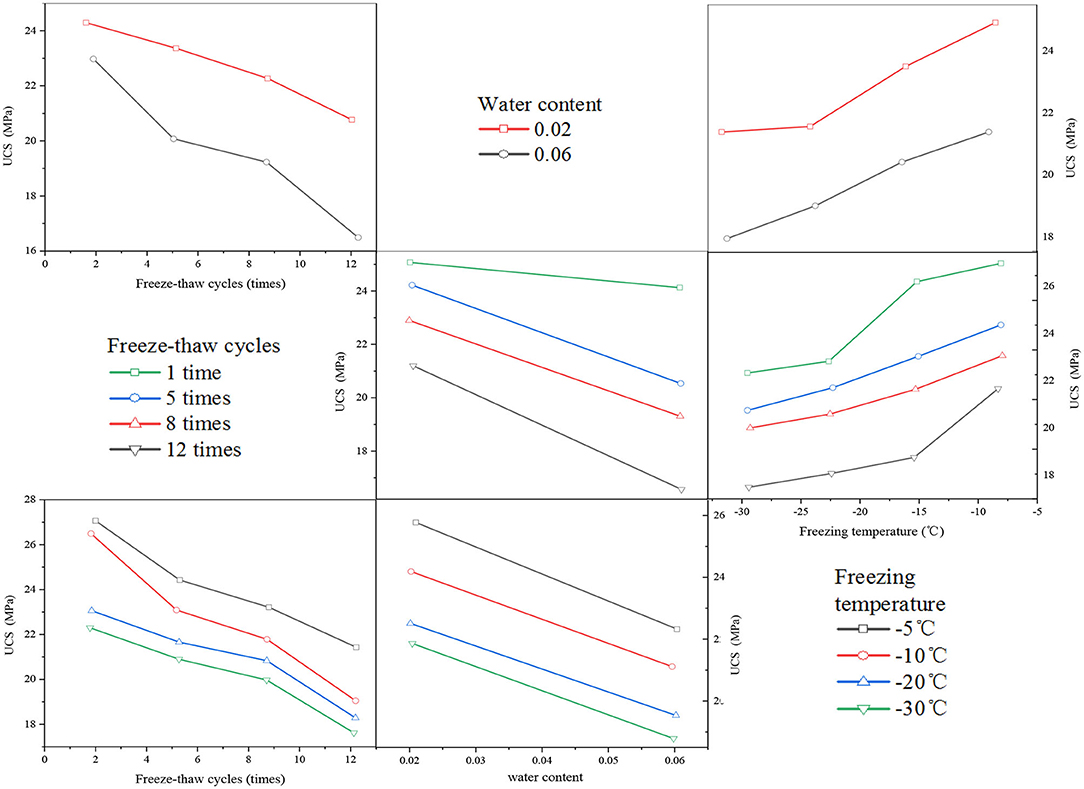
Figure 6. Pareto diagram of standardization effect.
As Figure 7 shows, one of the three investigated factors A, B, and C was kept unchanged and contour maps were drawn of the other two factors and UCS. Figure 7A shows that the UCS value is >19.5 kPa when the moisture content of the complex specimen is between 14.00 and 16.35% and the number of freeze–thaw cycles is between 1 and 3. When the moisture content is between 16.35 and 18.45%, the number of freeze–thaw cycles is between 3 and 5, and the UCS value is in the range of 18–19.5 kPa. When the moisture content increases by about 2.00% and the number of freeze–thaw cycles increases by about 2 times, the UCS value will enter the next level. Figure 7B shows that when the freeze–thaw cycle number of the complex specimen at freeze temperature of −15°C was 1.6 and the freeze–thaw cycle number of the complex specimen at freeze temperature of −5°C was 3.5, the UCS values are higher than 16.8 kPa; when the freeze–thaw cycle number of the complex specimen at freeze temperature of −15°C was 3.8 and the freeze–thaw cycle number of the complex specimen at freeze temperature of −5°C was 5.7, the UCS values are in the range of 15.6–16.8 kPa. The aforementioned results show that the decrease of freeze temperature and the increase of freeze–thaw cycle have an interactive effect on the UCS of the complex specimen. The relationship revealed by Figure 7C is basically the same as that revealed in Figure 7B, indicating that there is an interactive effect between moisture content and freezing temperature on the UCS of the complex specimen.
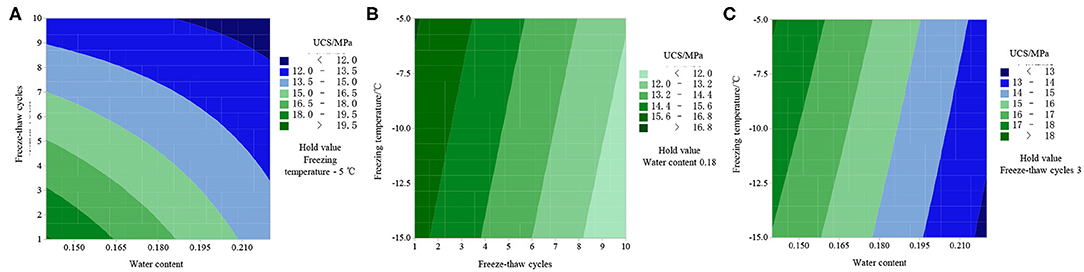
Figure 7. Isoline between UCS of sandstone–concrete complex and factors A, B, and C. (A) Isoline between UCS and factors A, B; (B) isoline between UCS and factors B, C; (C) isoline between UCS and factors A, C.
According to the experimental results, the main effect value of each factor and the interaction effect value among factors A, B, and C were obtained, and the following regression equation was fitted by using the Design Expert software:
where k is the UCS of the sand–concrete complexes. Considering the three factors A, B, and C, the effects of moisture content (factor A) and freeze–thaw cycle (factor B) can only be positive, whereas the effect of freezing temperature (factor C) is negative. Therefore, it can be obtained from Equation (26) that factors B, C, and A × B × C have negative regression coefficients, and their weighted coefficients are 1.836, 0.311, and 0.276, respectively. The regression coefficient of factor B is the largest, indicating that B has the most apparent impact on the UCS of the complex specimen. With the increase of the number of freeze–thaw cycles, the UCS of the complex specimen significantly decreases, and the synergistic effect in the system also decreases, whereas the antagonistic effect increases. The regression coefficients of factors A, A × B, A × C, and B × C are positive, indicating that the main effect and the interaction have a positive contribution to the UCS of the complex specimen. When the degree of factors A, A × B, A × C, and B × C increases, the UCS of the complex specimen will slightly decrease, and the synergistic effect of the factors increases and antagonistic effect of the factors decreases.
Based on the aforementioned analysis, it can be seen that not only the moisture content, freeze–thaw cycle times, and freezing temperature have impacts on the mechanical properties of the sand–concrete complex specimen but the interactions between various factors are also significant. Therefore, the independent effect of each factor cannot be simply considered separately, but the influence of each factor and their interaction should be considered comprehensively.
Based on the experimental study on the UCS of sandstone–concrete complex specimen under different freeze–thaw conditions and the interactive interaction among different factors, the main understandings and achievements are as follows:
(1) The UCS of the sandstone–concrete dry complex specimen is significantly higher than that of the water-saturated complex specimen and the plastic phase of the water-saturated specimen shifts to an earlier time and is more significant. It can be explained that pore pressure increases with water content and therefore the effective stress on the sample gets reduced, and that makes the UCS lower (according to Mohr–Coulomb failure criterion). The stress–strain curves of the composite specimens under different freezing temperatures were significantly changed under the action of one freeze–thaw cycle, and the UCS of composite specimens decreased with the freezing temperature.
(2) After 0, 1, 5, 8, and 12 freeze–thaw cycles, the UCS of both the dry complex specimen and water-saturated complex specimen decreased significantly. After 12 freeze–thaw cycles, the strength was only between 50 and 70% compared with that of the unfrozen samples.
(3) The main effects and the interactions of the first and second order on the UCS of the complex specimen are as follows: freeze–thaw cycle number (factor A), water content (factor B), freezing temperature (factor C), first-order interaction A × B, the second-level interaction A × B × C, the first-level interaction A × C, and the first-level interaction B × C.
(4) The interaction among the factors is mainly the synergistic interaction, supplemented by non-interactive interaction and antagonism. The synergistic effect is profoundly observed when the freeze–thaw cycle number is in the range of 5–8, the moisture content is in the range of 14–18%, and the freezing temperature decreases from −5 to −15°C. The significance of the freeze–thaw cycle 0 times and 1 time was significantly higher than eight times and 12 times, and the freeze–thaw damage of the complex specimens showed cumulative effect with freeze–thaw number.
In the future study, non-destructive testing technology (nuclear magnetic resonance) will be used to study the micropore characteristics of sandstone–concrete composite under the action of freeze–thaw cycle and the relationship between the micropore characteristics and macromechanical properties.
All datasets generated for this study are included in the article/supplementary material.
TZ: writing—original draft preparation. JX: methodology. YS: software. K-iS: validation. GY: supervision. All authors have read and agreed to the published version of the article.
This research was supported by the National Natural Science Foundation of China (no. 51772341), Key R&D Projects in Shaanxi Province (no. 2019SF-264) and the National Research Foundation of Korea (NRF) funded by the Ministry of Science, ICT & Future Planning (no. 2017R1E1A1A01075118).
The authors declare that the research was conducted in the absence of any commercial or financial relationships that could be construed as a potential conflict of interest.
We are grateful for the support provided by the College of Civil and Architectural Engineering, Xi'an University of Science and Technology, Xi'an 710054, China.
1. Wang L. Development and utilization of coal resources in west china to regional contribution and typical demo reference. Coal Econ Res. (2017) 37:28–33. doi: 10.13202/j.cnki.cer.2017.01.005
2. Li Y, Jing H, Zhang L. Construction technology of freezing method for low temperature large section shaft. Mod Mining. (2014) 30:182–4. doi: 10.3969/j.issn.1674-6082.2014.07.066
3. Cheng H, Cai H. Safety situation and thinking about deep shaft construction with freezing method in china. J Anhui Univ Sci Tech. (2013) 33:1–6. doi: 10.3969/j.issn.1672-1098.2013.02.001
4. Yang G, Xi J, Li H, Cheng L. Experimental study of rock mechanical properties under triaxial compressive and frozen conditions. Chin J Rock Mech Eng. (2010) 29:459–64.
5. Cheng H, Yao Z, Rong C. The key technical problems of freeing methods of sinking shaft in the western region of china. In: New Progress in Mine Construction Engineering Technology, Xiamen, 2009 National Academic Conference on Mine Construction (Vol I) (2009).
6. Matsuoka N. Mechanisms of rock breakdown by frost action: an experimental approach. Cold Regions Sci Technol. (1990) 17:253–70. doi: 10.1016/S0165-232X(05)80005-9
7. Hroi M. Micromechanical analysis on deterioration due to freezing and thawing in porous brittle materials. Int J Eng Sci. (1998) 36:511–22. doi: 10.1016/S0020-7225(97)00080-3
8. Yamabe T, Neaupane KM. Determination of some thermo-mechanical properties of Sirahama sandstone under subzero temperature conditions. Int J Rock Mech Mining Sci. (2001) 38:1029–34. doi: 10.1016/S1365-1609(01)00067-3
9. Yang G, Zhang Q, Pu Y. CT scanning test of meso-damage propagation of rock under different freezing temperature. J Chang'an Univ. (2004) 24:40–6. doi: 10.3321/j.issn:1671-8879.2004.06.010
10. Yang G, Zhang Q, Ren J, Pu Y. Study on the effect of freezing rate on the damage ct values of tongchuan sandstone. Chin J Rock Mech Eng. (2004) 23:4099–104. doi: 10.3321/j.issn:1000-6915.2004.24.001
11. Yang G, Lv X. Experimental study on the sandy mudstone mechanical properties of shaft sidewalls under the frozen conditions. J Mining Saf Eng. (2012) 29:492–6.
12. Xi J, Yang G, Dong X. Effect of freezing temperature on mechanical properties of sandy mudstone. J Chang'an Univer. (2014) 34:92–6. doi: 10.19721/j.cnki.1671-8879.2014.04.014
13. Yang E, Xi J. Review and prospects of research on freezing design theory of coal mine shaft. Chin J Undergr Space Eng. (2010) 6:627–35. doi: 10.3969/j.issn.1673-0836.2010.03.034
14. Wang K. Test study on the mechanical property of tuff at different strain rates in freezing condition. In: New Process of Mine Construction Engineering-Proceedings of 2006 National Conference on Mine Construction (Vol II), Yunnan, (2006). p. 330–4.
15. Xie S, Lin H, Wang Y, Chen Y, Xiong W, Zhao Y, et al. A statistical damage constitutive model considering whole joint shear deformation. Int J Damage Mech. (2020) 29:1056789519900778. doi: 10.1177/1056789519900778
16. Wang Y, Zhang H, Lin H, Zhao Y, Liu Y. Fracture behaviour of central-flawed rock plate under uniaxial compression. Theoret Appl Fracture Mech. (2020) 106:102503. doi: 10.1016/j.tafmec.2020.102503
17. Xu G, Liu Q, Peng W, Chang X. Experimental study on basic mechanical behaviors of rocks under low temperatures. Chin J Rock Mech Eng. (2006) 25:2502–8. doi: 10.1016/S1872-1508(06)60035-1
18. Shi S. Effect of freezing-thawing cycles on mechanical properties of concrete. J China Civil Eng. (1997) 04:35–42.
19. Zou C, Zhao J, Lang F, Ba H. Experimental study on stress strain relationship of concrete in freeze thaw environment. J Harbin Inst Technol. (2007) 39:229–231. doi: 10.3321/j.issn:0367-6234.2007.02.014
20. Shang H, Song Y, Tan L. Experimental study on the performance of ordinary concrete after freeze-thaw cycle. China Concrete Cement Prod. (2005) 9–11.
21. Xiang W, Liu X. Experimental study of mechanical properties of complex specimen with rock and shotcrete under freezing-thawing cycles. Chin J Rock Mech Eng. (2010) 29:2510–21.
22. Yi C, Liu J, Wang C, Li Z. Photo elastic method and numerical simulation of the interface between bi-material specimen. Chin J Rock Mech Engin. (2008) 37:450–5. doi: 10.3724/SP.J.1011.2008.00367
23. Shen Y, Wang Y, Wei X, Jia H, Yan R. Investigation on meso-debonding process of the sandstone–concrete interface induced by freeze–thaw cycles using NMR technology. Constr Build Mater. (2020) 252:118962. doi: 10.1016/j.conbuildmat.2020.118962
24. Tian J, Wu X, Zheng Y, Hu S, Ren W, Du Y, et al. Investigation of damage behaviors of ECC-to-concrete interface and damage prediction model under salt freeze-thaw cycles. Constr Build Mater. (2019) 226:238–49. doi: 10.1016/j.conbuildmat.2019.07.237
25. Guo P. Principle and application of three factors analysis of variance. J Shenyang Univ. (2015) 27:40–3.
Keywords: sandstone–concrete complex, freeze–thaw cycles, uniaxial compressive strength (UCS), factorial design, interaction
Citation: Zhao T, Yang G, Xi J, Shen Y and Song K (2020) Factorial Experiment Study on the Mechanical Properties of Sandstone–Concrete Specimens Under Different Freeze–Thaw Conditions. Front. Phys. 8:322. doi: 10.3389/fphy.2020.00322
Received: 21 February 2020; Accepted: 13 July 2020;
Published: 25 September 2020.
Edited by:
Longjun Dong, Central South University, ChinaReviewed by:
Hang Lin, Central South University, ChinaCopyright © 2020 Zhao, Yang, Xi, Shen and Song. This is an open-access article distributed under the terms of the Creative Commons Attribution License (CC BY). The use, distribution or reproduction in other forums is permitted, provided the original author(s) and the copyright owner(s) are credited and that the original publication in this journal is cited, in accordance with accepted academic practice. No use, distribution or reproduction is permitted which does not comply with these terms.
*Correspondence: Tao Zhao, emhhb3Rhb0B4dXN0LmVkdS5jbg==
Disclaimer: All claims expressed in this article are solely those of the authors and do not necessarily represent those of their affiliated organizations, or those of the publisher, the editors and the reviewers. Any product that may be evaluated in this article or claim that may be made by its manufacturer is not guaranteed or endorsed by the publisher.
Research integrity at Frontiers
Learn more about the work of our research integrity team to safeguard the quality of each article we publish.