- 1School of Architecture and Civil Engineering, Xi'an University of Science and Technology, Xi'an, China
- 2Key Laboratory of Coal Resources Exploration and Comprehensive Utilization, Ministry of Land and Resources, Xi'an, China
- 3Drilling Technology and Engineering Research Institute, China Coal Technology & Engineering Group Xi'an Research Institute, Xi'an, China
- 4Key Laboratory of Coal Resources Exploration and Comprehensive Utilization, Ministry of Land and Resources, Shaanxi Coalfield Geophysical Prospecting and Surveying Group Co. Ltd., Xi'an, China
The coal in front of the mining face presents strain softening deformation characteristics. An analytical model is proposed to simulate the abutment pressure distribution over the coal in front of the mining face under elastic and inelastic conditions. A new theoretical formula is derived from calculating the abutment pressure distribution and its width in elastic and inelastic regions of the coal under the limit equilibrium condition. The influences of UCS, residual strength, mining height, softening modulus, and deformation angle on the abutment pressure distribution are discussed. The study results show that (1) the stress gradient in the plastic area is larger than that in the crushed zone; (2) the width of the plastic region is independent of the peak abutment pressure, but it is dependent on UCS, residual strength, mining height, softening modulus, and deformation angle; (3) the width of the crushed zone in the inelastic area is closely related to the peak abutment pressure, coal-floor interface cohesion, and friction coefficient; (4) the width of the elastic zone is dependent on the mining height, coefficient of horizontal pressure, coal-floor interface friction coefficient, and peak abutment pressure, where the coefficient of horizontal pressure has the highest impact, in that the width of the elastic zone undergoes logarithmic decrease with the increase in the coefficient of horizontal pressure. A case study was carried out at longwall panel 07 of No. 5 coal seam in Dongjiahe Coal Mine to verify the analytical model. The abutment pressure distribution and the widths of the elastic and inelastic zones under the limit equilibrium condition are calculated based on the relevant parameters. The theoretical results are compared with the field monitoring data and show a very good fit. It is proved that the proposed analytical model has high accuracy, and the feasibility of the model is verified. The study results can provide guidance for similar engineering applications.
Introduction
As mining goes deeper and deeper, the engineering and geological conditions of mining entries become more and more complicated. Low coal strength and high deformation at ribs are the key points of difficulty for the control of the surrounding rock mass at mining entries. Much in-depth research has been done on the deformation and failure of the rock surrounding mining entries. Yuan and Chen analyzed the mechanical behavior at the plastic and crushed zones of mining entries based on the rock strain-softening characteristics and elastic-plastic softening model [1, 2]. Hou and Ma determined the coal interface stress and the depth critical stress equilibrium zone of mining entries with loose medium stress equilibrium theory [3, 4]. Ma calculated the plastic zone radius and stress of mining entries with a mechanic model based on the full strain-stress curve [5, 6]. Zheng and Yang calculated the width of the coal rib damaged zone with a simplified rib stress distribution [7, 8]. Li, Pan, and Wang studied the influence of the support zone on the plastic zone of the coal with grouting-bolting combined support on coal ribs [9–11]. In addition, the coal rib stress and displacement distribution have been discussed by many researchers [12–18]. However, the impacts of the abutment pressure in the elastic zone on the limit equilibrium zone have been neglected. It is hard to determine the relevant mechanical parameters for use in practical engineering applications. Actually, rib coal is a special rock mass that exists deep underground and is rich in cracks. Its mechanical characteristics under abutment pressure are different from those of shallow rocks [19–31]. In this study, the elastic foundation beam theory is adopted to study the load distribution and width of the limit equilibrium zone of mining entries. A case study was conducted for the verification of the model, which provides a theoretical basis for the design of rib support.
Elastic-Plastic Strain-Softening Model
Coal Deformation and Failure Characteristics
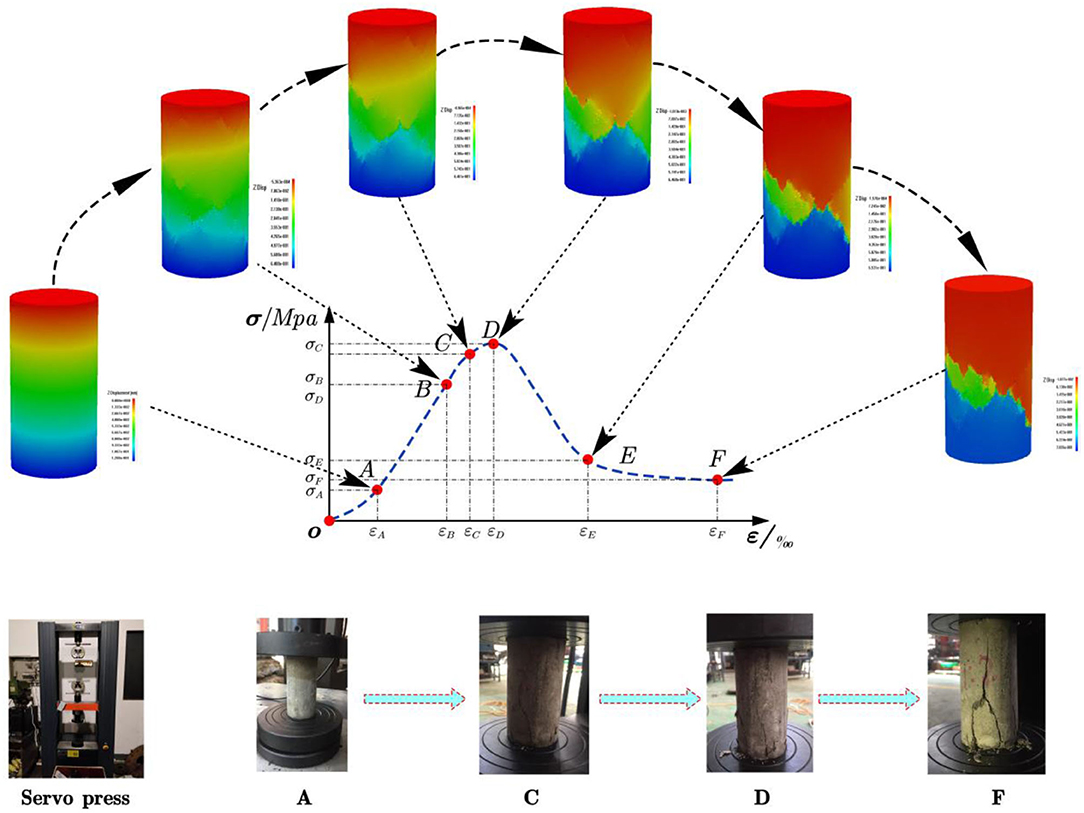
Coal is a rock mineral that forms during the sedimentary evolution of surface plants from the ancient past. The deformation and ring breaking process of the coal body is manifested by the compaction, generation, and development of fissures. Figure 1 shows the stress–strain relation of coal under different confining pressures. Under different confining pressures, the failure process and residual strength of coal show remarkable differentiation, normally showing elastic–plastic softening characteristics.
The coal failure process with an elastic–plastic softening characteristic can be represented by five sections of the stress–strain curve, as shown in Figure 1.
The OA section is the compaction phase that occurs during the initial loading stage of the coal sample; the strain rate is larger than the stress rate, the in-situ cracks are compacted, and the curve trends upward.
The AB section is the stage of linear elastic deformation; the stress–strain relationship of the coal body is linear. B is the elastic limit point, and new cracks form after point B.
The BD section is the strain-hardening section. Due to the generation, expansion, and transfixion of the new cracks in coal, the strain rate increases, which is represented by remarkable dilatation. Before the stress achieves critical strength, cracks are expanding relatively slowly in the BC section. After point C, cracks develop very rapidly in the CD section, the coal volume is expanded, and many vertical cracks occur, and at point D, the critical strength is reached.
The DE section is the plastic softening section, in which stress decreases rapidly along with crack development. The deformation increases, cracks connect and cut through the coal, and the coal sample is crushed by compression. The deformation characteristics of the coal sample are closely related to the internal crack compaction, expansion, and evolution.
The EF section is the flow deformation section, in which coal still has certain residual strength after failure due to lateral stress and internal friction.
Constitutive Model and Yield Criterion
A simplified perfect linear elastic-plastic softening model shown in Figure 2A is proposed based on the coal stress-strain curve discussed in the above section. The deformation process is divided into elastic deformation before critical strength, plastic softening after critical strength, and flow deformation. The degree of plastic softening can be represented by α (α ≠ 0).
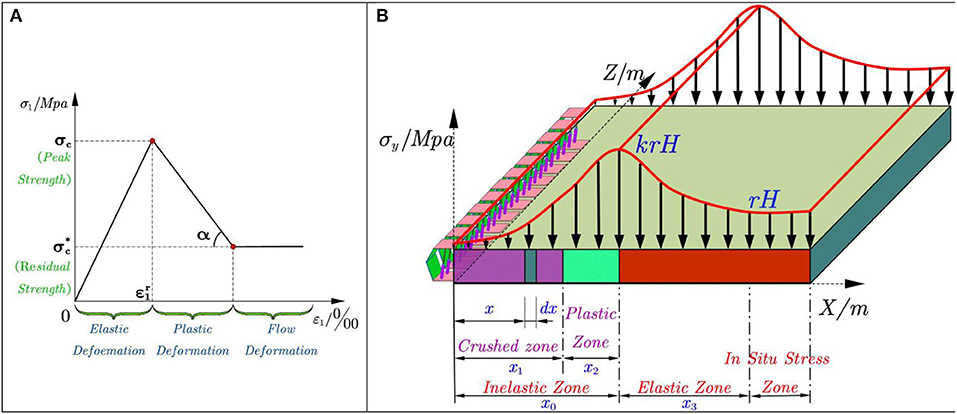
Figure 2. Elastic-plastic strain-softening model and abutment pressure distributions. (A) Elastic-plastic strain-softening model. (B) Distribution law of advance bearing pressure on the working face.
Elastic Deformation
Coal deformation in this section is in accordance with Hooke's Law, and the yield condition satisfies the Mohr-Coulomb criterion.
where , σc is the critical uniaxial compression strength of coal (MPa), , and C and φ are the cohesion (Mpa) and friction angle (°) of coal, respectively.
Plastic Deformation
In this section, the cohesion C decreases remarkably while the cohesion angle φ has insignificant change. Assuming that the cohesion angle is constant, coal strength decreases with the deformation. Coal strength under plastic softening is derived in Equation (2).
where is the plastic softening coal strength (Mpa), which can be derived from Equation (3).
M0 is the slope of the strain softening section, i.e., the softening modulus (MPa), M0 = tan α, and is the major principal strain when coal achieves critical strength, i.e., the major principal strain at the junction between elastic and plastic deformation.
Flow Deformation
In this section, the coal strength decreases to the residual value and the yield condition during flow deformation satisfies the Mohr-Coulomb criterion.
where , is the residual strength (MPa) with uniaxial compression, , and C* and φ* are the residual cohesion (Mpa) and friction angle (°) of coal. It is assumed that the internal friction angle is constant during the flow deformation section, i.e., φ* = φ, .
Abutment Pressure Distributions
The elastic deformation stage, plastic strain softening, and flow deformation stage of the elastic-plastic strain-softening model correspond to the elastic zone, plastic zone, and crushed zone of the coal rib, respectively. The strain-softening rules can be adopted here to study the abutment pressure distribution, as shown in Figure 2B. The z-axis in this figure represents the inclined length of the working face.
Inelastic Mechanics Model
In the inelastic zone, based on the ground control theory and the practical conditions of floor deformation, the roof stratum in the inelastic zone deforms linearly. Figure 3A shows the mechanics model in the inelastic condition. The abutment pressure in the inelastic zone under limit equilibrium condition can be derived.

Figure 3. Coal mechanics model in inelastic and elastic condition. (A) Inelastic mechanics model. (B) Elastic mechanics model.
In Figure 3A, taking differential unit dx, the normal stress, lateral stress, and the coal-roof and coal-floor interface friction resistance acting on the differential unit satisfy the stress limit equilibrium condition. Neglecting gravity, the equilibrium equations of the differential unit are as follows.
The equilibrium equation in lateral direction is (see Appendix),
where σy is the normal stress from the roof (MPa), C1 is the cohesion between coal and roof, floor (MPa), f1 is the friction coefficient between coal and roof, floor (°), H is the height of the coal seam (m), H = h1 + h2, h1 is the coal deformation at the rib (m), and h2 is the height of the coal seam at the rib (m).
The equilibrium equation in the vertical direction is,
where σyg is the normal stress from the floor (MPa).
Crushed Zone
The deformation angle θ of the real coal seam is pretty small. The stress condition of the differential unit is similar to in the coal sample experiment. Therefore, σ1 and σ3 in Equations (1), (2), and (4) can be substituted by σyg and σx in the inelastic stress limit equilibrium condition. The coal failure critical condition is
The boundary condition is
With Equations (7)–(11), the following equations can be derived,
Assuming
Equation (14) can be simplified,
Equation (15) is a linear first-order differential equation. By substituting the boundary condition in Equation (12), the lateral stress σx, vertical stress σyg, and abutment pressure σy can be calculated as follows.
where , .
As coal seam deformation h1 at the rib is very small comparing to the width of the inelastic zone, i.e., the deformation angle θ of the coal seam is very small, the coefficients A, B, C, and D in Equations (16)–(18) can be expanded in a Taylor Series on deformation angle θ as follows.
Substituting the above coefficients into Equations (16)–(18), the equations for calculating lateral stress σx, vertical stress σyg, and abutment pressure σy can be simplified as follows.
Plastic Zone
The plastic zone in the plastic strain-softening stage of the elastic-plastic strain-softening model is very small. The roof also has very little compression deformation in the plastic zone. The stress analysis can be conducted under the inelastic condition, and the plastic strain can be derived in the following equation.
where is plastic strain; is elastic strain; x0 is the width of the inelastic zone; x is the width of the crushed zone.
In the plastic softening stage, σ1 and σ3 in Equations (1) and (2) can be substituted by σyg and σx in the inelastic stress limit equilibrium condition. The critical condition for coal failure is
Substituting Equations (3) and (21) into Equation (22),
As the plastic zone and the crushed zone are continuous, when x = x1, the width of the plastic zone is,
where φ* = φ, .
With the stress continuous condition, the lateral stresses at x = x1 for the plastic zone and crushed zone are equal. The boundary condition is
Substituting Equation (25) at boundary condition (x = x1) into the differential equation derived from Equations (9), (10), and (23), the lateral stress σx, vertical stress σyg, and abutment pressure σy can be calculated as follows.
Since the deformation angle θ is small, it is two orders of magnitude different from h2, and it is reasonable to assume that , Equations (26) and (27) can be simplified to
To find the width of the inelastic zone (x0), we assume that the peak abutment pressure P at the elastic and plastic interface (x = x0) is
where K is the peak abutment pressure coefficient, γ is the average overburden density (N/m3), and H1 is the coal seam depth (m).
Based on the stress continuous condition, the abutment pressures at the elastic and plastic interface (x = x0) are equal; substituting Equation (30) into Equation (29), the width of the inelastic zone can be derived as follows.
The width of the crushed zone (x1) is,
Elastic Mechanics Model
Coal in the elastic zone has a single elastic stress distribution that shows high peak stress at the peak abutment pressure location. The ratio of lateral stress to abutment pressure is constant. In the whole elastic zone, coal is under an elastic compression condition. Therefore, as shown in Figure 3B, the stress equilibrium condition with ∑FX = 0 and shearing stress of a differential unit in the elastic zone of coal is
The lateral stress and vertical stress in the elastic zone have the following relationship
where β is the lateral stress coefficient.
For consideration of the friction resistance, and , it is reasonable to assume that
where x3 is the width of the elastic zone (m).
Substituting Equations (34) and (35) into Equation (33) and substituting the boundary condition , the abutment pressure in the elastic zone can be derived by the following equation.
When x = x0 + x3, substituting σy|x=x0+x3 = γH1 into Equation (36), the width of the elastic zone can be calculated by the following equation.
Parametric Analysis of Abutment Pressure
Underground coal ribs at a certain depth present remarkable strain-softening characteristics. Coal in front of the mining face will have an inelastic zone (crushed zone and plastic zone) and an elastic zone. The discussions in section Elastic-Plastic Strain-Softening Model show that the stress change gradient in the plastic zone is larger than in the crushed zone. The width of the plastic zone has nothing to do with the peak abutment pressure and only relates to the uniaxial compression strength, residual strength, mining depth, softening modulus, and deformation angle. However, the width of the crushed zone relates to the peak abutment pressure, the cohesion between coal and the roof and floor, and the friction coefficient. Discussions are made in this study on the impacts of the parameters on the abutment pressure. Taking the longwall panel at No. 5 coal of Dongjiahe Coal Mine in Chenghe mine field as an example, Table 1 shows the basic mechanical parameters. Parametric analysis will be conducted on these parameters.
Mining Depth
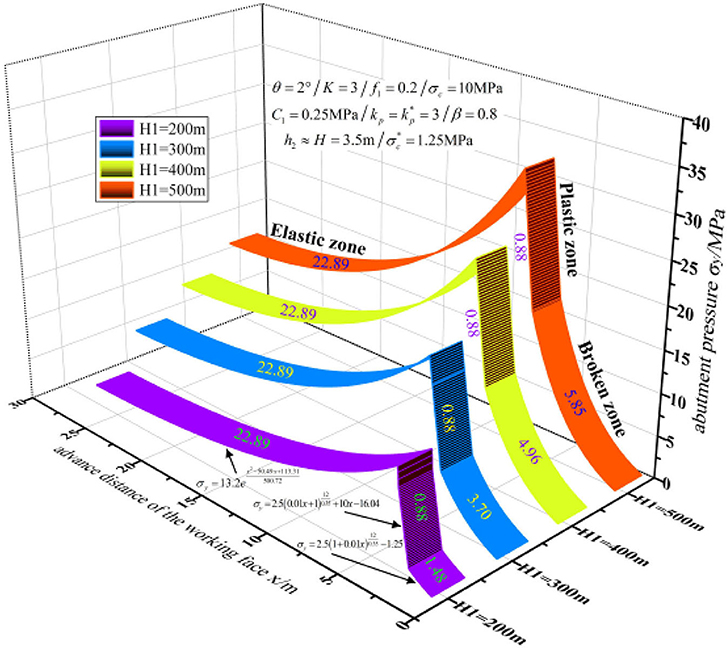
Substituting the parameters listed in Table 1 into Equations (20), (29), (31), (32), (36), and (37) with four mining depths of 200, 300, 400, and 500 m, the abutment pressure and the widths of different zones can be calculated. Figure 4 shows the abutment pressure curves vs. mining face location at various mining depths.
It can be discovered from Figure 4 that the widths of the crushed zone and inelastic zone increase by a logarithmic law with the increase in mining depth, and the mining depth has no impacts on the widths of the plastic zone and elastic zone. And at the same time, the abutment pressure changes at the crushed zone are identical. However, the peak abutment pressure increases with the increase in mining depth.
Deformation Angle
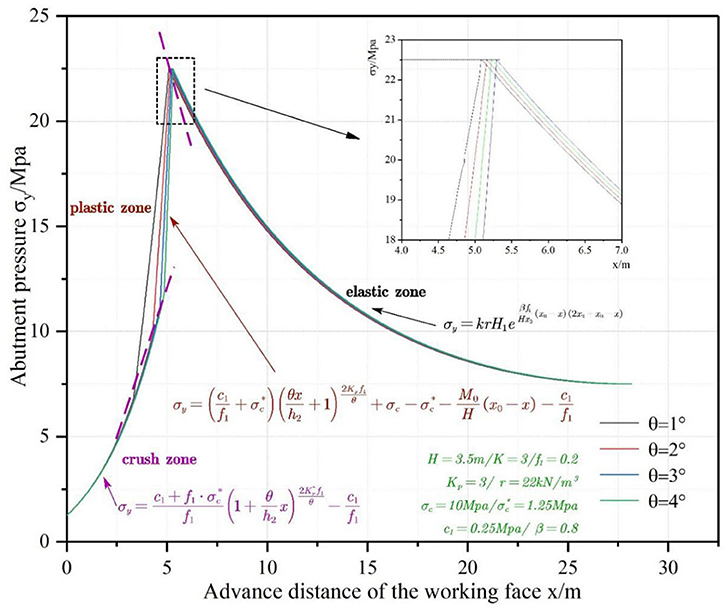
Four different deformation angles, i.e., 1°, 2°, 3°, and 4°, are substituted into the model to study the impacts on the abutment pressure. Figure 5 shows the abutment pressure curves vs. mining face location at various deformation angles.
It can be discovered from Figure 5 that the deformation angle has no impact on the widths of the elastic and inelastic zones. By substituting the deformation angle into the theoretical formula, it can be seen that when the deformation angle θ = 1°, the width of the crushed zone is 3.34 m, and the width of the plastic zone is 1.76 m; when the deformation angle θ = 2°, the width of the crushed zone is 4.28 m, and the width of the plastic zone is 0.88 m; when the deformation angle θ = 3°, the width of the crushed zone is 4.64 m, and the width of the plastic zone is 0.59 m; when the deformation angle θ = 4°, the width of the crushed zone is 4.85 m, and the width of the plastic zone is 0.44 m. The width of the crushed zone increases logarithmically with increase in the mining depth, and the width of the plastic zone decreases following a power law with increase in the mining depth. The abutment pressure curves at different deformation angles are similar, and the abutment pressure curves at the crushed zone and elastic zone almost overlap each other, which indicates that the deformation angle has no impact on abutment pressure.
Peak Abutment Pressure Coefficient
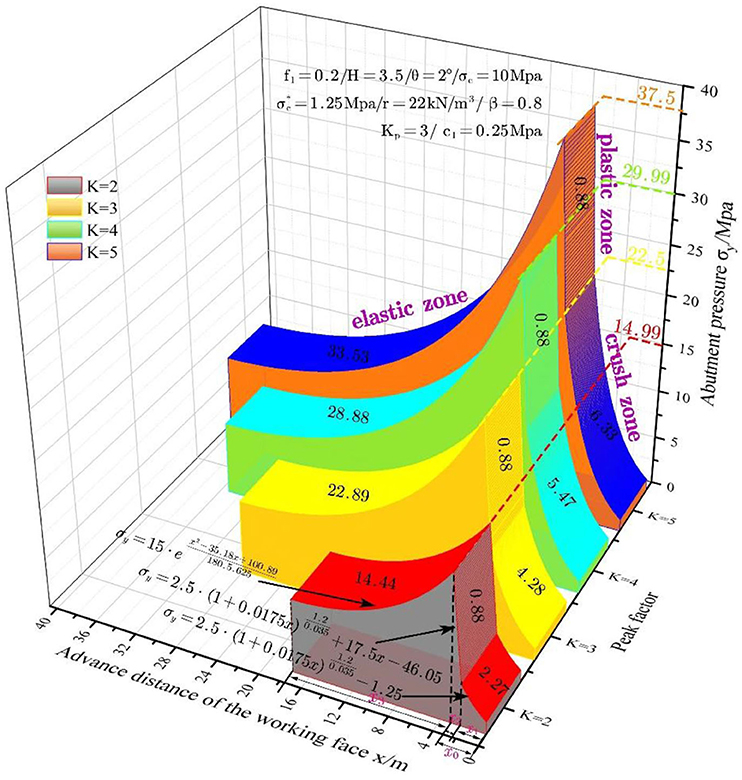
To study the impacts of the peak abutment pressure coefficient on the abutment pressure, four different peak abutment pressure coefficients, i.e., K = 2, 3, 4, and 5, are discussed. Figure 6 shows the abutment pressure curves vs. mining face location at various peak abutment pressure coefficients.
It can be discovered from Figure 6 that the widths of the crushed zone and inelastic zone increase following a logarithmic law with the increase in peak abutment pressure coefficient, and the width of the elastic zone increases following a parabolic law with the increase in peak abutment pressure coefficient. The peak abutment pressure coefficient has no impact on the width of plastic zone. At the same time, the abutment pressure increases remarkably with the increase in the peak abutment pressure coefficient.
Friction Coefficient
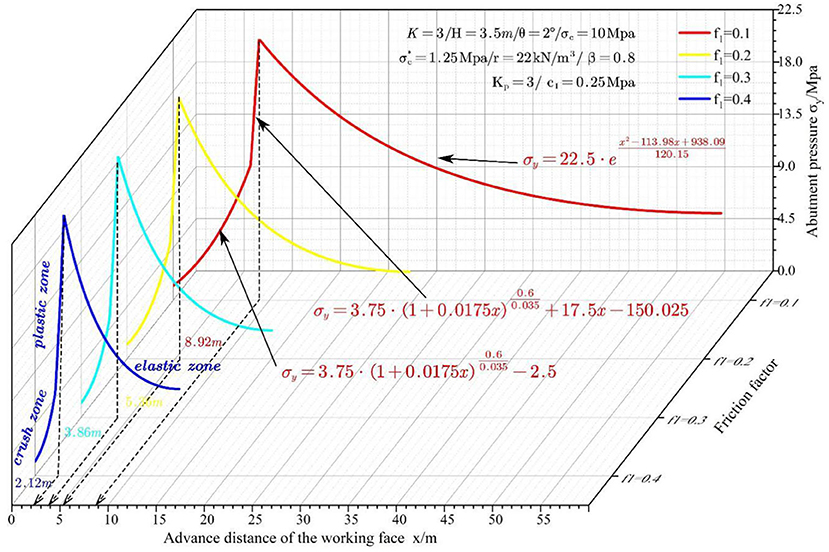
The impacts of the friction coefficient on the abutment pressure are discussed for four different friction coefficients, i.e., f1 = 0.1, 0.2, 0.3, and 0.4. Figure 7 shows the abutment pressure curves vs. mining face location at various friction coefficients.
It can be discovered from Figure 7 that the widths of the crushed zone and inelastic zone decrease following a logarithmic law with the increase in friction coefficient. The friction coefficient has no significant impact on the width of the plastic zone, while it has a remarkable impact on the width of the elastic zone. At the same time, the abutment pressure curve shifts to the left as the friction angle increases. The friction coefficient is only related to the lithology of the coal, roof, and floor, and the roughness of the interface. The deformation of coal has a very small influence on friction angle.
Cohesion
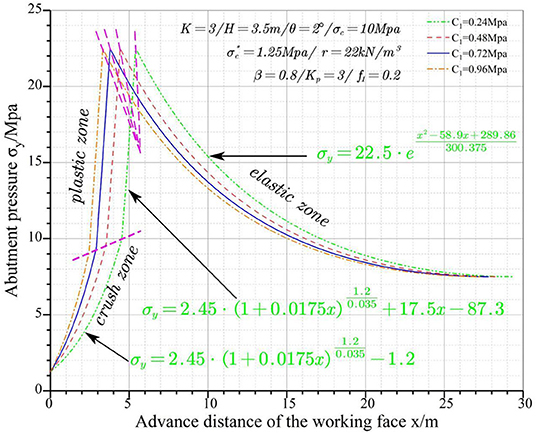
Four different cohesions, i.e., 0.24, 0.48, 0.72, and 0.96 MPa, are substituted into the model to study the impacts on the abutment pressure. Figure 8 shows the abutment pressure curves vs. mining face location at various cohesions.
It can be discovered from Figure 8 that the widths of the crushed zone and the inelastic zone decrease following a logarithmic law with the increase in cohesion. The cohesion has no significant impact on the width of the plastic zone and elastic zone. At the same time, the abutment pressure curve shifts to the left as the cohesion increases. The cohesion relates to the bonding condition between coal and the roof/floor and the relative slippage at the interface.
Uniaxial Compression Strength
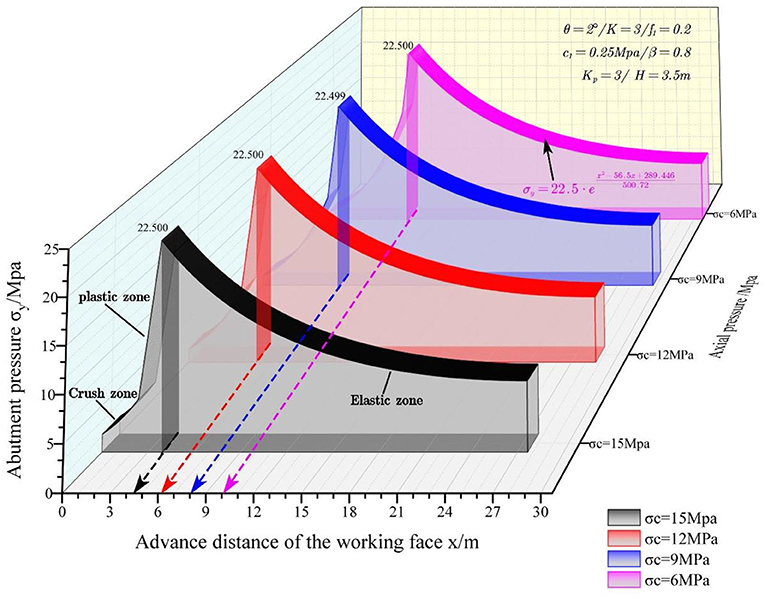
To study the impacts of the UCS on the abutment pressure, four different UCS values, i.e., σc = 6, 9, 12, and 15 MPa, are discussed. Figure 9 shows the abutment pressure curves vs. mining face location at various UCS values.
It can be discovered from Figure 9 that the widths of the crushed zone and inelastic zone decrease almost linearly with the increase in UCS. The width of the plastic zone increases almost linearly with the increase in UCS. The UCS has no significant impact on the width of the elastic zone. At the same time, the abutment pressure curve shifts to the left as the UCS increases.
Mining Height
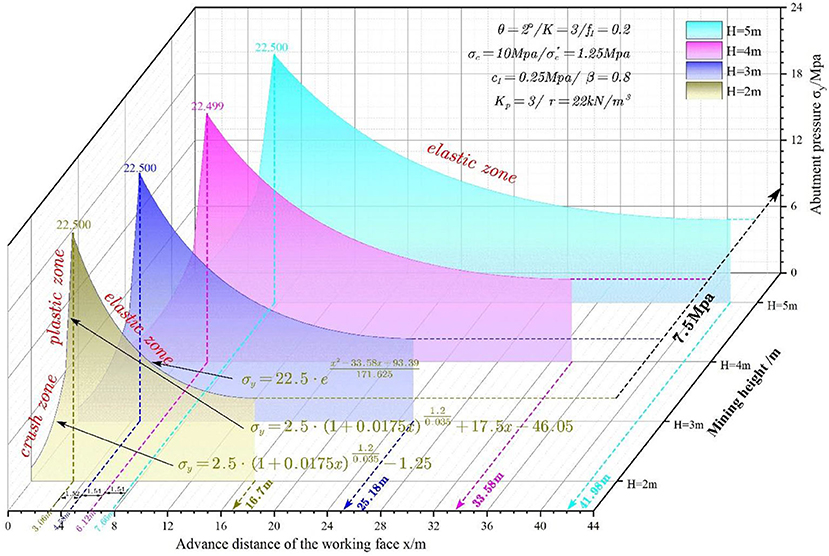
Four mining heights, i.e., 2, 3, 4, and 5 m, are substituted into the model to study the impacts on the abutment pressure. Figure 10 shows the abutment pressure curves vs. mining face location at various mining heights.
It can be discovered from Figure 10 that the widths of the crushed zone, plastic zone, inelastic zone, and elastic zone increase linearly with the increase in mining height. The width increase rate of the elastic zone is higher than those of the other three zones. The mining height has significant impacts on abutment pressure curves. The abutment pressure curve shifts to the right rapidly as the mining height increases.
Verification
A case study has been conducted at No. 5 coal seam (denoted “No. 5 Coal”) of Dongjiahe Coal Mine with field observations and measurements to verify the analytical model proposed in this study.
Longwall Panel Location and Mining Conditions
Dongjiahe Coal Mine is one of the major producing coal mines in Chenghe Coalfield in Shaanxi province. It was constructed and started to produce in December of 1980 and has a 40-year mining history. The coal seam is in the Taiyuan Group of the Upper Carboniferous system and the Shanxi Group of the Lower Permian system. Currently, the minable seams are No. 5 Coal and No. 10 Coal. No. 5 Coal is buried at a depth of about 173.64–420.04 m, and it is the major minable coal seam. No. 10 Coal is buried at a depth of about 190.5–452.5 m, and it is an unstable coal seam in which most of the seam can be mined. The coal mine utilizes slope access, with multiple mining elevations and uphill/downhill developments. The major mining seam now is No. 5 Coal, and its average thickness is 3.71 m.
Longwall panel 07 is at No. 5 Coal at Dongjiahe Coal Mine, is separated by a 30-m barrier pillar from panel 06 in the south, and is surrounded by solid coal in the north. Coal in this panel is completely developed with an average thickness of about 3.0 m. The surface elevations are about +644.2~+680.7 m, while the panel elevations are about +255~+273 m. The longwall panel is 910 m in strike direction and 114 m in dip direction. The coal seam is high in the south and low in the north, with coal seam being inclined by about 0°-15°. No. 5 Coal is at the upper section of the Taiyuan Group. The immediate roof is hard gray K4 medium sandstone with a thickness of 10.9–18.15 m and major components of quartz and silicon sludge cementing and with fairly developed cracks. The immediate floor is hard dark gray coarse sandstone with a thickness of 0.2–3.21 m and contains many mica plates and localized sandstone stripes. The main floor is K3 fine quartz sandstone or siltstone with a thickness of about 3.4–7.8 m.
The sizes of the headgate and tailgate are 3.4 × 2.8 m, and they are supported by bolt, mesh, anchor, and beam. The open cut excavates along the roof with a length of 114 m. Its cross-section is 6.6 × 3.0 m, and it is supported by bolt, mesh, anchor, and beam. This panel utilizes longwall retreat mining on the No. 5 Coal floor. ZY4600/18/42 shields are adopted for roof support. The roof above the gob area caves as mining advances.
Selection of Experiment Location
In order to obtain the stress distribution of the tailgate during retreat mining, an experiment was conducted at 80 m in front of the mining face in the tailgate of panel 07 at Dongjiahe Coal Mine. Figure 11 shows a layout diagram of the actual measurement of coal pillar advance bearing pressure.
Vibration wire borehole stress gauges (XL-YSYLJ) (as shown in Figure 11) and data loggers were installed in the tailgate perpendicular to the gate road direction for monitoring the abutment pressure distribution during retreat mining. Three boreholes were prepared, with one vibration wire borehole stress gauge (XL-YSYLJ) for each borehole, which were located at 60, 80, and 100 m from the open cut. The depths of the boreholes were 10 m to avoid the influence of stress concentration around the tailgate. The spacing between each group of survey lines was 20 m, and the borehole was about 1.6 m above the floor.
The data were recorded once per cut (0.6 m) when the longwall face was <15 m from the survey station, once per two cuts (1.2 m) when the distance from the survey station to the longwall face was about 15–30 m, and once per four cuts (2.4 m) when the longwall face was more than 30 m from the survey station.
Abutment Pressure Measurements
Monitoring of the abutment pressure was conducted at the tailgate of the longwall panel. The data are processed to obtain the abutment pressure curves vs. distance of the working face and survey station. Figure 12 shows the abutment pressure distribution curves.
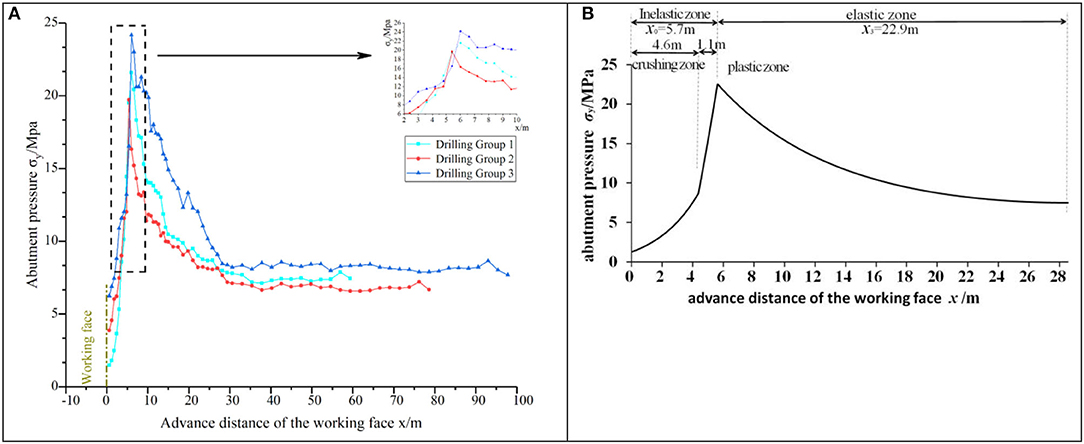
Figure 12. Abutment pressure distribution curve. (A) Field monitoring of abutment pressure distribution. (B) Theoretical fit curve of the abutment pressure distribution.
According to Figure 12A, the borehole stress gauge readings decrease after installation. This is because the coal surrounding the borehole deforms and becomes loose when subject to the initial pressure of the borehole stress gauge. As the deformation of the borehole continues, the stress will achieve a stable condition; this stress is the initial stress of the borehole. For borehole stress gauge 1, the peak abutment pressure is 22.73 MPa, occurring at about 5.8 m from the longwall face (inelastic zone width), the stress concentration coefficient is 3.12, the abutment pressure influence zone is 27.8 m (width of the inelastic zone and elastic zone), and the apparent influence distance is 4.2 m (crushed zone). For borehole stress gauge 2, the peak abutment pressure is 19.72 MPa, occurring at about 5.4 m from the longwall face (inelastic zone width), the stress concentration coefficient is 2.92, the abutment pressure influence zone is 30.2 m (width of the inelastic zone and elastic zone), and the apparent influence distance is 4.8 m (crushed zone). For borehole stress gauge 3, the peak abutment pressure is 23.84 MPa, occurring at about 6.2 m from the longwall face (inelastic zone width), the stress concentration coefficient is 2.90, the abutment pressure influence zone is 28.6 m (width of the inelastic zone and elastic zone), and the apparent influence distance is 4.2 m (crushed zone). Table 2 lists the data from the three stress gauges.
Comparison
Table 3 shows a comparison of the theoretical calculations and the field measurements. The theoretical fitting curve of the bearing pressure distribution of the working face can be drawn using the figures in Table 3, as shown in Figure 12B.
Relative error analysis was applied to compare the theoretical calculations and field measurements. The lower the relative error, the higher the precision. It is shown in Table 3 that the abutment pressure distribution and the widths of the inelastic zone and the elastic zone coincide with the field measurements very well, which indicates that the theoretical model has very high accuracy.
Conclusions
Coal near the mining face presents remarkable strain-softening characteristics. The coal in front of the mining face has a crushed zone, a plastic zone, and an elastic zone when subjected to overburden stress.
The elastic deformation stage, plastic strain-softening stage, and flow deformation stage of the elastic–plastic strain-softening model correspond to the elastic zone, plastic zone, and crushed zone of the coal rib, respectively. Our abutment pressure model was built based on the strain-softening characteristics of coal. The equations calculating abutment pressure and the widths of the elastic zone and inelastic zone (crushed zone and plastic zone) were derived.
Parametric analysis was conducted on the abutment pressure model. The strain change rate in the plastic zone is larger than in the crushed zone. The width of the plastic region is independent of the peak abutment pressure, but it is dependent on the UCS, residual strength, mining height, softening modulus, and deformation angle.
A case study was carried out at longwall panel 07 of No. 5 coal seam in Dongjiahe Coal Mine to verify the analytical model. The abutment pressure distribution and the widths of the elastic and inelastic zones under the limit equilibrium condition were calculated based on the relevant parameters. The theoretical results were compared with the field monitoring data and showed a very good fit. It is thus proven that the proposed analytical model has high accuracy, and the feasibility of the model is verified. The study results can provide guidance for similar engineering applications.
Patents
This manuscript has produced five invention patents.
Firstly, the invention patent “Monitoring and Measuring Device and Installation and Measuring Method for Multi-point Separation of Roadway Surrounding Rock Mass” (patent number: ZL 2013 10614482.5) is used to monitor the deformation of the plastic zone of a coal and rock mass. Secondly, according to the theory of the manuscript, theoretical calculation is carried out. Then, based on the theoretical calculation results, the width of the artificial or natural coal pillar in the retaining roadway is used to select the length of the bolt and cable used. Four patents have been granted as follows: “A Supporting Method for Setting up Double Roadways in One-time Driving with U-type Ventilation” (ZL 2016 10459175.8); “A Production Line for Double Roadway Excavation in One-time Excavation” (ZL 2016 10459072.1); “A Reinforcement Method of Narrow Coal Pillar in Gob-side Driving Roadway” (ZL 2016 10536888.X); “Anchorage Structure and Reinforcement Method of Narrow Coal Pillar in Gob-side Retaining Roadway” (ZL 2016 10537791.0).
Data Availability Statement
The raw data supporting the conclusions of this article will be made available by the authors, without undue reservation.
Author Contributions
AL and QMa: conceptualization, writing—original draft preparation, and writing—review and editing. AL: methodology, project administration, and funding acquisition. QMa: software. AL, LM, and LK: validation. AL and QMu: data curation. AL and JC: supervision. All authors: contributed to the article and approved the submitted version.
Funding
This research was funded by the Natural Science Basic Research Program of Shaanxi (2020JZ-52); Key Laboratory of Coal Resources Exploration and Comprehensive Utilization, Ministry of Land and Resources (KF2018-2); the Basic Science Research Project of Shaanxi Province (2014JM2-5064); the National Natural Science Foundation of China (41402265); the Basic Research Project of Shaanxi Natural Science Foundation of China (2016JM4014); and the China Postdoctoral Science Foundation (2016M590961).
Conflict of Interest
LK was employed by Shaanxi Coalfield Geophysical Prospecting and Surveying Group Co. Ltd.
The remaining authors declare that the research was conducted in the absence of any commercial or financial relationships that could be construed as a potential conflict of interest.
Acknowledgments
The authors heartily thank the above fund projects, without support of which the data and field test equipment needed to complete this study could not have been obtained.
References
1. Yuan WB, Chen J. Analysis of plastic zone and loose zone around opening in softening rock mass. J China Coal Soc. (1986) 11:77–85.
2. Fellgett MW, Kingdon A, Waters CN, Field L, Ougier-Simonin A. Lithological constraints on borehole wall failure; a study on the pennine coal measures of the United Kingdom. Front Earth Sci. (2019) 7:163. doi: 10.3389/feart.2019.00163
3. Hou CJ, Ma NJ. Stress in in-seam roadway sides and limit equilibrium zone. J China Coal Soc. (1989) 14:21–9.
4. Islavath SR, Deb D, Kumar H. Development of a roof-to-floor convergence index for longwall face using combined finite element modelling and statistical approach. Int J Rock Mech Min Sci. (2020) 127:104221. doi: 10.1016/j.ijrmms.2020.104221
5. Ma NJ. A study of plastic zone around openings in the softening rock mass. J Fuxin Min Inst: Nat Sci. (1995) 14:18–21.
6. Yadav A, Behera B, Sahoo SK, Singh GSP, Sharma S. An approach for numerical modeling of gob compaction process in longwall mining. Min Metall Exp. (2020) 37:631–49. doi: 10.1007/s42461-020-00182-0
7. Zheng GR, Yang WB. A calculation method of the failure zone width of the coal-wall of roadway in seams. J China Coal Soc. (2003) 28:37–40. doi: 10.1007/s11769-003-0003-x
8. Yang XJ, Wang EY, Ma XG, Zhang GF, Huang RF, Lou HP. A case study on optimization and control techniques for entry stability in non-pillar longwall mining. Energies. (2019) 12:391. doi: 10.3390/en12030391
9. Li SQ, Pan CL, Wang WJ. Analysis of plastic region of sidewalls in coal drifts reinforced by association of rock bolt and grouting. J Hunan Univ Nat Sci Ed. (2007) 22:5–8.
10. Huang QX, Cao J. Research on coal pillar malposition distance based on coupling control of three-field in shallow buried closely spaced multi-seam mining, China. Energies. (2019) 12:462. doi: 10.3390/en12030462
11. Yao QL, Zheng CK, Tang CJ, Xu Q, Li XH. Experimental investigation of the mechanical failure behavior of coal specimens with water intrusion. Front Earth Sci. (2020) 7:348. doi: 10.3389/feart.2019.00348
12. Xu GA, Jing HW, Ding SX, Niu SJ, Ma B. Evolution rules of stress and displacement for narrow coal pillars between double gob- side entries. J Min Saf Eng. (2010) 27:160–5. doi: 10.1145/1806596.1806616
13. Xie GX, Yang K, Liu QM. Study on distribution laws of stress in inclined coal pillar for fully-mechanized top-coal caving face. China J Rock Mech Eng. (2006) 25:545–9. doi: 10.3321/j.issn:1000-6915.2006.03.017
14. Li A, Liu Y, Mou L. Impact of the panel width and overburden depth on floor damage depth in no. 5 coal seam of Taiyuan Group in Chenghe mining area. Electron J Geotech Eng. (2015) 20:1603–17.
15. Jayanthu S, Singh TN, Singh DP. Stress distribution during extraction of pillars in a thick coal seam. Rock Mech Rock Eng. (2004) 37:171–92. doi: 10.1007/s00603-003-0003-2
16. Gong SC, (editor). Study on the plastic displacement solution in the coal-side. In: Theory and Practice of Western Mine Construction Projects Proceedings. Xuzhou: China University of Mining and Technology Press (2009). p. 264–8.
17. Qu Q. Study on distressing technology for a roadway driven along goaf in a fully mechanized top coal caving face. J Coal Sci. Techno. (2003) 9:33–7.
18. Wang Z, Yin L, Chen J, Ma K. Research on distribution law of advanced abutment pressure in deep soft rock working face. Grotech Geol Eng. (2019) 37:4089–97. doi: 10.1007/s10706-019-00895-0
19. Fairhurst C. General report: deformation, yield, rupture and stability of excavations at depth in rock. Int Soc Rock Mech Rock Eng. (1989) 98:1103–14.
20. Xue Y, Dang FN, Gao ZZ, Du F, Ren J, Chang X, et al. Deformation, permeability and acoustic emission characteristics of coal masses under mining-induced stress paths. Energies. (2018) 11:2233. doi: 10.3390/en11092233
21. Zhang JW. Stability of split-level gob-side entry in ultra-thick coal seams: a case study at xiegou mine. Energies. (2019) 12:628. doi: 10.3390/en12040628
22. Zhou XP, Wang FH, Qian QH, Zhang BH. Zonal fracturing mechanism in deep crack-weakened rock masses. Theor Appl Fract Mech. (2008) 50:57–65. doi: 10.1016/j.tafmec.2008.04.001
23. Ma XG, He MC, Wang J, Gao YB, Zhu DY, Liu YX. Mine strata pressure characteristics and mechanisms in gob-side entry retention by roof cutting under medium-thick coal seam and compound roof conditions. Energies. (2018) 11:2539. doi: 10.3390/en11102539
24. Sellers EJ, Klerck P. Modeling of the effect of discontinuities on the extent of the fracture zone surrounding deep tunnels. Tunn Undergr Sp Tech. (2000) 15:463–9. doi: 10.1016/S0886-7798(01)00015-3
25. Ren L, Xie HP, Xie LZ, Ai T. Preliminary study on strength of cracked rock specimen based on fracture mechanics. Eng. Mech. (2013) 30:156–62. doi: 10.6052/j.issn.1000-4750.2011.07.0464
26. Xu SP, Mao XB, Zhang DS. Study on pillar's plastic zone based on elastic visco-plastic theory. J Liaoning Tech Univ. (2006) 25:194–6.
27. Huang BX, Liu CY, Zhen BS, Cheng QY. Distribution abutment pressures on laneway pillars for super-wide isolated fully mechanized top coal caving face. China J Rock Mech Eng. (2007) 29:932–7. doi: 10.1016/S1872-2067(07)60020-5
28. Li SQ, Wang WJ, Pan CL, Peng B. Stability analysis of sidewalls of horizontal coal drifts. J Hunan Univ Nat Sci Ed. (2008) 23:1–4.
29. Zhou XP, Qian QH, Zhang BH, Zhang YX. The mechanism of the zonal disintegration phenomenon around deep spherical tunnels. Eng Mech. (2010) 27:69–75. doi: 10.3724/SP.J.1011.2010.01138
30. Zhang JW, Li YL. Coal strength development with the increase of lateral confinement. Energies. (2019) 12:405. doi: 10.3390/en12030405
31. Yu YX, Hong X, Chen FF, Chen F. Study on load transmission mechanism and limit equilibrium zone of coal wall in extraction opening. J China Coal Soc. (2012) 37:1630–5. doi: 10.1007/s11783-011-0280-z
Appendix
The proof process of Equation (9):
As shown in the figure above, the mechanical analysis of σy, T1 and B is carried out:
According to equation (5), the equilibrium equation can be listed:
The formula (9) is obtained by simplifying the above formula.
Keywords: abutment pressure distribution, elastic-plastic strain-softening model, coal limit equilibrium zone, influencing factor, case verification
Citation: Li A, Ma Q, Ma L, Kang L, Mu Q and Chen J (2020) Coal Mine Abutment Pressure Distribution Based on a Strain-Softening Model. Front. Phys. 8:263. doi: 10.3389/fphy.2020.00263
Received: 30 March 2020; Accepted: 11 June 2020;
Published: 11 August 2020.
Edited by:
Guoyang Fu, Monash University, AustraliaReviewed by:
Muktish Acharyya, Presidency University, IndiaAllbens Picardi Faria Atman, Federal Center for Technological Education of Minas Gerais, Brazil
Copyright © 2020 Li, Ma, Ma, Kang, Mu and Chen. This is an open-access article distributed under the terms of the Creative Commons Attribution License (CC BY). The use, distribution or reproduction in other forums is permitted, provided the original author(s) and the copyright owner(s) are credited and that the original publication in this journal is cited, in accordance with accepted academic practice. No use, distribution or reproduction is permitted which does not comply with these terms.
*Correspondence: Ang Li, YW5nbGlAeHVzdC5lZHUuY24=
 Ang Li
 Qiang Ma1,3