 Thomas Wanek
 Lara Schöllbauer
 Thomas Filip
 Severin MairingerMichael SaubererMatthias Blaickner
 Claudia Kuntner*
- Preclinical Molecular Imaging, AIT Austrian Institute of Technology GmbH, Seibersdorf, Austria
Background: Whole-body PET images can be obtained by using the “step-and-shoot” (SaS) method (using multiple bed positions) or continuous bed motion (CBM). As transmission scans are not always feasible, an alternative method where attenuation data can be generated via emission-based attenuation correction (AC) maps is of interest. The aim of this preclinical study was to investigate the influence of the acquisition method and AC on the quantitation accuracy of [18F]FDG-PET.
Methods: [18F]FDG-PET phantom images were acquired using either SaS or CBM. Transmission scans were recorded for the SaS method using a 57Co-point source. Emission-based attenuation sinograms were obtained from the images after segmentation and inverse Fourier rebinning. PET images were reconstructed without AC, transmission based (TX-AC) and emission-based (EM-AC) attenuation correction. Moreover, [18F]FDG-PET scans of rats bearing mammary carcinomas acquired using either SaS or CBM were analyzed retrospectively and quantification in tissues was compared.
Results: Phantom recovery coefficients (RC) varied greatly, ranging from 0.49 ± 0.01 to 1.15 ± 0.07, dependent on acquisition method, reconstruction algorithm and AC method. In CBM acquired images, EM-AC improved quantification accuracy when compared to no-AC images in the phantom studies (RC 0.79 ± 0.02 vs. 0.49 ± 0.01, respectively) and in tumors of rats (DMBA model: 1.16±0.42 SUV vs. 0.86±0.28 SUV, respectively).
Conclusion: The method of AC has a strong influence on the quantification of [18F]FDG. Our data indicates that EM-AC improves quantification in images obtained by CBM and SaS. However, the obtained values were still underestimated when compared to TX-AC corrected images.
Introduction
Quantitative whole-body examinations are one of the key strengths of preclinical positron emission tomography (PET) and computed tomography (CT) systems. However, due to the restricted axial field of view (FOV) of several centimeters both in clinical and preclinical PET scanners, a whole-body scan in humans or larger animals such as rats or rabbits cannot be recorded in one single scan acquisition. Therefore, for obtaining a whole-body scan, two different scanning methods are commonly applied.
In the first method, the “step-and-shoot” (SaS) method, several emission scans are recorded using multiple bed positions to cover the whole body [1]. For this, the subject is positioned on the bed, moved to the first bed position and coincidences are recorded for a predefined time (e.g., 10–15 min). Then the bed is moved to the next position and the procedure is repeated. Typically, the bed positions overlap each other for several cm in order to facilitate subsequent processing of the images. To correct for photon attenuation in the scanned subject, a separate attenuation correction (AC) scan is recorded for each single bed position in singles mode using either a transmission source such as 57Co (TX-AC) or a CT-based attenuation map [2]. Finally, the reconstructed and TX-AC corrected images are stitched, and decay corrected using algorithms usually implemented in the scanner software. The advantage of this method is that it usually follows established laboratory procedures for emission scans as this type of scanning is routinely performed and it provides a higher slice sensitivity [3]. However, scanning time is increased for each scanned individual which significantly decreases the daily imaging throughput.
An alternative method to the SaS-method is the continuous bed motion (CBM) method. Here, the bed is continuously moved horizontally back and forth through the axial FOV between a specified start- and end-position and coincidences are recorded. The main advantage of this method is that it provides a more uniform sensitivity over the entire image and offers better image quality due to over sampling [4], which often aids in the identification of smaller tumors or affected lymph nodes. Preclinical PET systems have implemented CBM since 2009 [5, 6], whereas the clinical implementation just started more recently [7–10]. The main disadvantage of CBM in preclinical imaging is that it usually does not offer the possibility to perform a transmission scan required for AC. This is of special relevance for stand-alone preclinical PET scanners, which are not combined with a CT and can thus not use the CT image to generate a μ-map for attenuation correction. Consequently, the improved image quality provided by CBM comes at the cost of a decreased quantification accuracy. One way to overcome this issue is the generation of emission-based attenuation correction (EM-AC) factors or maps [11]. Here, image data is first segmented assuming a uniform attenuation in manually delineated regions and then forward projected to generate an attenuation sinogram, which is then used for attenuation correction during image reconstruction [12]. This method is relatively fast, easy to use and implemented in most preclinical PET systems. In addition, EM-AC eliminates the time required for an extra attenuation measurement, resulting in a significant reduction in overall scanning time.
In this study we compared No-AC, TX-AC, and EM-AC and their influence on image quantification by phantom measurements acquired using the SaS and CBM method. We furthermore investigated the biological relevance of our findings by performing a retrospective analysis of a dataset of [18F]FDG-PET scans in rats bearing chemically induced breast cancer tumors. We first evaluated brain and liver uptake in whole-body scans of rats acquired using the SaS method and applied no-AC, TX-AC, or EM-AC during reconstruction of the images. Secondly, we assessed whole-body scans of rats acquired using the CBM method and compared the quantification in tumors in reconstructed images using either filtered back projection (FBP) or ordered subset expectation maximization (OSEM) with or without EM-AC.
Methods
Phantom Study
A cylindrical hollow phantom made from polyethylene with a diameter of 7 cm, a length of 16.5 cm and a wall thickness of 0.2 cm was filled with 36.1 ± 8.0 MBq aqueous [18F]FDG solution and placed on the scanner bed of a preclinical PET scanner (micro PET Focus 220, Siemens Healthineers, Knoxville, TN, USA), which provides 7.6 cm axial and 22 cm transaxial FOV [13]. After moving the phantom to the center FOV, PET emission scans at 3 consecutive bed positions were acquired for 10 min/bed position with an energy window of 350–750 keV and a coincidence time window of 6 ns. The horizontal bed position was moved between the measurements in axial direction for ~6.6 cm to cover a total axial FOV of 20.8 cm. A horizontal overlap of 1 cm was applied to the images to facilitate further stitching of the images. Afterwards, a 10-min transmission scan using a rotating 57Co point source (120–125 keV energy window) was recorded in singles mode for each bed position. CBM measurements were performed by placing the phantom on the scanner bed and a subsequent emission recording for a time of 20 min (350–750 keV energy window, 6 ns timing window). The phantom was moved through the field of view for four times back and forth (8 passes) to cover the same region of interest multiple times during data acquisition spanning an axial FOV of 27.1 cm.
Animal Studies
Chemicals
Radiosynthesis and quality control of [18F]FDG was performed using standard methods [14]. 1-Methyl-1-nitrosourea (MNU) and 1-methyl-1 nitrosourea (DMBA) were obtained by Sigma-Aldrich (Schnelldorf, Germany). For in vivo application, MNU was dissolved in sterile saline solution and acidified to pH 5.0 with acetic acid. DMBA was dissolved in sesame oil.
Research Animals and Tumor Induction
Female 5–6 weeks old Sprague-Dawley rats (Crl:CD, Charles River, Sulzfeld, Germany) were initially used in the study. Animals were housed in groups in a temperature and humidity-controlled facility on a 12 h light/ dark cycle and fed a standard laboratory diet. Food and water were available ad libitum and animals were weighed weekly during the experiment. Tumors were generated following published procedures by the administration of the carcinogens MNU [15, 16] or DMBA as follows [17, 18]. MNU was injected intraperitoneally at a dose of 50 mg/kg and a volume of 5 mL/kg body weight (n = 12). If animals did not exhibit tumors within 3 weeks, MNU injection was repeated on day 29 and day 57 after initiation of the study. DMBA was administered by oral gavage at a dose of 20 mg/kg (n = 8) or 50 mg/kg BW (n = 12) at a volume of 5 mL/kg. Animals were observed regularly to determine the development and localization of tumors. All experiments involving laboratory animals were approved by the respective authorities and the study procedures were in full accordance with the European Communities Council Directive of September 22, 2010 (2010/63/EU). All procedures were in compliance with the institutional biosecurity and radiation safety regulations.
PET Imaging Procedure
At the time point of PET imaging, mean body weight of rats were 236 ± 33 g. The following standardized imaging setup was applied for all [18F]FDG scans [19–21]. In brief, rats were deprived of food for 18 ± 4 h prior [18F]FDG administration. Rats had access to drinking water at all times. Body warming was achieved by placing the entire cage on a heating pad kept at 38°C. Warming was initiated ~30 min before tracer injection and continued throughout the uptake and image acquisition period. Rats were pre-anesthetized by inhalation anesthesia (1–4% isoflurane in oxygen) in an induction box. Subsequently, 0.1 mL containing 30.0 ± 12.5 MBq [18F]FDG solution diluted with saline was administered intravenously via tail vein injection under isoflurane anesthesia. Rats were kept anesthetized throughout the whole uptake and imaging period and the isoflurane concentration level was adjusted to obtain a breathing rate of 20–60 breath/min during the PET acquisition, indicating a comparable level of anesthesia.
PET emission data with an energy window of 350–750 keV and a coincidence time window of 6 ns were acquired at 1 h after [18F]FDG injection into rats (n = 9) using the SaS method for 10 min/bed position with three bed positions to cover the whole body of the animal. The bed was moved from one position to the next by 6.6 cm covering in total an axial FOV of 20.8 cm. Overlap in the resulting images between the positions was 1 cm. Before the emission scan, an attenuation measurement was done with the rotating 57Co point source for 10 min at each position. Total scan time per animal was 60 min.
In a second cohort of rats (n = 20) a 20 min scan (350–750 keV energy window, 6 ns timing window) was acquired at 1 h after [18F]FDG injection using the CBM tool to cover the whole body of the rats. Thereby, the bed was slowly moved through the FOV for four times back and forth (8 passes) covering an axial FOV of 27.1 cm.
Image Data Generation and Analysis
As the rat images were analyzed retrospectively, some of the original raw data (list mode files and sinograms) were no longer available. Thus, all emission sinograms used for comparing different AC methods were generated by inverse Fourier rebinning from the available image files, which were originally reconstructed using Fourier rebinning (FORE) followed by filtered back projection (FBP), using the forward projection tool implemented in the image analysis software ASIPro VM 6.0 (Siemens Healthineers). To be consistent, we applied the same procedure to the acquired phantom images. The thus generated emission sinograms were further used for image reconstruction as described below. To validate this approach, we also compared image files reconstructed from the generated emission sinograms with image files from the original emission sinograms (when available).
The generated emission sinograms were reconstructed using FORE followed by FBP algorithm with ramp filter or OSEM at an image zoom of 3.163 and an image matrix of 128 × 128 × 95 (SaS) or 128 × 128 × 351 (CBM) resulting in a voxel size of 0.6 × 0.6 × 0.796 mm3. The standard data correction protocol (normalization, decay correction, and injection decay correction) was applied to the data. Scatter correction was not applied to the emission data as the used reconstruction software does not permit scatter correction of non-AC data to allow for a comparable ratio between the AC and non-AC corrected images.
For calculation of the EM-AC file, the emission calibration and segmentation tool implemented in ASIPro VM 6.0 was used. PET emission images were segmented to obtain the outer border of the phantom or the rat. The area inside the segmented phantom or rat was assumed to be water and assigned an attenuation coefficient of 0.095 cm−1 (511 keV), the area outside was assumed to be background and assigned an attenuation coefficient of 0 cm−1. After segmentation was completed, a 2D sinogram was projected and inverse Fourier rebinning with a span of 47 and a ring difference of 23 was performed. The obtained sinogram was defined as emission-based sinogram (EM-AC sinogram) for attenuation correction. The flow chart of the processed image data, calculated sinograms and reconstructed image files is depicted in Figure 1. Images were reconstructed without (No-AC), with transmission-based (TX-AC) and with emission-based (EM-AC) attenuation correction. Images obtained with the SaS technique were stitched together using the stitching tool implemented in ASIPro VM 6.0.
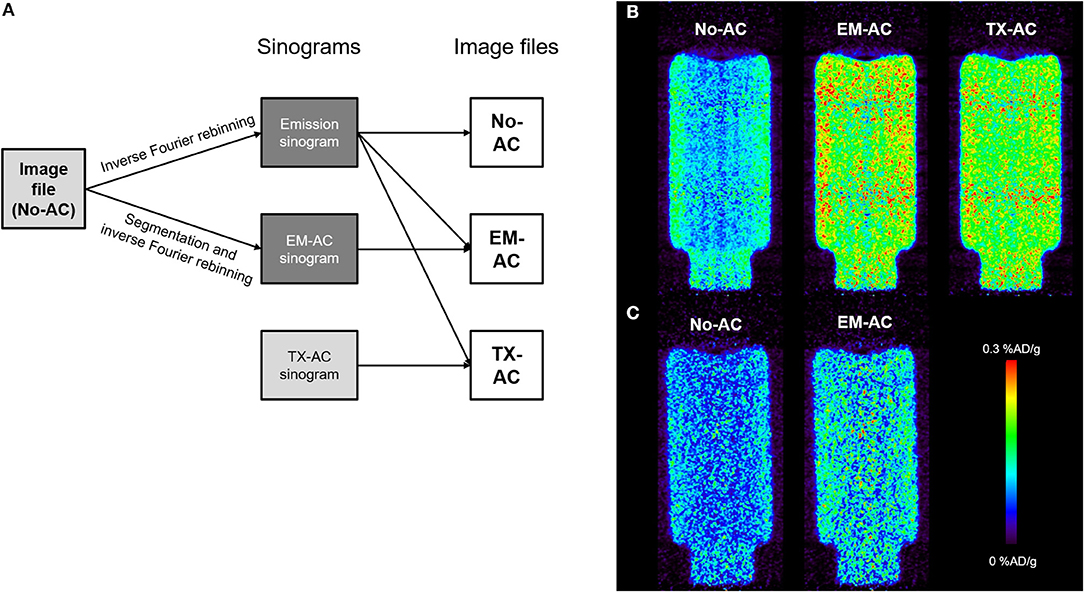
Figure 1. (A) Flow chart of the steps involved in the emission-based (EM-AC) and transmission-based (TX-AC) attenuation correction in the current study. Data files in light gray are original data (images or sinograms), data files in dark gray were calculated from the image files and final image files reconstructed using the 3 different AC methods (No-AC, EM-AC and TX-AC). (B) Phantom FDG-PET images acquired using the SaS method with 3 bed positions and C) phantom FDG-PET images acquired using the CBM method. The applied AC method is indicated in the images and PET images are displayed in percent applied dose per gram (%AD/g).
A calibration factor for converting units of PET images into absolute radioactivity concentration units was generated by imaging a phantom filled with a known concentration of [18F]FDG at identical measurements parameters and reconstructed using FBP including TX-AC. The activity concentration in the phantom was calculated from the activity measured in a dose calibrator (CRC-25R, Capintec Pittsburgh, PA, USA) and the fill volume of the phantom.
Three cylindrical volumes of interest (VOI) with a diameter of 55 mm and 10 mm height were outlined on multiple planes of the PET images from the phantom study using the image analysis software Amide [22]. For evaluation of the effects of different AC methods the recovery coefficients (RC) as the ratio of measured activity concentration to known activity concentration for each AC method were calculated with the following equations:
where CT is the radioactivity concentration derived from the target VOI in kBq/cc in the uncorrected image (No-AC), TX-AC, and the EM-AC corrected image, respectively. Cknown is the known radioactivity concentration calculated from the administered radioactivity (kBq) measured in a dose calibrator and the fill volume of the phantom (mL) under the assumption of a density of water of 1 g*mL−1.
In the animal studies, predefined ellipsoidal or spherical VOIs were applied for whole brain (12 × 20 × 8 mm3) and liver (10 mm diameter) whereas the tumor was manually delineated on multiple planes of the PET images. The derived [18F]FDG concentration values were calculated from the mean and max value of the VOI and quantified in terms of standardized uptake value (SUVmean and SUVmax) using the following equation:
where CT is the mean or maximum radioactivity concentration in the target VOI in kBq/cc, DInj the administered dose in kBq and WS the body weight of the animal in gram.
For comparing the effect of the different AC methods on tumor quantification, individual tumor values are derived either from one animal with one or multiple tumors or from animals, which were scanned multiple times.
Statistics
All values are given as mean values (± standard deviation). The obtained AC-corrected values were compared to No-AC corrected values using a paired t-test in GraphPad Prism 8.3.0.; p < 0.05 was considered statistically significant.
Results
As not all emission sinograms were available at the time of analysis, the emission sinograms used for all AC techniques (phantom and rats, No-AC, EM-AC, and TX-AC) were generated from the original images by applying inverse Fourier rebinning. In order to validate this approach images reconstructed from the generated sinograms were compared to images reconstructed from the original sinograms (phantom and rat SaS). Quantitative analysis of phantom images based on the generated or original sinograms were in good agreement (SUVmean <1%). In rats, similar differences of liver and brain activity (SUVmean <1%) between images based on the generated or original sinogram were observed. In contrast, maximum activity concentration (SUVmax) were significantly lower using the inverse Fourier rebinning approach compared to the original sinograms on both, phantom and rat images.
The recovery coefficients (RC) calculated from the set of reconstructed images, applying No-AC, TX-AC or EM-AC of the cylindrical phantom filled with [18F]FDG solution scanned with the SaS method and CBM are summarized in Table 1. Moreover, phantom images acquired using the SaS and the CBM method and reconstructed using No-AC, EM-AC, and TX-AC (only SaS method) are shown in Figures 1B,C. As shown in the phantom images, axial image uniformity is superior in the phantom images acquired using CBM as compared to phantom images acquired using SaS. In the later, the overlapping bed position are clearly visible in the images. Applying no attenuation correction during image reconstruction leads to an underestimation of mean radioactivity concentrations in the investigated VOI of 50 or 37% in CBM and SaS acquired emission scans, independent from the applied image reconstruction algorithm (FBP or OSEM). Implementing transmission-based attenuation correction (TX-AC) to the identical images acquired in SaS mode increased the quantification accuracy as assessed by the RC value to 1.02 ± 0.08 and 1.07 ± 0.01 for FBP and OSEM reconstructed images, respectively. Emission-based AC showed comparable improvements in quantification accuracy in SAS acquired images (RC of 1.15 ± 0.07 and 1.15 ± 0.07) for FBP and OSEM. In phantom images acquired with CBM, EM-AC increased the quantification accuracy in FBP (RC of 0.79 ± 0.02) and OSEM (RC of 0.80 ± 0.02) reconstructed images compared to No-AC images.
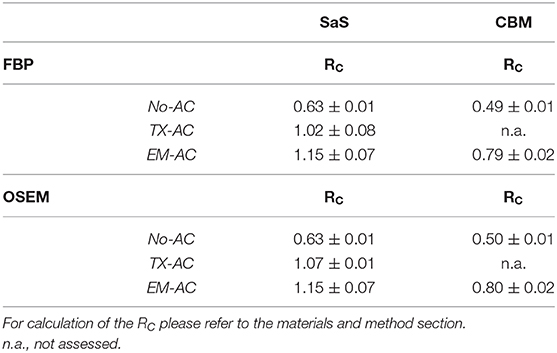
Table 1. Recovery coefficients (RC) for mean radioactivity concentrations of the phantom studies which were acquired either with the SaS method or continuous bed motion (CBM) and the images reconstructed using different method of attenuation correction (AC).
The results from the retrospective analysis using No-AC, EM-AC, or TX-AC for quantification of brain and liver [18F]FDG uptake in rat images acquired with the SaS method (n=9) are shown in Figures 2A,B. Rat FDG images are shown in Figure 2C. Mean brain uptake (SUVmean) was increased by 40% (p < 0.0001) and 18% (p < 0.0001) when applying the TX-AC and EM-AC method, respectively, compared to No-AC (Figure 2A). In the liver VOI the effect of AC was even more pronounced with increases of 60% (p < 0.0001) and 32% (p = 0.008) in mean liver uptake (SUVmean) values after TX-AC and EM-AC, respectively (Figure 2B). Overall in both analyzed VOIs, [18F]FDG uptake values (SUVmean) were significantly lower in the EM-AC images as compared to the TX-AC images.
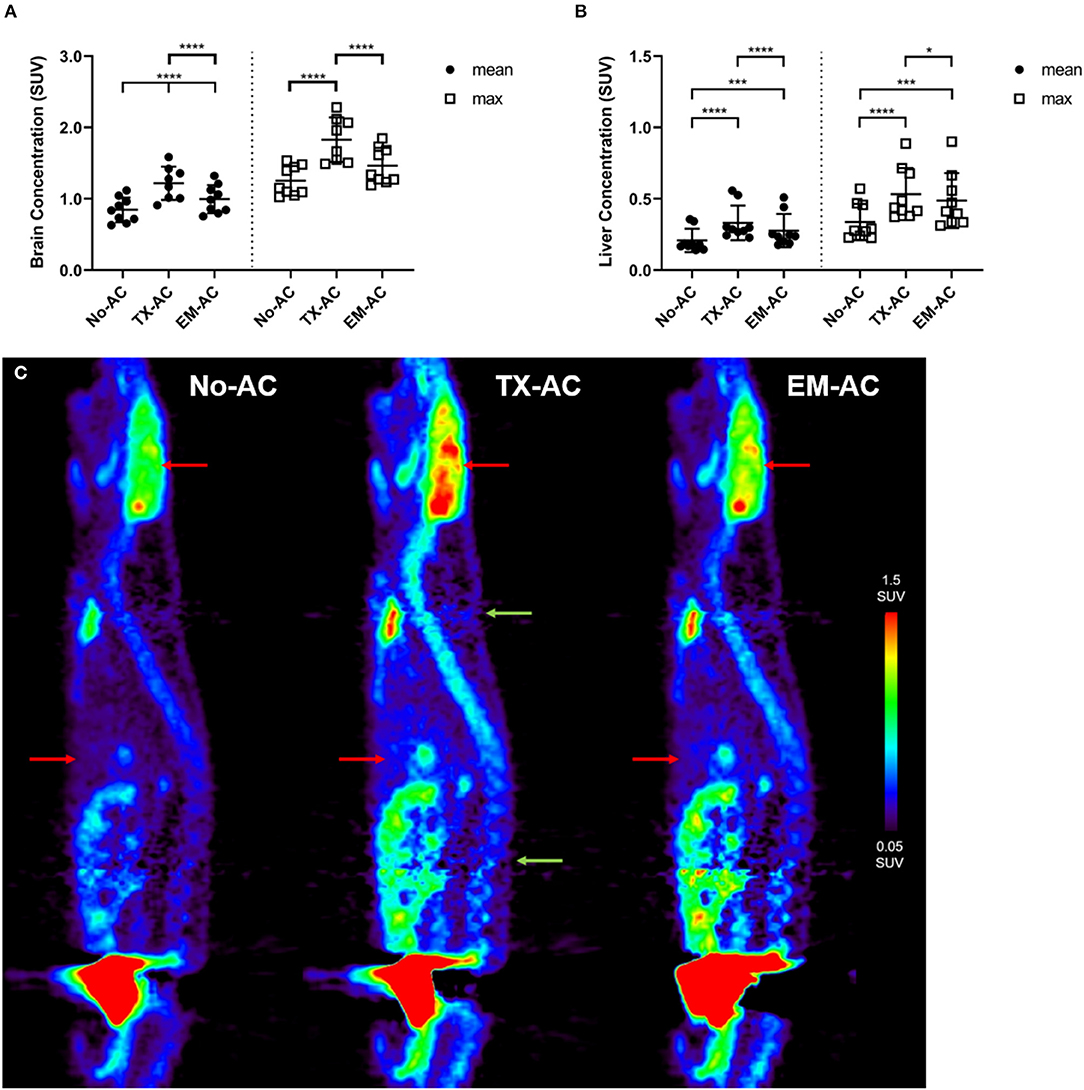
Figure 2. (A) Brain and (B) liver mean (filled circle) and max (open square) [18F]FDG activity concentration values (SUV) obtained in rats (n = 9). Images were recorded using the SaS method and reconstructed with FBP without (No-AC), with transmission-based (TX-AC) and with emission-based (EM-AC) attenuation correction (*p < 0.05, ***p < 0.001, ****p < 0.0001). (C) Sagittal rat FDG-PET images acquired using the SaS method and reconstructed with FBP. Brain and liver are indicated with red arrows and overlapping bed positions are indicated with green arrows.
Whole-body rat images acquired using the CBM method are shown in Figure 3B. The obtained uptake values in tumors, calculated from whole-body rat images acquired using CBM and reconstructed using either No-AC or EM-AC are shown in Figure 3A. In parallel to the phantom study, EM-AC generally increased the mean uptake values irrespective of the image reconstruction algorithm used. For example, [18F]FDG SUVmean tumor uptake values in FBP reconstructed images were increased by 33 ± 10% (p = 0.0034) in the DMBA group (n = 14) and by 36 ± 8% (p = 0.001) in the MNU group (n = 6) after EM-AC. When performing OSEM reconstruction, EM-AC led to an increase in SUVmean tumor uptake values by 68% (p < 0.0001) and 78% (p = 0.001) in the DMBA and MNU group, respectively. Interestingly, EM-AC had an effect in the same order of magnitude on the SUVmax tumor values (~38% increase) when using FBP reconstruction, whereas in the OSEM reconstructed images, SUVmax tumor values exhibited an increase of ~100% after applying EM-AC.
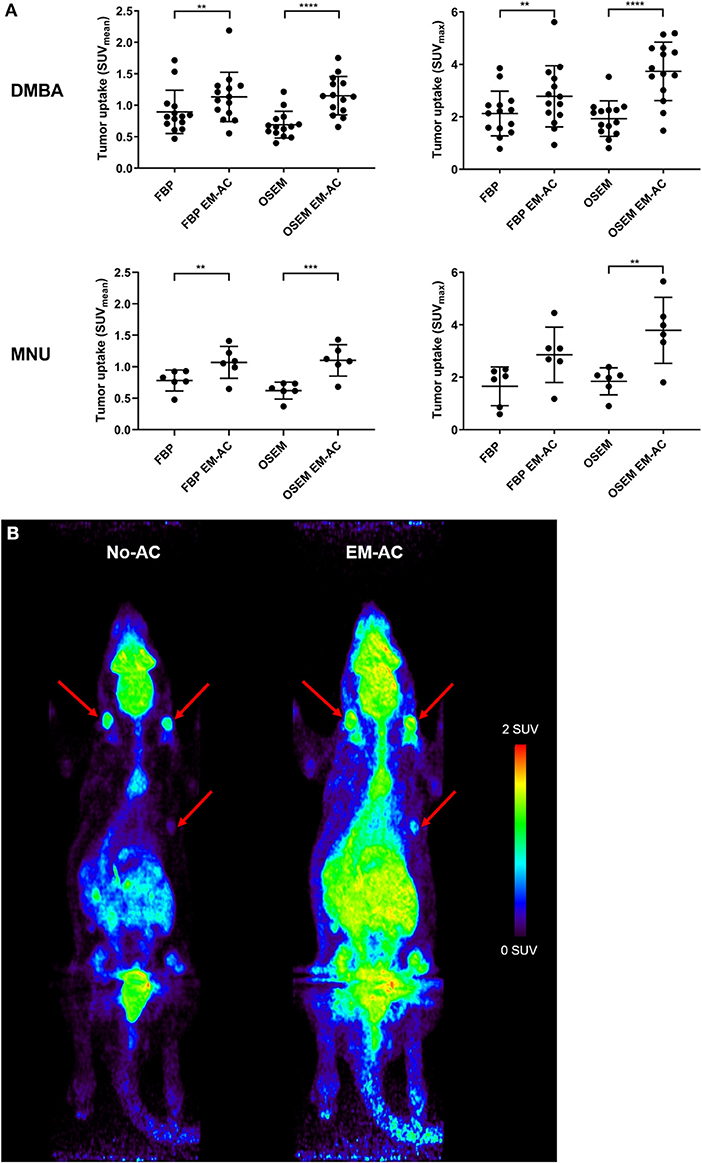
Figure 3. (A) Quantification in tumors (SUVmean and SUVmax) induced by DMBA (n = 14) or MNU (n = 6) in rat whole body images acquired with continuous bed motion (CBM). Images were reconstructed using FBP or OSEM without attenuation correction and with emission-based attenuation correction (EM-AC) (**p < 0.01, ***p < 0.001, ****p < 0.0001). (B) Maximum intensity projection of a whole-body PET image showing [18F]FDG distribution in a tumor bearing rat (MNU) acquired with CBM without AC (left side) and with EM-AC (right side). Tumors are indicated with red arrows. Images were reconstructed with OSEM.
Discussion
In contrast to human PET studies, where the CBM acquisition method was just recently introduced and is now used for diagnostic [18F]FDG-PET [9, 23], this method is rarely applied in preclinical whole-body imaging. The main reason for this is that in preclinical imaging either the transaxial FOV of the preclinical PET scanner is large enough for a whole-body scan of the scanned subject (e.g., mouse), the exact imaging region is known to the examiner (e.g., in subcutaneous tumor studies) or the quantitative properties of PET imaging are prioritized over data on whole-body distribution, which might be the case in imaging of larger animals such as rats or rabbits. However, CBM offers the opportunity to increase image throughput, as the total measurement time required for a CBM acquisition is significantly lower than the cumulative effort for emission and transmission acquisitions at multiple bed positions. Compared to SaS, imaging time in CBM could be reduced by a factor of two, therefore doubling the putative imaging output per day which consequently effects the study statistics and allows for higher group numbers—factors that are of high importance in oncology studies. Additionally, the anesthesia duration for the scanned subjects can be shortened in CBM, which decreases the overall burden for the laboratory animals under investigation, again an important factor in oncology studies where repeated measurements over study days (e.g., therapy monitoring studies) are required. Moreover, it has been reported and demonstrated in the phantom study that CBM offers the advantage of a more uniform sensitivity over the entire image and therefore results in a better image quality when compared to SaS-acquired images.
In this study we investigated alternative approaches for AC to achieve accurate estimates of radiotracer concentration in different regions of interest in images acquired with CBM. Initially, phantom studies using a rat-sized hollow cylinder filled with a known activity concentration of [18F]FDG in aqueous solution were performed. PET emission images were recorded using both acquisition methods, SaS and CBM, and corresponding transmission scans were performed for the SaS images. Furthermore, the originally FBP-reconstructed images were segmented, and attenuation coefficients were manually assigned to the corresponding parts of the image which was subsequently inverse Fourier rebinned into an emission-based attenuation sinogram. This EM-AC sinogram was then used for AC in the reconstruction of the phantom images using FBP and OSEM algorithm.
During data search for “real” rat imaging data to compare phantom data with, it was recognized that not all original raw data were still available for retrospective analysis. Therefore, the possibility to generate emission sinograms out of the original image files by inverse Fourier rebinning was investigated, initially in the phantom dataset, as well as subsequently in the rat images. Comparison of the quantification result of the inverse Fourier rebinned sinograms (and further reconstructed images) with the original image files showed an excellent agreement. Consequently, the generation of the emission sinograms out of the image files can be a feasible approach if the original listmode or sinogram raw data is missing and images need to be reconstructed with a different reconstruction algorithm or parameters.
Quantitative evaluation of the phantom data and comparison of the derived concentration values to the expected values revealed the influence of the acquisition mode (SAS vs. CBM) and attenuation correction on those data. Applying no attenuation correction to the phantom data showed a reduction in quantitative accuracy by −37% in SaS acquired images reconstructed using FBP or OSEM. These values are quite in line with literature data where it was reported that the accuracy of the activity concentration is reduced by −38% in the uncorrected vs. the attenuation corrected image [24]. Moreover, a simulation study using the Moby phantom with increasing diameters from 2.1 cm to 6.4 cm also showed a 30–40% error in soft tissue quantification starting from 4.7 cm diameter, which is roughly the diameter of a rat [25]. The reduction was even more pronounced in the phantom CBM data, were a decrease of −50% in quantitation accuracy was observed. Applying TX-AC to SaS acquired data increased quantification accuracy to acceptable levels of <10% for all reconstruction algorithms. Interestingly, EM-AC overestimated the activity concentration by 15% in SaS acquired images. However, the such derived values are well within the tolerance range for PET measurements keeping in mind that especially FDG-PET scans in rodents are heavily influenced by animal handling of up to a factor of 2 as shown in a recent study [21]. In CBM data, EM-AC greatly improved image quantitation for both reconstruction algorithms, even though these values are still below the expected concentrations or compared to TX-AC data.
As a next step, the effect of transmission-based (TX-AC) vs. emission-based (EM-AC) attenuation correction in SaS acquisitions of whole-body rat PET images were assessed. In brain and liver VOIs the activity concentration without AC and with TX-AC reflected the results of the phantom studies as such, that mean brain and liver [18F]FDG uptake values were increased by 40 and 60%, respectively, after applying TX-AC. Application of EM-AC to the same data increased the SUVmean in brain and liver by 18 and 32%, respectively. This is in contrast to the phantom study were both AC methods achieved a comparable result in terms of quantification accuracy. A possible explanation for this observation might be an incorrect segmentation. As the skull itself was not visible in the FDG rat images, it was not feasible to include bone material into the segmented images and thus leading to an underestimation of brain FDG uptake. A previous study suggests a careful evaluation of EM-AC in applications where a uniform structure cannot be assumed [26].
When using CBM for tumor-bearing rats this study found that the [18F]FDG uptake after EM-AC was increased with respect to uncorrected images by 34% in the tumors VOI's. Similar results were also obtained by other groups in subcutaneous tumor mouse models [27], where they reported an attenuation recovery of ~13% in tumors. This value is slightly lower as the results from this study, but as mice were used in contrast to rats, a lower attenuation recovery might be expected. D'Ambrosio et al. [28] compared two attenuation correction methods based on CT and segmentation of emission images in phantom, mice and rat images. In line with this study, it was reported that EM-AC leads to lower uptake values (lower ROI counts) as compared to TX-AC. For example, differences between the EM-AC and CT-AC method of <9% for the myocardium and left ventricle VOI in rats were reported. This difference is much lower as the difference found in the liver and brain VOI in this study (~17%). However, this might be due to the different position of the VOI inside the body and the attenuation effect of the surrounding tissue.
However, even with this underestimation in [18F]FDG organ and tumor uptake, EM-AC did improve tumor identification and tumor delineation in CBM acquired images. Especially small tumors with lower [18F]FDG uptake can be easily overlooked without AC (see Figure 3B). This is of special relevance in chemically induced tumor models, where tumors can develop spontaneously, and the exact tumor locations are unknown. More importantly, the EM-AC method could be an important alternative in preclinical PET/MR scanners where no attenuation correction is available.
Conclusion
Attenuation correction had a strong influence on the quantification accuracy of PET images. The present study revealed, that EM-AC can improve quantitative accuracy in PET scans acquired with continuous bed motion. Moreover, tumor identification and tumor delineation in the final images especially for small tumors could be improved by EM-AC in CBM and SaS acquired images even if the obtained values were still underestimated as compared to TX-AC reconstructed images.
Data Availability Statement
The datasets generated for this study are available on request to the corresponding author.
Ethics Statement
All applicable institutional and/or national guidelines for the care and use of laboratory animals were followed and the study was reviewed and approved by the responsible national authorities (Amt der Niederösterreichischen Landesregierung).
Author Contributions
TW initiated and designed the study, coordinated, and participated in the experiments. LS performed data reconstructions and image data analysis. TF was responsible for preparing the animal model. SM and MS performed the microPET measurements. TW, MB, and CK summarized the data and drafted the manuscript. All authors read and approved the final manuscript.
Funding
We acknowledge funding support from the Austrian Research Promotion Agency (FFG) (FEMtech studentship for LS).
Conflict of Interest
The authors declare that the research was conducted in the absence of any commercial or financial relationships that could be construed as a potential conflict of interest.
Acknowledgments
The authors wish to thank Maria Zsebedics for help in conducting the PET experiments and the radiochemistry staff (Seibersdorf Labor GmbH) for their continuous support.
References
1. Dahlbom M, Hoffman EJ, Hoh CK, Schiepers C, Rosenqvist G, Hawkins RA, et al. Whole-body positron emission tomography: Part I. Methods and performance characteristics. J Nucl Med. (1992) 33:1191–9.
2. Lehnert W, Meikle SR, Siegel S, Newport D, Banati RB, Rosenfeld AB. Evaluation of transmission methodology and attenuation correction for the microPET Focus 220 animal scanner. Phys Med Biol. (2006) 51:4003–16. doi: 10.1088/0031-9155/51/16/008
3. Siman W, Kappadath SC. Comparison of step-and-shoot and continuous-bed-motion PET modes of acquisition for limited-view organ scans. J Nucl Med Technol. (2017) 45:290–6. doi: 10.2967/jnmt.117.195438
4. Del Guerra A, Belcari N. Dual-modality preclinical SPECT/PET instrumentation. In: Zaidi H, editor. Molecular Imaging of Small Animals: Instrumentation and Applications. New York, NY: Springer (2014). p. 337–50. doi: 10.1007/978-1-4939-0894-3_11
5. Marik J, Tartis MS, Zhang H, Fung JY, Kheirolomoom A, Sutcliffe JL, et al. Long-circulating liposomes radiolabeled with [(18)F]fluorodipalmitin ([(18)F]FDP). Nucl Med Biol. (2007) 34:165–71. doi: 10.1016/j.nucmedbio.2006.12.004
6. Ceccarini G, Flavell RR, Butelman ER, Synan M, Willnow TE, Bar-Dagan M, et al. PET imaging of leptin biodistribution and metabolism in rodents and primates. Cell Metab. (2009) 10:148–59. doi: 10.1016/j.cmet.2009.07.001
7. Osborne DR, Acuff S, Cruise S, Syed M, Neveu M, Stuckey A, et al. Quantitative and qualitative comparison of continuous bed motion and traditional step and shoot PET/CT. Am J Nuclear Med Mol Imaging. (2015) 5:56–64.
8. Acuff SN, Osborne D. Clinical workflow considerations for implementation of continuous-bed-motion PET/CT. J Nucl Med Technol. (2016) 44:55–8. doi: 10.2967/jnmt.116.172171
9. Yamashita S, Yamamoto H, Nakaichi T, Yoneyama T, Yokoyama K. Comparison of image quality between step-and-shoot and continuous bed motion techniques in whole-body (18)F-fluorodeoxyglucose positron emission tomography with the same acquisition duration. Ann Nucl Med. (2017) 31:686–95. doi: 10.1007/s12149-017-1200-5
10. Lu YH, Fontaine K, Gallezot JD, Mulnix T, Panin V, Jones J, et al. Whole-body continuous-bed-motion PET list-mode reconstruction with non-rigid event-by-event respiratory motion correction. J Nucl Med. (2019) 60:105.
11. Berker Y, Li Y. Attenuation correction in emission tomography using the emission data–A review. Med Phys. (2016) 43:807–32. doi: 10.1118/1.4938264
12. Zaidi H, Hasegawa B. Determination of the attenuation map in emission tomography. J Nucl Med. (2003) 44:291–315.
13. Tai YC, Ruangma A, Rowland D, Siegel S, Newport DF, Chow PL, et al. Performance evaluation of the microPET focus: a third-generation microPET scanner dedicated to animal imaging. J Nucl Med. (2005) 46:455–63.
14. Hamacher K, Coenen HH, Stocklin G. Efficient stereospecific synthesis of no-carrier-added 2-[18F]-fluoro-2-deoxy-D-glucose using aminopolyether supported nucleophilic substitution. J Nucl Med. (1986) 27:235–8.
15. Tsubura A, Lai YC, Miki H, Sasaki T, Uehara N, Yuri T, et al. Animal models of N-Methyl-N-nitrosourea-induced mammary cancer and retinal degeneration with special emphasis on therapeutic trials. In vivo. (2011) 25:11–22. Available online at: http://iv.iiarjournals.org/content/25/1/11.abstract
16. Saminathan M, Rai RB, Dhama K, Ranganath GJ, Murugesan V, Kannan K, et al. Histopathology and immunohistochemical expression of N-Methyl-N-Nitrosourea (NMU) induced mammary tumours inague-dawley rats. Asian J Anim Vet Adv. (2014) 9:621–40. doi: 10.3923/ajava.2014.621.640
17. Dias M, Cabrita S, Sousa E, Franca B, Patricio J, Oliveira C. Benign and malignant mammary tumors induced by DMBA in female wistar rats. Eur J Gynaecol Oncol. (1999) 20:285–8.
18. Barros AC, Muranaka EN, Mori LJ, Pelizon CH, Iriya K, Giocondo G, et al. Induction of experimental mammary carcinogenesis in rats with 7,12-dimethylbenz(a)anthracene. Revista do Hospital das Clinicas. (2004) 59:257–61. doi: 10.1590/S0041-87812004000500006
19. Fueger BJ, Czernin J, Hildebrandt I, Tran C, Halpern BS, Stout D, et al. Impact of animal handling on the results of 18F-FDG PET studies in mice. J Nucl Med. (2006) 47:999–1006.
20. Wong KP, Sha W, Zhang X, Huang SC. Effects of administration route, dietary condition, and blood glucose level on kinetics and uptake of 18F-FDG in mice. J Nucl Med. (2011) 52:800–7. doi: 10.2967/jnumed.110.085092
21. Mannheim JG, Mamach M, Reder S, Traxl A, Mucha N, Disselhorst JA, et al. Reproducibility and comparability of preclinical PET imaging data: a multicenter small-animal PET study. J Nucl Med. (2019) 60:1483–91. doi: 10.2967/jnumed.118.221994
22. Loening AM, Gambhir SS. AMIDE: a free software tool for multimodality medical image analysis. Mol Imaging. (2003) 2:131–7. doi: 10.1162/153535003322556877
23. van der Vos CS, Koopman D, Rijnsdorp S, Arends AJ, Boellaard R, van Dalen JA, et al. Quantification, improvement, and harmonization of small lesion detection with state-of-the-art PET. Eur J Nucl Med Mol Imaging. (2017) 44(Suppl. 1):4–16. doi: 10.1007/s00259-017-3727-z
24. Chow PL, Rannou FR, Chatziioannou AF. Attenuation correction for small animal PET tomographs. Phys Med Biol. (2005) 50:1837–50. doi: 10.1088/0031-9155/50/8/014
25. Konik A, Koesters T, Madsen MT, Sunderland JJ. Evaluation of attenuation and scatter correction requirements as a function of object size in small animal PET imaging. IEEE Trans Nucl Sci. (2011) 58:2308–14. doi: 10.1109/TNS.2011.2160998
26. Maeda Y, Kudomi N, Sasakawa Y, Monden T, Kato K, Yamamoto Y, et al. Applicability of emission-based attenuation map for rapid CBF, OEF, and CMRO2 measurements using gaseous (15)O-labeled compounds. EJNMMI Phys. (2015) 2:12. doi: 10.1186/s40658-015-0115-2
27. El Ali HH, Bodholdt RP, Jorgensen JT, Myschetzky R, Kjaer A. Importance of attenuation correction (AC) for small animal PET imaging. Diagnostics. (2012) 2:42–51. doi: 10.3390/diagnostics2040042
Keywords: positron emission tomography, attenuation correction, quantification, FDG, emission-based attenuation
Citation: Wanek T, Schöllbauer L, Filip T, Mairinger S, Sauberer M, Blaickner M and Kuntner C (2020) Impact of Attenuation Correction on Quantification Accuracy in Preclinical Whole-Body PET Images. Front. Phys. 8:123. doi: 10.3389/fphy.2020.00123
Received: 13 December 2019; Accepted: 30 March 2020;
Published: 24 April 2020.
Edited by:
Kris Thielemans, University College London, United KingdomReviewed by:
Daniele Panetta, Italian National Research Council, ItalyFrancesca Leek, University College London, United Kingdom
Copyright © 2020 Wanek, Schöllbauer, Filip, Mairinger, Sauberer, Blaickner and Kuntner. This is an open-access article distributed under the terms of the Creative Commons Attribution License (CC BY). The use, distribution or reproduction in other forums is permitted, provided the original author(s) and the copyright owner(s) are credited and that the original publication in this journal is cited, in accordance with accepted academic practice. No use, distribution or reproduction is permitted which does not comply with these terms.
*Correspondence: Claudia Kuntner, Y2xhdWRpYS5rdW50bmVyQGFpdC5hYy5hdA==