- 1Faculty of Mathematics and Physics, University of Ljubljana, Ljubljana, Slovenia
- 2Department of Low and Medium Energy Physics, Jožef Stefan Institute, Ljubljana, Slovenia
- 3Institut für Kernphysik, Johannes-Gutenberg-Universität, Mainz, Germany
- 4Thomas Jefferson National Accelerator Facility, Newport News, VA, United States
In 1963, a proton radius of 0.805(11) fm was extracted from electron scattering data and this classic value has been used in the standard dipole parameterization of the form factor. In trying to reproduce this classic result, we discovered that there was a sign error in the original analysis and that the authors should have found a value of 0.851(19) fm. We additionally made use of modern computing power to find a robust function for extracting the radius using this 1963 data's spacing and uncertainty. This optimal function, the Padé (0, 1) approximant, also gives a result which is consistent with the modern high precision proton radius extractions.
1. Introduction
The proton charge radius, rE, is the conventional measure for the size of the proton, a fundamental constituent of matter. This constant is defined as the derivative of the proton charge form factor, GpE, at zero four-momentum transfer, Q2 = 0:
and can be determined by both hydrogen spectroscopy and elastic lepton scattering [1]. The first determination of the radius was done with elastic electron scattering data by Hand et al. [2], who determined the radius of 0.805(11) fm, the value used in the standard dipole parameterization of the form factor [3, 4]. The original study was followed by several decades of dedicated nuclear scattering and spectroscopic experiments, which led to a recommended value for the proton charge radius of 0.8791(79) fm (CODATA 2010, [5]). This result was called into question when the extremely precise spectroscopic measurements on muonic hydrogen [6, 7] reported a significantly smaller value of 0.84087(39) fm. The observed discrepancy, colloquially known as “the proton radius puzzle” [8] motivated several new experiments [9–12]. These experiments have been accompanied by different reanalyses of the existing data [13–20], focusing on data of Bernauer et al. [21, 22]. In this paper we follow a different path and revisit the first data of Hand et al., and evaluate their result by using modern analysis techniques.
2. The Classical Approach
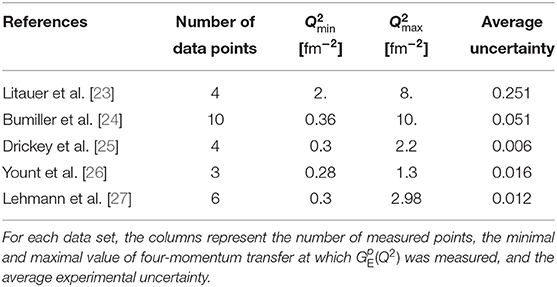
In the first determination of the radius, existing data on proton charge form factor from five different measurements were considered [23–27], as noted in Table 1.
In an attempt to reconstruct the radius of 0.81 fm we followed the original analysis approach and compared the data to the quadratic function in Q2:
This model depends on two free parameters: the radius, rE, in front of the linear term, and the parameter a that determines the curvature of the function. Since the data are normalized, the constant term of the model is simply 1. In the first step the two parameters were determined by fitting Equation (2) to the data with Q2 ≤ 3 fm−2, considering the entire region with the high density of experimental points. The obtained results were rE = 0.819(21) fm and a = 0.00787(309) fm4. However, the radius obtained in this manner should not be trusted since the true shape of the GpE(Q2) may be more complex than a second order polynomial. At Q2 ≈ 3 fm−2 the contributions of the Q6 and Q8 terms are not negligible and their omission from the fit causes a systematic shift in the determined radius.
To avoid model dependent bias in the radius extraction, the contributions of higher order terms should be kept minimal. The way Hand achieved this with a model, such as Equation (2), is by keeping the parameter a at a value determined in their first step and then only fitting the radius, using data with Q2 ≤ 1.05 fm−2. Assuming that the determined value for a is a good estimate for the size of the Q4 term, this preserves the curvature of the model. Additionally, we were able to determine that at 1 fm−2 the Q4 term contributes less than a percent to the value of GpE. Hence, even a 10% error in the value of a would result in a modification of the form-factor much smaller than the statistical uncertainty of each measurement. Hence, the described two step fitting technique should result in a more reliable estimate of the proton charge radius. We determined it to be rE = 0.851(19) fm, which is inconsistent with the original result (see Figure 1). The obtained value is 5% larger than the original radius while its uncertainty is almost twice as large as the uncertainty of the first result.
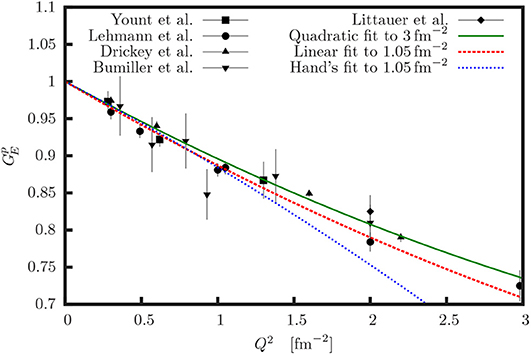
Figure 1. The experimental data [23–27] considered in the analysis. The solid green line shows model (2) when both rE and a are fitted to the data with Q2 ≤ 3 fm−2. The dashed red line shows the results when rE is fitted to the data with Q2 ≤ 1.05 fm−2, while the parameter a = 0.00787 fm4 is kept constant. The blue dotted line corresponds to the original result of Hand et al. [2] assuming a = −0.00787 fm4.
To find the source of the discrepancy the last step of the analysis was repeated with different values of a. Since rE and a are strongly correlated, it is important to evaluate the effect of a on rE. Additionally, the original paper does not report the value of a. The analysis demonstrated in Figure 2 shows that the radius depends almost linearly on a and reveals that the original value of rE can be reproduced if a, determined in the first step of our analysis, is used, but with the opposite (wrong) sign.
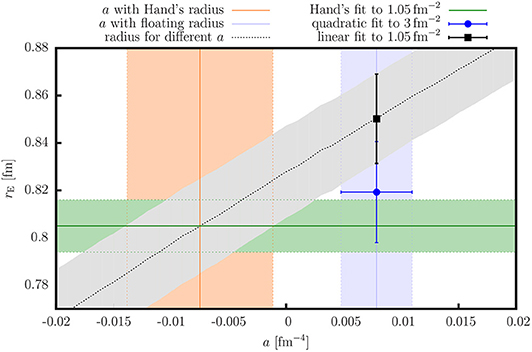
Figure 2. The relation between parameters rE and a that determine the model (2). The green band denotes the original result of Hand et al. [2]. The blue point represents the result of the analysis when both parameters are free and the model is fitted to the data with Q2 < 3.00 fm−2. The vertical blue band indicates the value of the parameter a. The black point shows the final radius obtained by using the original two step approach of Hand et al. The gray line with the corresponding uncertainty shows how the extracted radius changes when a is modified from −0.02 to 0.02. The orange vertical band represents the result of the fit when only a is being fitted, while the radius is kept fixed at 0.805(11) fm. The cross-section of green, orange, and gray bands defines the area of possible values of a considered in the original analysis of Hand et al. [2]. The obtained result supports the hypothesis that a mistake has been made in the original analysis and that a was considered with the wrong sign.
To confirm this hypothesis, we again fitted model (2) to the data with Q2 < 1.05 fm−2, but this time kept the radius fixed at 0.805(11) fm and adjusted only a. We obtained a = −0.00749(63) fm4, which strongly supports our assumption that a mistake was made in the original analysis. Additionally, our analysis has also revealed that the original study failed to acknowledge the uncertainty of a in the determination of rE. Their analysis considered only statistical uncertainty and thus underestimated the final uncertainty of the radius.
To test the stability of the extracted radius, we have repeated the analysis by using all combinations of four of the five data sets. The results presented in Figure 3 demonstrate the tension between the two most precise data sets, Drickey et al. [25] and Lehmann et al. [27]. The data of Lehmann et al. prefer a larger value of the proton charge radius and dominate the result when considering the data with small Q2. The data of Drickey et al., on the other hand, favor a smaller proton charge radius and control the result at Q2 > 1.4 fm−2. While the discrepancy is too small to exclude a statistical fluctuation in the data, the most probable source of the tension are unaccounted for systematic effects, e.g., offsets in the absolute normalization of the reported data. The tension between the data is reduced if the normalizations of the data sets are kept as free parameters, as is being done in modern analyses of form factor measurements [15, 22, 28], but does not disappear completely. Furthermore, introduction of additional five free parameters to the fits (normalizations) increases the variance of the extracted result and dilutes the significance of the extracted radius, which in the given case equals to 0.865(48) fm (see Figure 3).
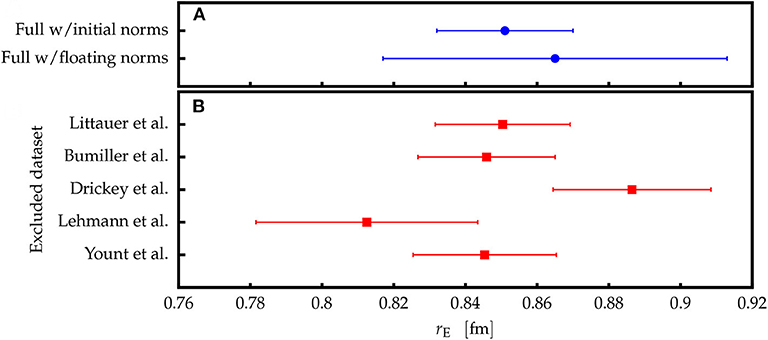
Figure 3. The extracted values of the proton charge radius. (A) The difference between the value obtained with the fixed and floating normalization parameters. Addition of five free parameters significantly increases the uncertainty of the radius. (B) Calculated radii when performing the analysis with only four out of five data sets, demonstrating a tension between the data sets of Drickey et al. [25] and Lehmann et al. [27].
3. Robust Analysis
The key problem of radius calculation is our ignorance of the true functional form of the proton charge form factor. Consequently, the form factor is approximated by various parameterizations. So far we considered function (2). Although the model was applied carefully to the data, it is not clear whether the quadratic function is an acceptable model for its description. The choice of a model can impact the result and can lead to a biased radius, i.e., a value that is systematically different from the true value. The bias is associated with the nature of the function and is typically smaller for functions with more free parameters. However, models with many parameters are justifiable only when data sets with large kinematic range and sufficient precision are available. Otherwise the variance of the radius increases to the level that the obtained result has no practical value. Hence, a model needs to be selected that exhibits a minimal bias of the extracted radius while keeping the variance of the result reasonably small. To achieve this, we have complemented the original analysis with a different technique based on a Monte-Carlo study of different form factor models, and are able to offer a more reliable determination of the radius.
Since the majority of the available data were measured only at small Q2 and with limited precision, we investigated only models that depend on up to three parameters in order to keep the uncertainty of the extracted radius below the difference between the two competing values of the proton radius problem. Beside model (2), we considered:
where n1, n2, n3, m1, m2, and m4 represent adjustable parameters of the models. Using these parameters the rE for each model can be calculated using Equation (1). The quadratic (Equation 2) and cubic functions (Equation 3) were considered as well as four rational functions. They are interesting because, like the dipole model, they introduce higher order terms and define the curvature of the form factor at higher Q2, although they depend on relatively few parameters. For completeness, we considered also the dipole model, which is known to report biased results [29], but can serve as a test of our approach.
The evaluation of the chosen models and tests of their capacity to reliably extract the radius can not be performed on the real data. Therefore, we developed a Monte-Carlo simulation which generated many sets of pseudo data on a desirable kinematic interval using specific form factor models with known corresponding radii. These pseudo data were used to establish statistically relevant estimates on the size of the bias and variance of the extracted radius. The goal was to find a model that would (for a chosen kinematic range) return a radius with uncertainty smaller than σrE ≤ σ0 = 0.02 fm and with the bias below ΔrE ≤ 1/(2σ0). Therefore, we have defined the estimator
which combines both conditions and could be used to quantify the quality of the selected model and search for the model with RMSE≤√2. The six models were tested by using the parameterization of Bernauer et al. [22] determined from real data, the fifth-order continued-fraction model of Arrington and Sick [30], and the theoretical prediction of Alarcon et al. [20]. For each parameterization the pseudo data were generated and studied on the interval [0,Q2max]. The results of the analysis are gathered in Table 2 and presented in Figure 4.
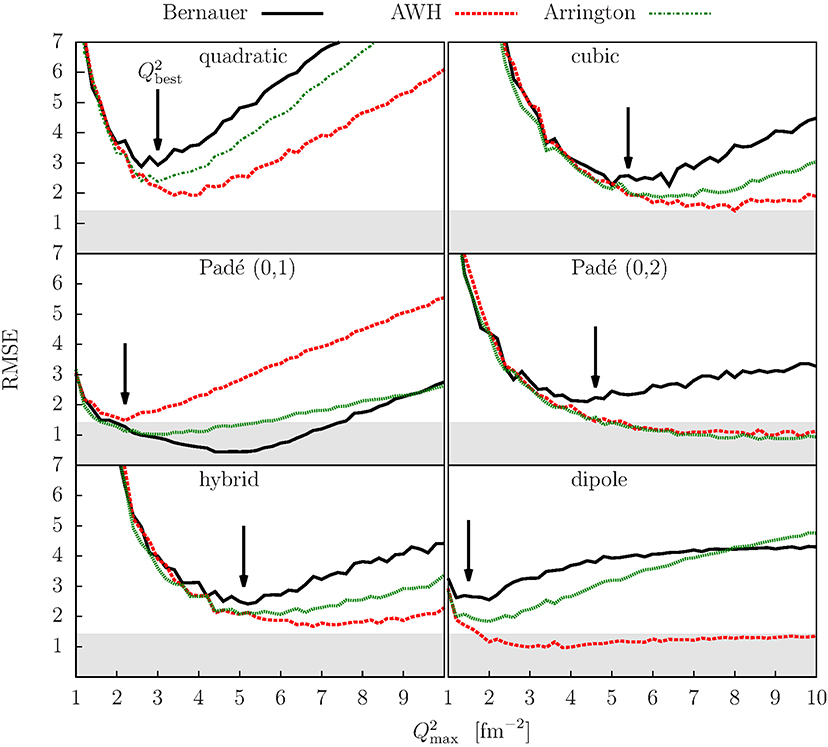
Figure 4. Results of the Monte-Carlo study of the form-factor models (2)–(7). RMSE as a function of Q2max, obtained with realistic form factor parameterizations is used to evaluate the behavior of each model. According to our selection criterion a model is appropriate for the analysis if the minima of all the curves on a given plot lie below the threshold of ≈√2. The selection threshold is marked on the plots with gray bands. The black arrows on each plot denote the positions of the highest minimum which determines the interval [0,Q2best] of the data that should be considered in the fit.
At small momentum transfers, the value of RMSE(Q2max) is governed by the variance, which decreases with the increasing number of data points considered in the fit. For large Q2max, the model is no longer capable of satisfactorily describing the data. Consequently, the extracted radius becomes biased and the RMSE(Q2max) again starts to increase. The position of the minimum determines the ideal momentum transfer range over which a given model gives the most reliable radius for a chosen form factor parameterization. Unfortunately, since we do not know the true functional form of the charge form factor, one cannot simply select a minimum from a single specific parameterization. Thus, we try to be conservative and choose the minimum with the highest RMSE value, Q2best, assuming that the form-factor parameterizations considered in the analysis form a representative set of functions and that the true form factor may be somewhere in-between.
Once the Q2best for each of the models was estimated, the data could be fitted on the interval [0,Q2best] and the proton charge radius could be determined. The results of the fits to the real data are shown in Tables 2, 3 and in Figure 5. However, the Monte-Carlo analysis demonstrates that only model (4) satisfies the condition for the RMSE=1.54≈√2. All other models have RMSE values >2, which means that the radius results will not meet our criterion regarding the bias and variance. While quadratic and dipole functions are expected to have a large bias and should therefore be excluded, the remaining functions could still be considered, because their RMSE values are dominated by the large variance, but the calculated radii are expected to have large uncertainties. Hence, our best estimate for the radius is obtained with the Padé (0, 1) approximant, yielding the radius of 0.841(9) fm.
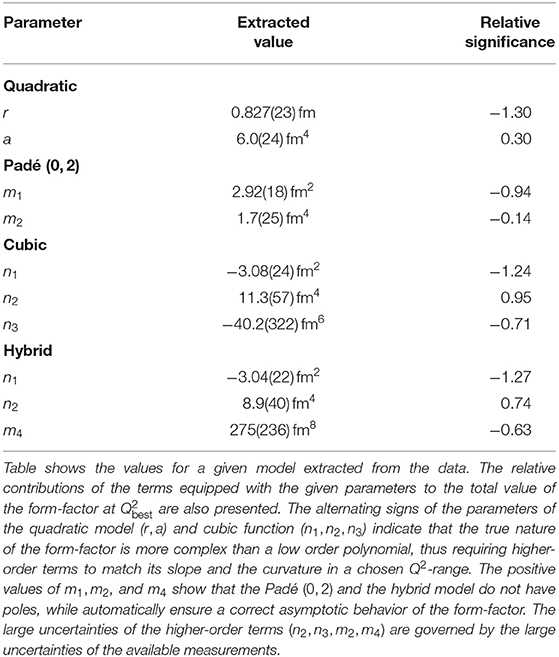
Table 3. The parameters for the form-factor models (2), (4), (6), and (7), which have more than one free parameter.
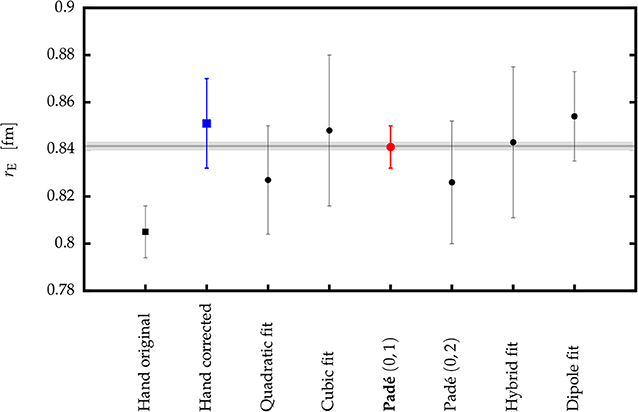
Figure 5. The comparison of the extracted proton charge radii. The square points show the value calculated with the classical approach described in section 2 and the original result of Hand et al. [2]. The circles represent the model-dependent extractions of the radius obtained with the new analysis technique presented in section 3. The error bars show corresponding standard errors. According to the Monte-Carlo simulation the most robust estimate for the radius can be obtained using model (4), shown with the red circle. The gray band represents the new recommended value (CODATA 2018, [31]).
4. Conclusions
In this paper we reanalyzed the proton charge form factor data from classical experiments performed in the 1960s by utilizing modern analysis tools that were not available at the time of the original analysis. Repeating the steps of Hand et al., we determined the radius to be 0.851(19) fm, a value which is 5% larger than the result of the original paper. Using Monte-Carlo simulation we determined that the observed discrepancy is most probably related to a mistake in the interpretation of the Q4-term when fitting the radius. To evaluate and minimize the dependence of the radius on the model applied in the analysis, the classical approach was superseded by a Monte Carlo-based analysis using pseudo-data generated with realistic form-factor parameterizations. In this approach the most appropriate fitting interval and the model function was selected by using a predefined selection criterion RMSE≤√2. Among the considered functions only Padé (0, 1) fulfilled the set condition. Using this function the best estimate for the proton charge radius was determined to be 0.841(9) fm. The obtained result is in good agreement with recent extractions of the radius and with the new recommended value (CODATA2018, [31]) (see Figure 6). Minimization of the model dependence of the extracted radius is key for reaching consistent interpretation of the modern electron scattering data. Here we offer an approach, which, relying on predefined selection criterion and using Monte-Carlo simulations, simultaneously examines both the model bias and variance. The method successfully applied to the data of Hand et al. can be directly extended to more complex models and used for a robust interpretation of the recent data.
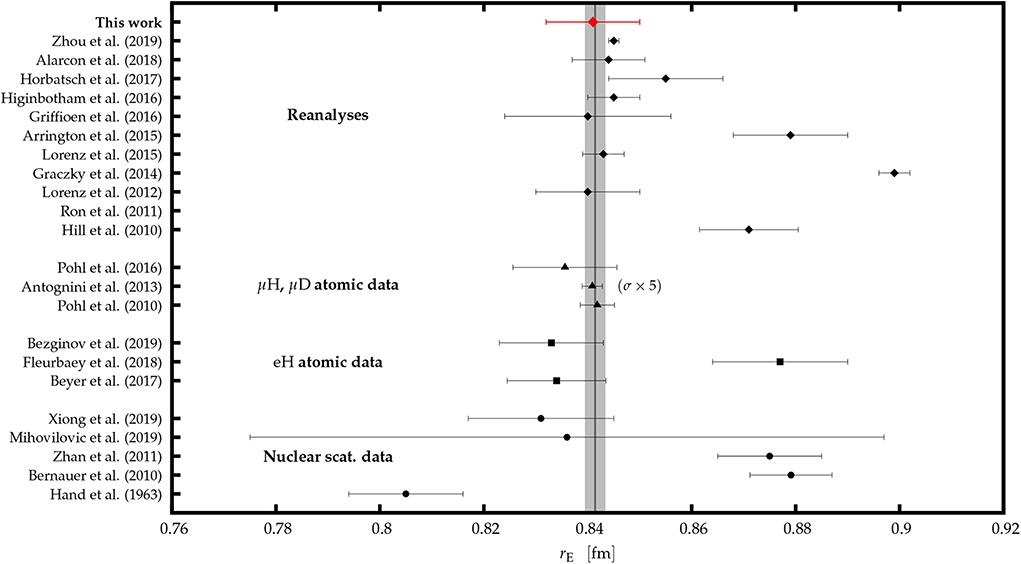
Figure 6. The result of this work compared to other extractions of the proton charge radius. Full circles show findings of modern nuclear scattering experiments [11, 32–34] together with the original result of Hand et al. [2]. Full squares represent values obtained from the recent atomic hydrogen spectroscopy measurements [9, 10, 12]. The triangles denote values determined from the muonic hydrogen (deuterium) measurements [6, 7, 35]. The uncertainties of data from Pohl et al. and Antognini et al. are multiplied by factor 5 for clarity. The diamonds show recent reanalyses of the electron scattering experiments [14, 15, 17–20, 36–40]. The gray line with the corresponding band is the recommended value (CODATA 2018, [31]).
Data Availability Statement
Publicly available datasets were analyzed in this study. This data can be found here: https://journals.aps.org/rmp/pdf/10.1103/RevModPhys.35.335.
Author Contributions
MM, DH, MB, and SŠ have all provided substantial contributions to the analysis, interpretation of the data, and together drafted the paper. They all agree that the paper is ready for publication and agree to be accountable for all aspects of the work in ensuring that questions related to the accuracy or integrity of any part of the work are appropriately investigated and resolved.
Funding
This work was supported by the Federal State of Rhineland-Palatinate, by the Deutsche Forschungsgemeinschaft with the Collaborative Research Center 1044, by the Slovenian Research Agency under Grant P1-0102, and by Jefferson Science Associates which operates Jefferson Lab for the U.S. Department of Energy under contract DE-AC05-06OR23177.
Conflict of Interest
The authors declare that the research was conducted in the absence of any commercial or financial relationships that could be construed as a potential conflict of interest.
References
1. Miller GA. Defining the proton radius: a unified treatment. Phys Rev C. (2019) 99:035202. doi: 10.1103/PhysRevC.99.035202
2. Hand LN, Miller DG, Wilson R. Electric and magnetic form factors of the nucleon. Rev Mod Phys. (1963) 35:335–49. doi: 10.1103/RevModPhys.35.335
3. Hofstadter R, Bumiller F, Yearian MR. Electromagnetic structure of the proton and neutron. Rev Mod Phys. (1958) 30:482–97. doi: 10.1103/RevModPhys.30.482
4. Weisenpacher P. Origin of the nucleon electromagnetic form-factors dipole formula. Czech J Phys. (2001) 51:785–90. doi: 10.1023/A:1011618315454
5. Mohr PJ, Taylor BN, Newell DB. CODATA recommended values of the fundamental physical constants: 2010. Rev Mod Phys. (2012) 84:1527–605. doi: 10.1103/RevModPhys.84.1527
6. Pohl R, Antognini A, Nez F, Amaro FA, Biraben F, Cardoso JMR, et al. The size of the proton. Nature. (2010) 466:213–6. doi: 10.1038/nature09250
7. Antognini A, Nez F, Schuhmann K, Amaro FD, Birab F, Cardoso JMR, et al. Proton structure from the measurement of 2S-2P transition frequencies of muonic hydrogen. Science. (2013) 339:417–20. doi: 10.1126/science.1230016
8. Pohl R, Gilman R, Miller GA, Pachucki K. Muonic hydrogen and the proton radius puzzle. Annu Rev Nucl Part Sci. (2013) 63:175–204. doi: 10.1146/annurev-nucl-102212-170627
9. Beyer A, Maisenbacher L, Matveev A, Pohl R, Khabarova K, Grinin A, et al. The Rydberg constant and proton size from atomic hydrogen. Science. (2017) 358:79–85. doi: 10.1126/science.aah6677
10. Bezginov N, Valdez T, Horbatsch M, Marsman A, Vutha AC, Hessels EA. A measurement of the atomic hydrogen Lamb shift and the proton charge radius. Science. (2019) 365:1007–12. doi: 10.1126/science.aau7807
11. Xiong W, Gasparian A, Gao H, Dutta D, Khandaker M, Liyanage N, et al. A small proton charge radius from an electron-proton scattering experiment. Nature. (2019) 575:147–50. doi: 10.1038/s41586-019-1721-2
12. Fleurbaey H, Galtier S, Thomas S, Bonnaud M, Julien L, Biraben F, et al. New measurement of the 1S−3S Transition frequency of hydrogen: contribution to the proton charge radius puzzle. Phys Rev Lett. (2018) 120:183001. doi: 10.1103/PhysRevLett.120.183001
13. Horbatsch M, Hessels EA. Evaluation of the strength of electron-proton scattering data for determining the proton charge radius. Phys Rev C. (2016) 93:015204. doi: 10.1103/PhysRevC.93.015204
14. Griffioen K, Carlson C, Maddox S. Consistency of electron scattering data with a small proton radius. Phys Rev C. (2016) 93:065207. doi: 10.1103/PhysRevC.93.065207
15. Higinbotham DW, Kabir AA, Lin V, Meekins D, Norum B, Sawatzky B. Proton radius from electron scattering data. Phys Rev C. (2016) 93:055207. doi: 10.1103/PhysRevC.93.055207
16. Lee G, Arrington JR, Hill RJ. Extraction of the proton radius from electron-proton scattering data. Phys Rev D. (2015) 92:013013. doi: 10.1103/PhysRevD.92.013013
17. Graczyk KM, Juszczak C. Proton radius from Bayesian inference. Phys Rev C. (2014) 90:054334. doi: 10.1103/PhysRevC.90.054334
18. Lorenz IT, Meißner UlfG. Reduction of the proton radius discrepancy by 3σ. Phys Lett B. (2014) 737:57–9. doi: 10.1016/j.physletb.2014.08.010
19. Horbatsch M, Hessels EA, Pineda A. Proton radius from electron-proton scattering and chiral perturbation theory. Phys Rev C. (2017) 95:035203. doi: 10.1103/PhysRevC.95.035203
20. Alarcón JM, Higinbotham DW, Weiss C, Ye Z. Proton charge radius extraction from electron scattering data using dispersively improved chiral effective field theory. Phys Rev C. (2019) 99:044303. doi: 10.1103/PhysRevC.99.044303
21. Bernauer JC, Achenbach P, Ayerbe Gayoso C, Böhm R, Bosnar D, Debenjak L, et al. High-precision determination of the electric and magnetic form factors of the proton. Phys Rev Lett. (2010) 105:242001. doi: 10.1103/PhysRevLett.105.242001
22. Bernauer JC, Distler MO, Friedrich J, Walcher T, Ayerbe Gayoso PAC, Bühm R, et al. Electric and magnetic form factors of the proton. Phys Rev C. (2014) 90:015206. doi: 10.1103/PhysRevC.90.015206
23. Littauer RM, Schopper HF, Wilson RR. Scattering of Bev electrons by hydrogen and deuterium. Phys Rev Lett. (1961) 7:141–3.
24. Bumiller F, Croissiaux M, Dally E, Hofstadter R. Electromagnetic form factors of the proton. Phys Rev. (1961) 124:1623–31.
25. Drickey DJ, Hand LN. Precise neutron and proton form factors at low momentum transfers. Phys Rev Lett. (1962) 9:521–4. doi: 10.1103/PhysRevLett.9.521
26. Yount D, Pine J. Scattering of high-energy positrons from protons. Phys Rev. (1962) 128:1842–9. doi: 10.1103/PhysRev.128.1842
27. Lehmann P, Taylor RE, Wilson R. Electron–proton scattering at low momentum energies. Phys Rev. (1962) 126:1183.
28. Mihovilovič M, Weber AB, Achenbach P, Beranek T, Berič ič J, et al. First measurement of proton's charge form factor at very low Q2 with initial state radiation. Phys Lett B. (2017) 771:194–8. doi: 10.1016/j.physletb.2017.05.031
29. Bernauer JC, Distler MO. Avoiding common pitfalls and misconceptions in extractions of the proton radius. In: ECT* Workshop on The Proton Radius Puzzle. Trento (2016).
30. Arrington J, Sick I. Precise determination of low-Q nucleon electromagnetic form factors and their impact on parity-violating e-p elastic scattering. Phys Rev C. (2007) 76:035201. doi: 10.1103/PhysRevC.76.035201
31. Tiesinga E, Mohr PJ, Taylor BN, Newell DB. The 2018 CODATA Recommended Values of the Fundamental Physical Constants (2019). Available online at: http://physics.nist.gov/constants
32. Bernauer JC. Measurement of the Elastic Electron-Proton Cross Section and Separation of the Electric and Magnetic Form Factor in the Q2 Range From 0.004 to 1 (GeV/c)2. Mainz U., Inst. Kernphys. (2010). Available online at: http://wwwa1.kph.uni-mainz.de/A1/publications/doctor/bernauer.pdf
33. Zhan X, Allada K, Armstrong DS, Arrington JR, Bertozzi W, Boeglin W, et al. High-precision measurement of the proton elastic form factor ratio μpGe/GM at low Q2. Phys Lett B. (2011) 705:59–64. doi: 10.1016/j.physletb.2011.10.002
34. Mihovilovič M, Merkel H. ISR experiment at A1-Collaboration. EPJ Web Conf. (2019) 218:04001. doi: 10.1051/epjconf/201921804001
35. Pohl R. Laser spectroscopy of muonic hydrogen and the puzzling proton. J Phys Soc Jpn. (2016) 85:091003. doi: 10.7566/JPSJ.85.091003
36. Arrington J, Sick I. Evaluation of the proton charge radius from E-P scattering. J Phys Chem Ref Data. (2015) 44:031204. doi: 10.1063/1.4921430
37. Hill RJ, Paz G. Model independent extraction of the proton charge radius from electron scattering. Phys Rev D. (2010) 82:113005. doi: 10.1103/PhysRevD.82.113005
38. Ron G, Zhan X, Glister J, Lee B, Allada K, Armstrong W, et al. Low Q2 measurements of the proton form factor ratio μpGe/GM. Phys Rev C. (2011) 84:055204. doi: 10.1103/PhysRevC.84.055204
39. Lorenz IT, Hammer HW, Meißner UlfG. The size of the proton–closing in on the radius puzzle. Eur Phys J A. (2012) 48:151. doi: 10.1140/epja/i2012-12151-1
Keywords: proton, charge radius, form factors, statistical methods, electron scattering
Citation: Mihovilovič M, Higinbotham DW, Bevc M and Širca S (2020) Reinterpretation of Classic Proton Charge Form Factor Measurements. Front. Phys. 8:36. doi: 10.3389/fphy.2020.00036
Received: 03 December 2019; Accepted: 05 February 2020;
Published: 26 February 2020.
Edited by:
Laura Elisa Marcucci, University of Pisa, ItalyReviewed by:
Mitko Gaidarov, Institute for Nuclear Research and Nuclear Energy (BAS), BulgariaRoelof Bijker, National Autonomous University of Mexico, Mexico
Copyright © 2020 Mihovilovič, Higinbotham, Bevc and Širca. This is an open-access article distributed under the terms of the Creative Commons Attribution License (CC BY). The use, distribution or reproduction in other forums is permitted, provided the original author(s) and the copyright owner(s) are credited and that the original publication in this journal is cited, in accordance with accepted academic practice. No use, distribution or reproduction is permitted which does not comply with these terms.
*Correspondence: Miha Mihovilovič, miha.mihovilovic@ijs.si
 Miha Mihovilovič