 Débora E. Peretti1
 Fransje E. Reesink2
 Janine Doorduin1
 Bauke M. de Jong2Peter P. De Deyn2,3Rudi A. J. O. Dierckx1Ronald Boellaard1
 David Vállez García1*
- 1Department of Nuclear Medicine and Molecular Imaging, University Medical Center Groningen, University of Groningen, Groningen, Netherlands
- 2Department of Neurology, Alzheimer Research Centre, University Medical Center Groningen, University of Groningen, Groningen, Netherlands
- 3Laboratory of Neurochemistry and Behaviour, Institute Born-Bunge, University of Antwerp, Antwerp, Belgium
Background: This study explores different approaches to estimate the clearance rate of the reference tissue () parameter used for pharmacokinetic modeling, using the simplified reference tissue model 2 (SRMT2) and further explores the effect on the binding potential (BPND) of 11C-labeled Pittsburgh Compound B (PIB) PET scans.
Methods: Thirty subjects underwent a dynamic PIB PET scan and were classified as PIB positive (+) or negative (–). Thirteen regions were defined from where to estimate : the whole brain, eight anatomical region based on the Hammer's atlas, one region based on a SPM comparison between groups on a voxel level, and three regions using different thresholds.
Results: The different approaches resulted in distinct estimations per subject. The median value of the estimated across all subjects in the whole brain was 0.057. In general, PIB+ subjects presented smaller estimates than this median, and PIB–, larger. Furthermore, only threshold and white matter methods resulted in non-significant differences between groups. Moreover, threshold approaches yielded the best correlation between and for both groups (R2 = 0.85 for PIB+, and R2 = 0.88 for PIB–). Lastly, a sensitivity analysis showed that overestimating values resulted in less biased estimates.
Conclusion: Setting a threshold on might be the best method to estimate in voxel-based modeling approaches, while the use of a white matter region might be a better option for a volume of interest based analysis.
Introduction
Current research suggests that Alzheimer's disease (AD) is associated with an abnormal deposition of the amyloid-β (Aβ) peptide in the brain [1, 2]. These Aβ deposits may lead to progressive dysfunction and nerve cells death, resulting in a neurodegenerative process [3]. It is possible to assess this deposition in-vivo through the use of the 11C-labeled Pittsburgh Compound B (PIB) radiotracer in positron emission tomography (PET) studies [4–6]. A simple visual assessment of standardized uptake value (SUV) images, derived from these PET scans, might suffice to assess whether or not there is Aβ deposition. However, through pharmacokinetic modeling of dynamic PIB PET scans, it might be possible to further classify the amount of deposition in the brain [7].
Previous studies have already confirmed that the simplified reference tissue model (SRTM) [8] is the preferred method for pharmacokinetic modeling of PIB when arterial input is not available [9, 10]. However, improvements on the accuracy of the model can be done by coupling parameters [11] thereby reducing the number of variables to be fitted by the model. The simplified reference tissue model 2 (SRTM2) [12] has been validated as a model “with better accuracy and precision” [10] than the original SRTM, and has been frequently used in AD PET studies [13–16].
SRTM is a model that fits three parameters: binding potential (BPND), relative tracer flow (R1), and clearance rate constant of the reference region (). Meanwhile, SRTM2 is a model fitted in two runs. During the first run, SRTM is used to obtain an estimate for for each voxel in the image. This value is then fixed to the median using voxels outside the reference region. Next, a second run is done, fitting the two remaining parameters (BPND and R1), thus reducing the noise in the specific binding estimates and functional images. SRTM and SRTM2 were originally developed for the analysis of neuroreceptor binding. Furthermore, SRTM2 was implemented with the intention of reducing noise levels of the model parameters using a well-defined receptor-rich region for the estimation. Nonetheless, this assumption might be violated in the case of PIB, especially in healthy subjects, who are not expected to have Aβ deposition.
Previous studies using SRTM2 for pharmacokinetic modeling employed different approaches for estimation. For example, this parameter was evaluated by coupling all target time activity curves for radiotracers designed for D2/D3 receptors [17, 18] and radioligands with a high affinity for the serotonin transporter [19]. Tracers such as [11C]P943 [20], used for quantifying serotonin 5-HT1B receptors, use the median value of the estimation for all voxels that have a value between 0.5 and 4, and [18F]DPA-714 [21], used for neuroinflammation, the median of all values from all voxels in the image.
However, Aβ deposits are not evenly distributed across the brain [22], and change over time with AD progression [3]. Therefore, there are no well-defined receptor-rich regions. Other radiotracers, such as [18F]Florbetaben [23], [18F]Flutemetamol [24], and [18F]Florbetapir [25], which also bind to the Aβ plaques, present the same issue. Studies with these tracers have either used SRTM or SRTM2, estimating from all voxels of the image outside the reference region. This approach can be challenging in studies that include subjects without amyloid deposition, because the signal is not as high as in subjects that present these deposits. This lack of signal might result in noisy images, which may reduce the reliability of the estimations of the parameters from the models. In the case of PIB, previous investigations performed a pharmacokinetic analysis using SRTM [26, 27], reference Logan [28], and SRTM2 [10, 13–16]. Yet, there is no consensus on how the estimation should be done. Some studies take the mean SRTM-derived value from all target regions [13, 14], while others set a minimum threshold on the parametric map to select the voxels being used for the estimation [10, 15, 16]. To the best of the authors' knowledge, the effects that these approaches to estimate have in the final BPND value, have not yet been explored.
Therefore, the aim of this study was to examine the consequences of estimating using different approaches, and to define an optimal method for estimating for the analysis of dynamic PIB PET studies using SRTM2.
Materials and Methods
Subjects
A cohort of 30 subjects, which were available at the moment of performing this study, was selected from a larger ongoing study at the memory clinic of the University Medical Center of Groningen (UMCG), Groningen, The Netherlands. Written informed consent to participate in the study was provided. The study was conducted in agreement with the Declaration of Helsinki and subsequent revisions and approved by the Medical Ethical Committee of the UMCG (2014/320).
Patients were clinically diagnosed, by consensus in a multidisciplinary team, either with Alzheimer's Disease (AD), according to the National Institute on Aging and Alzheimer's Association criteria (NIA-AA) [29], or with mild cognitive impairment (MCI), in agreement with the Petersen criteria [30]. Healthy controls (HC) had no cognitive complaints and a mini-mental state examination score above 28. All subjects underwent standard dementia screening, and multimodal neuroimaging, including PIB PET scans and T1-3D magnetic resonance imaging (MRI). After the PIB PET scan, clinical diagnoses were reconsidered, according to the National Institute on Aging and the Alzheimer's Association Research supposed Framework [1]. Subjects were then divided into two categories, based on visual inspections of cortical levels of PIB binding, as “PIB+,” if binding levels were high, and “PIB–,” if they were low. The demographic characteristics of subjects are presented in Supplementary Table 1.
PET Acquisition
Subjects underwent a dynamic PIB PET scan under standard resting conditions with closed eyes. Scans were performed with either a Siemens Biograph 40 or 64 mCT PET scan (Siemens Medical Solutions, USA). Both systems were from the same vendor and from the same generation; the acquisition and reconstruction protocols were harmonized, and the systems were (cross-) calibrated. Therefore, no significant differences were expected from the images provided by these two different scanners. Nonetheless, a comparison between the data used in this study, provided from the different scanners, was made using a t-test and, as expected, no significant results were found. PIB tracer was synthesized at the radiopharmacy facility at the Nuclear Medicine and Molecular Imaging department at the UMCG, according to Good Manufacturing Practice. The tracer was administered via a venous cannula, and the acquisition started simultaneously with the PIB injection (379 ± 46 MBq). Dynamic PIB PET acquisition lasted for at least 60 min (frames: 7 × 10 s, 3 × 30 s, 2 × 60 s, 2 × 120 s, 2 × 180 s, 5 × 300 s, and 2 × 600 s). List-mode data from PET scans were reconstructed using 3D OSEM (three iterations and 24 subsets), point spread function correction and time-of-flight, resulting in images with 400 × 400 × 111 matrix, isotropic 2 mm voxels, smoothed with a 2 mm-Gaussian filter at Full Width and Half Maximum (FWHM).
Image Processing
Registration and data collection from the images were done using the PMOD software package (version 3.8; PMOD Technologies LLC). Using tissue probability maps [31], the T1 3D MRI scans were spatially normalized to the Montreal Neurologic Institute space. To define the anatomical brain regions, the Hammers atlas [32] was selected. A total of 77 regions were drawn, with right and left side separated and white matter distinguished from cortical tissue. Some regions from the original atlas were excluded: cerebellar white matter, the corpus callosum, the third ventricle, the lateral ventricles, and the temporal horns. The PET images were corrected for motion using the average of the first 12 frames and were then aligned to the MRI in individual space. The PET images were also smoothed with a Gaussian filter of 6 mm at FWHM, and voxels that were outside of the brain were masked.
Pharmacokinetic Modeling
Parametric images were generated using pharmacokinetic modeling of the dynamic PIB PET at a voxel level in individual space, and it was done in three steps: (1) a first estimate of the , R1, and efflux constant of the reference region () was obtained using a basis function implementation of SRTM [8]; (2) the parameter was then fixed to the median value of all voxels in a predefined volume of interest (VOI); and (3) the final parametric map was estimated using SRTM2 [12]. Thirteen approaches were used to generate VOIs to estimate the median (Supplementary Table 2, Figure 1): one approach containing all voxels of the masked brain image, eight approaches based on predefined anatomical structures or VOIs, three approaches based on selecting voxels using fixed thresholds, and one VOI approach defined by voxels having a statistically significant difference between the images of each group (SPM). These statistical comparisons at voxel level were performed in SPM12 (Wellcome Trust Center for Neuroimaging, UK) with a two-sample t-test, and T-maps interrogated at p = 0.005 (uncorrected) and only clusters with p < 0.05, corrected for family-wise error, were considered significant. Then these VOIs were projected onto the parametric maps and the median value [12] of the voxels within the volumes were taken and used for the generation of the final parametric BPND maps with SRTM2 (). The gray matter of the cerebellum was used as a reference region due to its lack, or very late presentation, of specific PIB binding [4, 33–35]. The imposed restriction on the range of possible apparent uptake rate constant (k2a) values, with a minimum of 0.01 and a maximum of 0.3, and 80 basis functions was used. These settings were applied to both the basis function implementations of SRTM and SRTM2. The R1 parameter was not considered in this study as it is insensitive to small changes in the fixed [8, 14].
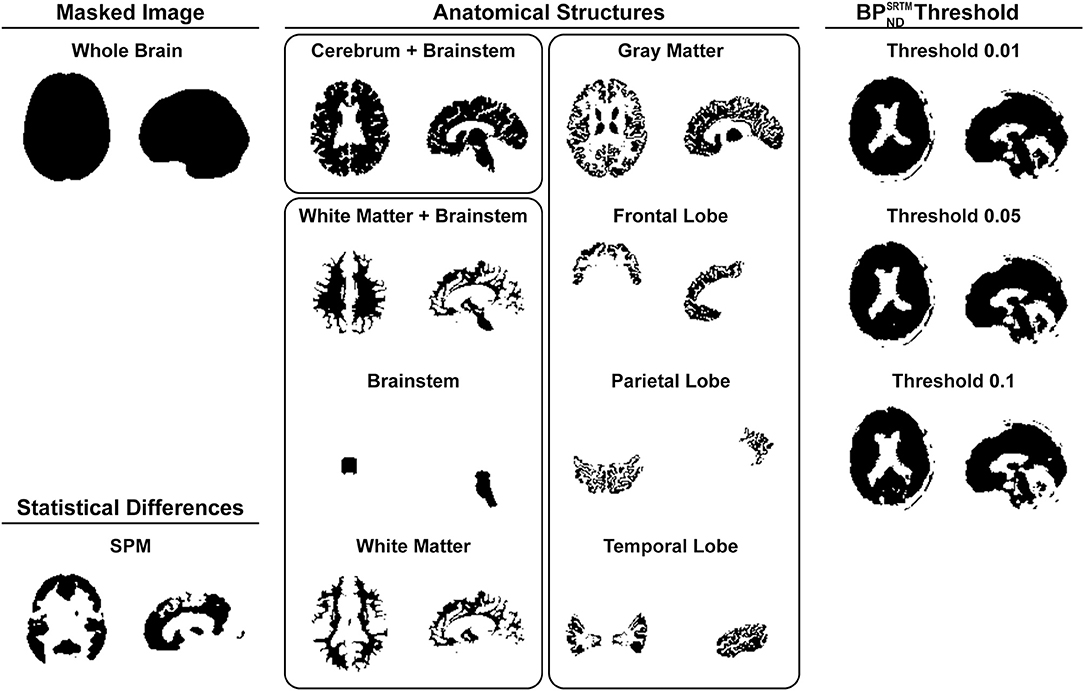
Figure 1. Resemblance of the generated VOIs to be used on the estimation of organized by approaches: a VOI for the whole masked image, eight volumes based on anatomical structures (Cerebrum + Brainstem, White Matter + Brainstem, Brainstem, White Matter, Gray Matter, Frontal Lobe, Parietal Lobe, and Temporal Lobe), three volumes based on different thresholds (Threshold 0.01, Threshold 0.05, Threshold 0.1), and one volume based on the statistical differences between groups on a voxel level.
Histograms of distribution were constructed using voxel values within the VOIs of the average parametric maps per group.
Statistical Analyses
A two sample t-test was performed to evaluate differences in estimations between the groups. Moreover, since the standard approach from SRTM2 to estimate is to consider all voxels of the masked brain image outside of the cerebellum, a paired t-test was done to assess the discrepancy between the values yielded by the Whole Brain and the other methods. This approach has been used before in studies with other radiotracers that do not have a region with specific binding [36]. Boxplots of the distributions for each method were also generated. Comparisons between PIB+ and PIB– groups for each method were done using a t-test.
To explore the effect of the applied value on , a sensitivity analysis was done, where the parameter was fixed to a range of values from 0.005 to 0.09 (with steps of 0.005), and the parametric maps were generated for each . values were retrieved from these images for all brain regions. This effect was plotted with the fixed values minus the median of all subjects for the Whole Brain method, against the difference between of the fixed value and the average of all subjects in the Whole Brain method. In this study, it was chosen to report the BPND values, nevertheless the results also apply to the distribution volume ratio (DVR) as the values distinguish only by an offset of 1 [11]. Three brain regions were chosen to be shown: a region with high binding (Superior Parietal Gyrus left), a region with medium binding (Inferior Frontal Gyrus right), and a region with low PIB binding (Lateral Remainder of Occipital Lobe right).
A scatter plot was made to visually assess the correlation between the and estimations. Then a general linear model was used to compare the values, with the estimations as the independent variable and the as the dependent variable.
A Bland-Altman plot was made to evaluate the agreement between the two BPND measurements. A p-value of 0.05 was used as a significance threshold for all statistical analyses, and no correction for multiple comparisons was made. All statistical analyses were made using RStudio [RStudio version 1.1.423, R version 3.4.3 [37]].
Criteria for Best Method Selection
To select the best method for estimating , the 13 approaches were ranked based on the following criteria, in order of importance: (1) absence of significant differences in values between the groups; (2) estimation closer to the median value of the population; (3) high correlations between and ; (4) linear regression's result with a slope closest to 1, and (5) an intercept closest to 0.
Results
Parametric Maps
The parametric maps were noticeably different for PIB+ and PIB– subjects (Figure 2), with the main difference between groups being an increase of gray matter voxel values in the PIB– group. When observing the distribution of the values of all voxels across the images, a discrepancy can be seen on the height and position of the peaks and the variance of values in the histograms (Figure 2). The PIB+ group had a peak at 0.04, and a median value of 0.05, while the PIB– group presented values of 0.04 and 0.06, respectively. The histogram counts of gray and white matter voxels of each image only, also revealed that the main difference between groups was a wider distribution of values in the gray matter voxels of PIB– subjects when compared to PIB+ patients, although there was a shift in both peaks.
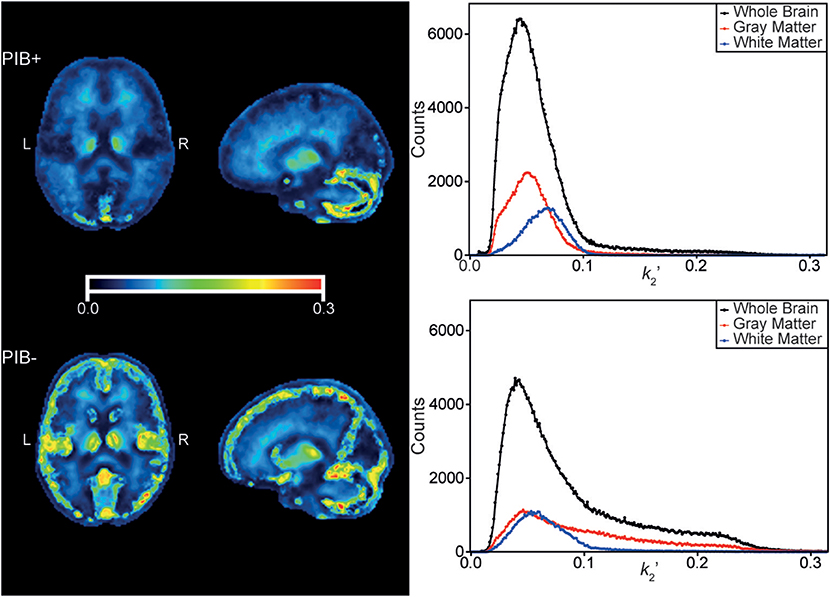
Figure 2. Median parametric maps of all subjects from the PIB+ (top left), and PIB– (left bottom) groups. Shown are corresponding transaxial, and sagittal slices of the brain. Color scales were adjusted to the same range. On the right, the histograms containing the counts of values from the voxels of the parametric maps on the left. Black dots and lines correspond to voxels contained inside the Whole Brain VOI, in red, of voxels from the Gray Matter VOI, and in blue, from the White Matter. The range of the histograms was adjusted to the same range of the color scale of the parametric maps.
Efflux Parameter Estimation ()
The VOI approaches for retrieving the median values yielded different estimations (Figure 3). In general, gray matter VOIs (i.e., Gray Matter, Frontal, Parietal, and Temporal Lobes) resulted in a larger and statistically significant difference in estimations between PIB+ and PIB– subjects, while white matter and threshold VOIs did not (Supplementary Table 3). For the PIB+ group, the Parietal Lobe VOI presented the largest range of distribution (range 0.03–0.09), and the Whole Brain, the smallest one (0.04–0.08). For the PIB–, the largest range of distribution was observed for the Frontal Lobe (0.04–0.13), and the smallest for the Brainstem (0.06–0.09). Most methods presented a statistically significant difference when compared with the Whole Brain (Supplementary Table 4). Meanwhile, the threshold approaches presented the smallest discrepancy in for both groups, and, in general, this difference was not statistically significant.
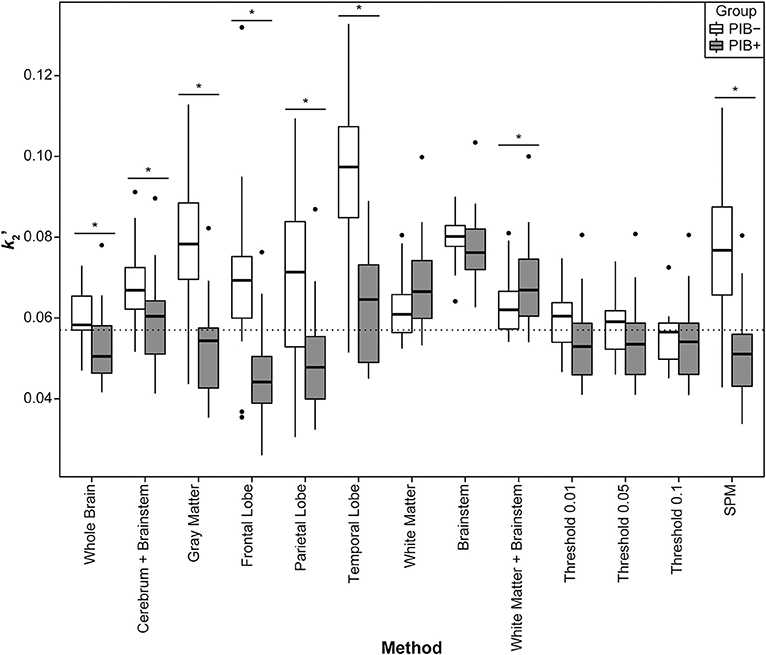
Figure 3. Distribution of individual subject's values per group for all methods. The boxes show the interquartile range of distribution, the solid line shows the median value for the group, the whiskers expand up to 1.5 times the interquartile range, and the further points are the outlier subjects. In white, the values from the PIB– subjects, and in gray, from the PIB+ patients. The dashed line corresponds to the median value from all subjects combined for the Whole Brain method. The stars show which methods presented a significant difference between groups resulting from the t-tests.
The median value using the Whole Brain method was 0.057, and the methods that presented the smallest range of distribution, as well as having a mean closest to the Whole Brain value, were Threshold 0.1 and, from the anatomical approaches, the White Matter. The first method presented values of (mean ± SD) 0.05 ± 0.01 (range 0.04–0.08) for the PIB+ group, and 0.06 ± 0.01 (0.05–0.07) for the PIB–. Additionally, the latter resulted in values of 0.07 ± 0.01 (0.05–0.1) for the PIB+, and 0.06 ± 0.01 (0.05–0.08) for the PIB–. This White Matter method yielded, however, an overestimation of the parameter of 31.8% for the PIB+ group, and 4.4% for the PIB–, when compared to the Whole Brain. Supplementary Table 3 shows the means, standard deviations, and ranges of per group for all methods, along with the p-value of the t-test that compared the differences between groups.
Sensitivity Analysis
When exploring the effect of estimations on the , a non-linear relationship between the parameters was observed. This can be seen both in Figure 4, which shows the relative change in as a function of the fixed value relative to the Whole Brain , vs. the difference between the fixed and the estimated value for the Whole Brain; and in Supplementary Figure 1, which shows the values for each fixed . Overall, all brain regions presented a similar relationship: a steep increase of with the increment of values until it reaches a peak, followed by an exponential decrease. It was also observed that the larger the fixed , the smaller the change in was. It could further be seen that for regions with more binding, the was more sensitive to deviations in .
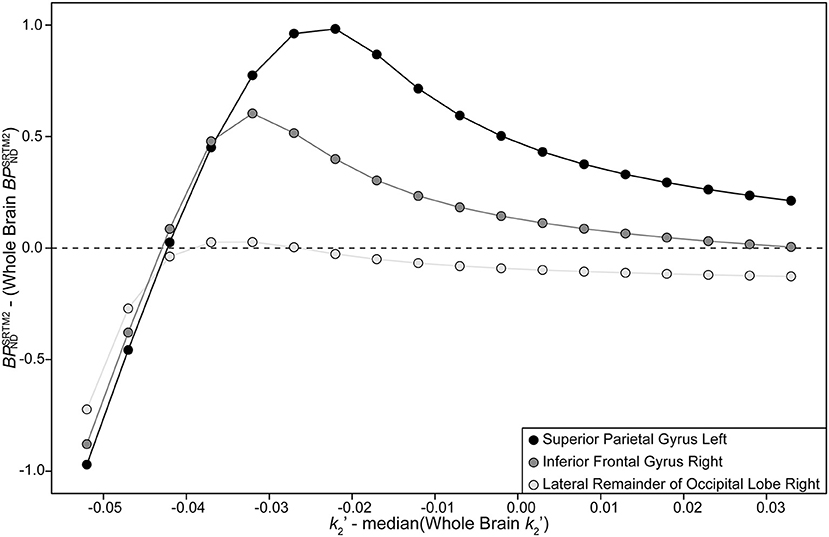
Figure 4. Plot of the relative changes in with relative increment of . In the x-axis is the fixed value of (which varied from 0.005 to 0.09 with a step of 0.005) minus the median from the data of all subjects for the Whole Brain method. In the y-axis is the of the fixed value of a specific brain region minus the value of the same region for the Whole Brain method. The dashed line represents a difference in of zero. Black dots represent data from the Superior Parietal Gyrus left region (a region with high PIB binding), in dark gray, the Inferior Frontal Gyrus right (a region with medium binding), and in light gray, the Lateral Remainder of Occipital Lobe right (a region with low binding of PIB).
Correlation of Binding Potential Values From SRTM and SRTM2
The general linear model suggested a strong correlation between and for all methods (Table 1, Figure 5), with higher R2 values for PIB– subjects and with all results being significant. For the PIB+ group, the smallest R2 was 0.79, for Frontal and Parietal Lobe methods, while the highest was 0.83 for Cerebrum + Brainstem, Temporal Lobe, Brainstem, and threshold methods. For the PIB–, the smallest R2 was 0.85 for the Parietal Lobe, and the highest correlation was 0.88 for the Whole Brain, Cerebrum + Brainstem, and the threshold methods. The slope furthest from 1 was 0.67 for the PIB+ patients, when using the White Matter + Brainstem method, while the closest to 1 slope was 0.95 when using the Parietal Lobe VOI. Additinally, for the PIB– subjects, these values were, 0.99 when using the SPM method, and 0.86 when using the Temporal Lobe VOI, respectively. Threshold methods were not the closest to 1 for each group individually, however this approach had the overall best performance (slope of 0.86 for PIB+; and for PIB− 1.02, 1.03, and 1.05 for Threshold 0.01, 0.05, and 0.1 respectively).
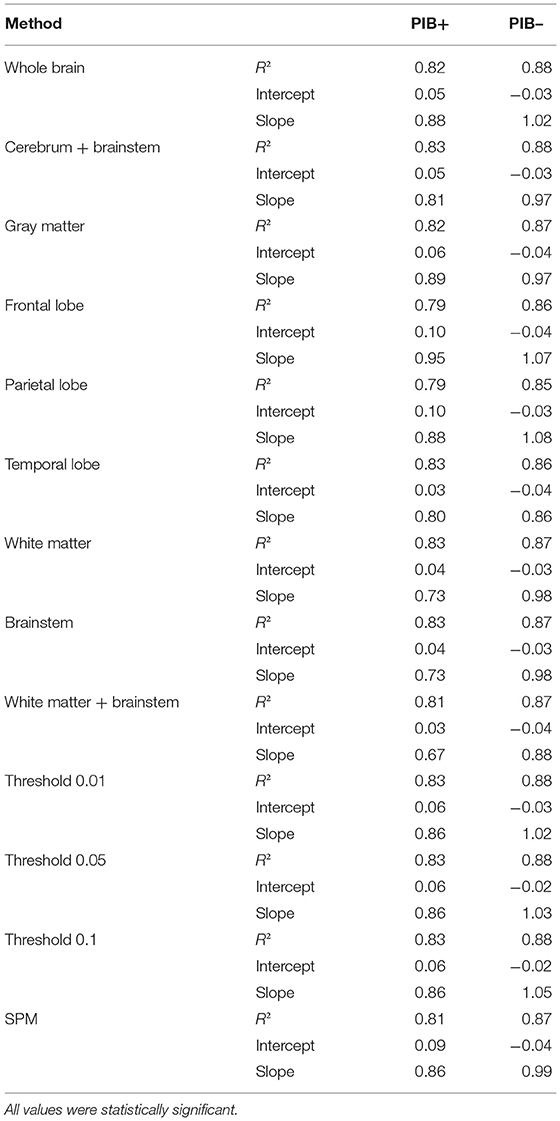
Table 1. Results from the general linear model comparing and from different methods.
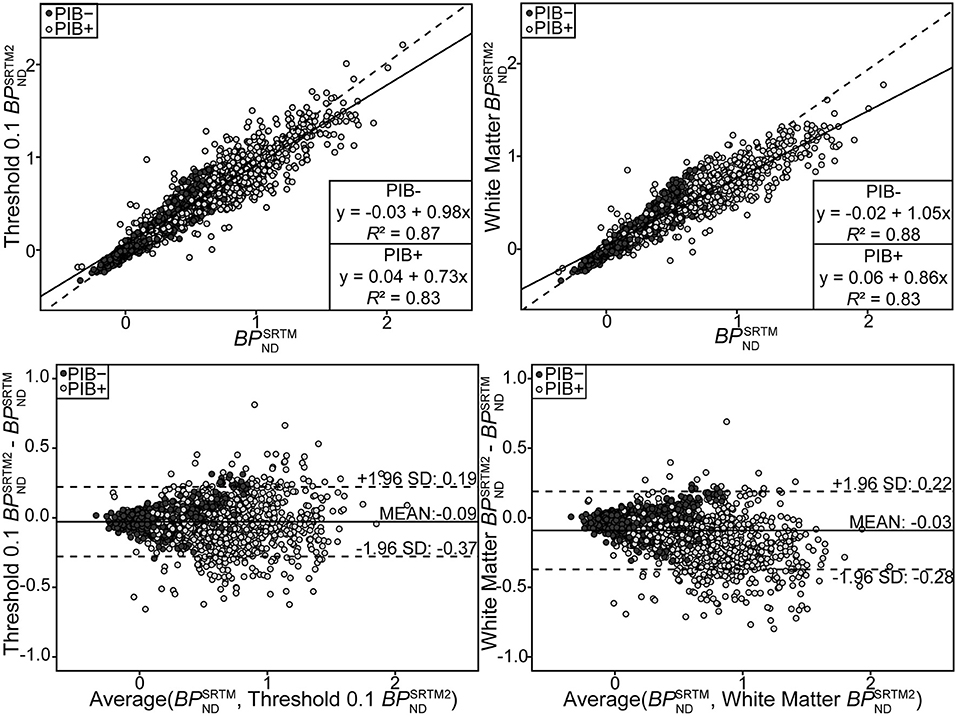
Figure 5. Scatter plot showing estimates (y-axis) from Threshold 0.1 (top left) and White Matter (top right), and values (x-axis). Lines resulting from the linear regression applied to the data are also shown, a full line for the PIB+ group, and a dashed line for the PIB–. Results of the linear regression are given in boxes at the bottom right corner of each plot. Bland-Altman plot showing the difference between the values of BPND assessed by different SRTM2 methods (by Threshold 0.1 on the bottom left, and by White Matter on the bottom right) from SRTM. The full line is at the mean difference values for the group, and the dashed lines delimit the 95% agreement interval (at mean ± 1.96 × standard deviation). Dark gray circles represent data from the PIB– patients, and light gray, from the PIB+ subjects.
Bias Assessment
The bias between and for different methods revealed a negative trend that was proportional to for the PIB+ patients, and showed a more disperse distribution for the PIB– subjects (Figure 5, Table 2). Nearly all methods resulted in a statistically significant bias in for the PIB– group. For the PIB+ group, the only methods that did not result in a significant bias were the ones based on three different thresholds, Gray Matter VOI, and SPM (Table 2). A wider range was observed for the PIB+ patients (e.g., for the Whole Brain, −0.64–0.86) than for the PIB– subjects (−0.32–0.29, same method). The mean bias between and when using the Threshold 0.1 method was −0.04 ± 0.17 for the PIB+ group (a bias of 2%, slope = 0.02, intercept = −0.05), and −0.01 ± 0.07 (a bias of 16%, slope = 0.16, intercept = −0.03) for the PIB– group, and for the White Matter method, −0.15 ± 0.17 (a bias of 15%, slope = −0.15, intercept = −0.05), and −0.03 ± 0.07 (a bias of 8%, slope = 0.08, intercept = −0.04), respectively.
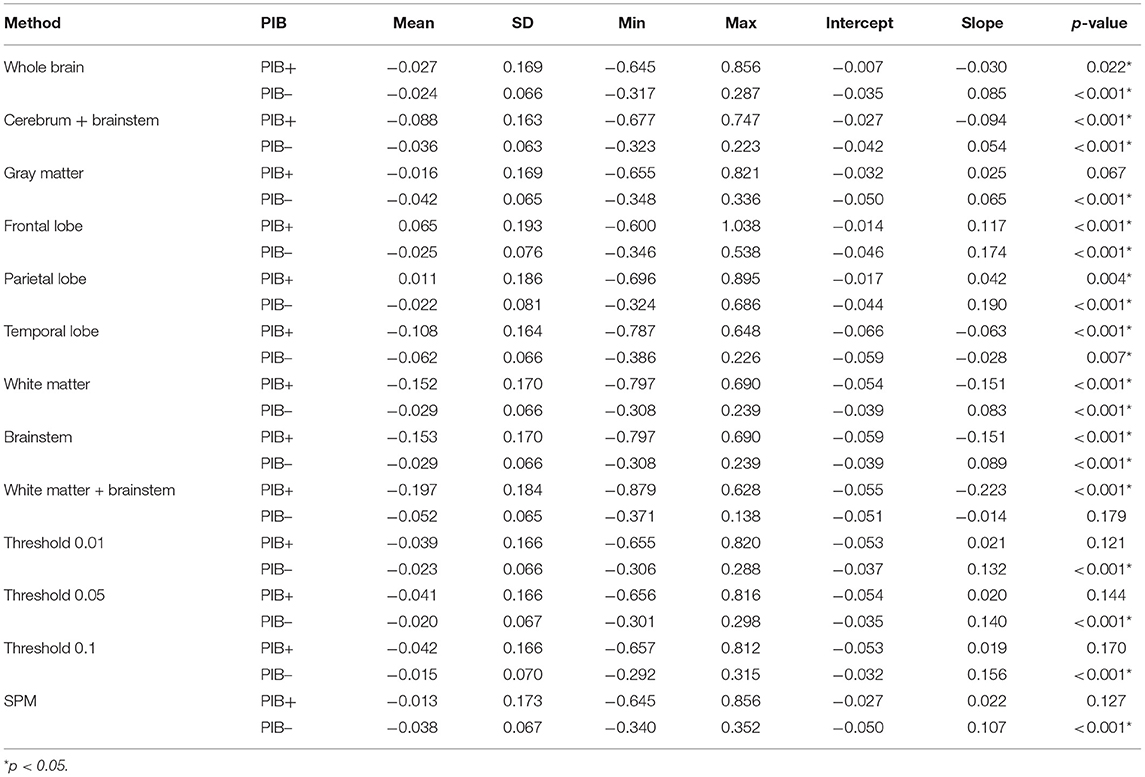
Table 2. Results from the bias assessment comparing and from different methods.
Ranking of the Methods
In summary, based on the results presented in the previous section, the following ranking of the preferred methods to estimate was: Threshold 0.1, Threshold 0.05, Threshold 0.01, White Matter, White Matter + Brainstem, Brainstem, Whole Brain, Cerebrum + Brainstem, Frontal Lobe, Gray Matter, Parietal Lobe, SPM, Temporal Lobe.
Discussion
In this study, different approaches of estimating the optimal to be fixed in SRTM2 and their impact on were explored. The estimation is an important step in the pharmacokinetic analysis of dynamic PIB PET scans using SRTM2, as a bias in affects the obtained binding potential. Although SRTM2 has already been validated as a suitable model for PIB studies [10], the fact that there is no well-defined receptor-rich region might lead to errors in the estimation of , and an examination of the consequences of wrongly determining has not yet been done.
For both PIB+ patients and PIB– subjects, the cerebellum is a region without specific binding of Aβ tracers, so it can be used as a reference region for the pharmacokinetic modeling of the radiotracer using SRTM2 [4, 10, 33–35]. Thus it is not expected that there will be a significant difference between groups when estimating , as has already been seen from previous studies [38]. Therefore, it is important to consider this when selecting a method.
The main difference between groups is that the PIB+ subjects present an accumulation of Aβ plaques on the cortex [3], and thus a higher binding of PIB in these areas, while the PIB– subjects do not, as was seen in the histograms of Figure 2. Because of this discrepancy, it was not a surprise that the SPM VOI was composed mainly of gray matter voxels. Furthermore, this distinction between group values is the most probable explanation for the poor performance of gray matter (i.e., Gray Matter, Frontal, Parietal, and Temporal Lobes) and SPM methods, especially in the PIB– group. This difference between groups, which can be seen in Figure 2, also shows that not all brain regions might be suitable for estimating , as the value for this parameter depends on which group the subject belongs to. This further demonstrates that, although the theoretical assumption of SRTM2 is that should be constant across the brain, it is not the case in practice.
Moreover, threshold based approaches guarantee that only voxels with some minimal elevated level of PIB binding were included within the VOIs used for the estimation. Since PIB does not have a specific target region, these methods might be the best approaches when using SRTM2. Furthermore, this selection of voxels may also explain why there was a smaller difference in between groups for these methods (Figure 3).
The preferred method for estimating should be using plasma input. However, blood data is not always available, as in the case of this study, and, therefore, there is a need for finding the best way of estimating this parameter directly from the image since it influences the value. A previous study by Price and colleagues [34] estimated these parameters using plasma input compartmental modeling, and they found a ratio of non-specific trapping () of 1.4 and an average clearance for target tissues (k2) was of 0.144. With these measurements, an estimation of can be done using , resulting in a of 0.055. This value is close to the median value of 0.057 found in the present study. Interestingly, estimates using white matter methods (i.e., White Matter, Brainstem, and White Matter + Brainstem) diverged the most from this expected value for both groups. Meanwhile, gray matter methods only deviated for the PIB– group. From this observation, it might be concluded that regions without specific binding of PIB might result in a overestimation. Furthermore, PIB retention has been shown to be similar in white matter for both AD patients and HC subjects [4], which explains the absence of differences between groups for these methods.
The results presented in the previous section showed that an overestimation of might not be an issue as this would lead to a smaller bias in than when underestimating . Slight changes in low values yield larger shifts in estimation, while for larger values, smaller shifts in were observed. Because of this behavior, it is better to impose a lower boundary on , to secure a smaller bias in . This limit could be around 0.04, since most of the estimation across methods and subjects were higher, and the sensitivity plot showed larger biases for values below 0.04 (Supplementary Figure 1). Because the actual estimation can be substantially different between subjects, it is not recommended to fix to a single value across all subjects or to use a population based value. Based on all results presented, a ranking of the methods was done. The method Threshold 0.1 was the one that presented the highest correlation between and for both groups. Moreover, it did not show a significant difference in estimated between groups and resulted in a median value closest to the expected value, as estimated before [34]. Therefore, the Threshold 0.1 method is the recommended approach for the SRTM2 voxel-based analysis of dynamic PIB PET images. While this study was done using a voxel-based modeling approach (SRTM2), some of the results can be extended to VOI-based modeling [such as regional time-activity curves (TAC)]. However, the delineation of the threshold VOIs was done using the parametric maps, and these maps are not available when performing TAC analysis. Thus, in the case of VOI-based modeling, it might be optimal to select a predefined VOI from where to estimate . In this scenario, the White Matter VOI seems to be the recommended region for estimating , for the same reasons that Threshold 0.1 was recommended for voxel-based analysis.
In this study, all analyses focused on the use of a reference tissue approach. Previous studies have shown that there is a high correlation between and BPND delivered by a plasma-input two-tissue compartment model [10]. Since plasma input data was not available for this study, no comparison with the ground truth could be done, although there was a good agreement between the median estimated from all subjects and that seen in previous studies [10, 34]. Furthermore, another limitation was the lack of a measure for quantifying the accuracy of the parametric maps generated using both SRTM and SRTM2. Moreover, this study was performed using PIB as a radiotracer, but it can be assumed that the same results are applicable to other tracers, such as [18F]Florbetapir, [18F]Florbetaben, and [18F]Flutemetamol, since their target is also the deposit of Aβ plaques in the brain [39]. However, further research is required to confirm this.
In conclusion, this study aimed to assess the optimal method for deriving and fixing to measure the binding potential with SRTM2. It was found that the different approaches tested yielded distinct estimates across methods and subject groups, which, in turn, affected estimates. In this study, it was found that setting a threshold on to select brain regions or voxels to estimate is the best method for voxel-based pharmacokinetic modeling of PIB PET scans. Moreover, for VOI-based analysis of the images, a white matter volume of interest to derive is a good alternative.
Data Availability Statement
The datasets generated for this study are available on request to the corresponding author.
Ethics Statement
The studies involving human participants were reviewed and approved by Medical Ethical Committee of the UMCG. The patients/participants provided their written informed consent to participate in this study.
Author Contributions
DP, DV, FR, JD, and RB were responsible for the study design. FR, PD, and RB coordinated the study. DP and DV were responsible for image processing and data analysis. DP, DV, JD, and RB were responsible for the initial draft of the manuscript. All authors critically revised the final version of the manuscript.
Funding
This project (RB and DV) has received partial funding from the European Union's Horizon 2020 research and innovation programme under the Marie Skłodowska-Curie Grant Agreement No 764458.
Conflict of Interest
The authors declare that the research was conducted in the absence of any commercial or financial relationships that could be construed as a potential conflict of interest.
Acknowledgments
The authors would like to thank PMOD Technologies staff, especially Cyrill Burger, for technical support.
Supplementary Material
The Supplementary Material for this article can be found online at: https://www.frontiersin.org/articles/10.3389/fphy.2019.00212/full#supplementary-material
References
1. Jack CR, Bennett DA, Blennow K, Carrillo MC, Dunn B, Haeberlein SB, et al. NIA-AA Research framework: toward a biological definition of Alzheimer's disease. Alzheimer's Dement. (2018) 14:535–62. doi: 10.1016/j.jalz.2018.02.018
2. Mattson MP. Pathways towards and away from Alzheimer's disease. Nature. (2004) 430:631–9. doi: 10.1038/nature02621
3. Thal DR, Rüb U, Orantes M, Braak H. Phases of Aβ-deposition in the human brain and its relevance for the development of AD. Neurology. (2002) 58:1791–800. doi: 10.1212/WNL.58.12.1791
4. Klunk WE, Engler H, Nordberg A, Wang Y, Blomqvist G, Holt DP, et al. Imaging brain amyloid in Alzheimer's disease with Pittsburgh Compound-B. Ann Neurol. (2004) 55:306–19. doi: 10.1002/ana.20009
5. Nordberg A, Rinne JO, Kadir A, Långström B. The use of PET in Alzheimer disease. Nat Rev Neurol. (2010) 6:78–87. doi: 10.1038/nrneurol.2009.217
6. Rowe CC, Ng S, Ackermann U, Gong SJ, Pike K, Savage G, et al. Imaging beta-amyloid burden in aging and dementia. Neurology. (2007) 68:1718–25. doi: 10.1212/01.wnl.0000261919.22630.ea
7. Lammertsma AA. Forward to the past: the case for quantitative PET imaging. J Nucl Med. (2017) 58:1019–24. doi: 10.2967/jnumed.116.188029
8. Lammertsma AA, Hume SP. Simplified reference tissue model for PET receptor studies. Neuroimage. (1996) 4:153–8. doi: 10.1006/nimg.1996.0066
9. Lopresti BJ, Klunk WE, Mathis CA, Hoge JA, Ziolko SK, Lu X, et al. Simplified quantification of Pittsburgh compound B amyloid imaging PET studies: a comparative analysis. Time. (2005) 1959–72.
10. Yaqub M, Tolboom N, Boellaard R, van Berckel BNM, van Tilburg EW, Luurtsema G, et al. Simplified parametric methods for [11C]PIB studies. Neuroimage. (2008) 42:76–86. doi: 10.1016/j.neuroimage.2008.04.251
11. Zhou Y, Resnick SM, Ye W, Fan H, Holt DP, Klunk WE, et al. Using a reference tissue model with spatial constraint to quantify [11C]Pittsburgh compound B PET for early diagnosis of Alzheimer's disease. Neuroimage. (2007) 36:298–312. doi: 10.1016/j.neuroimage.2007.03.004
12. Wu Y, Carson RE. Noise reduction in the simplified reference tissue model for neuroreceptor functional imaging. J Cereb Blood Flow Metab. (2002) 22:1440–52. doi: 10.1097/01.WCB.0000033967.83623.34
13. Chen YJ, Rosario BL, Mowrey W, Laymon CM, Lu X, Lopez OL, et al. Relative 11C-PiB delivery as a proxy of relative CBF: quantitative evaluation using single-session 15O-water and 11C-PiB PET. J Nucl Med. (2015) 56:1199–205. doi: 10.2967/jnumed.114.152405
14. Meyer PT, Hellwig S, Amtage F, Rottenburger C, Sahm U, Reuland P, et al. Dual-biomarker imaging of regional cerebral amyloid load and neuronal activity in dementia with PET and 11C-labeled pittsburgh compound B. J Nucl Med. (2011) 52:393–400. doi: 10.2967/jnumed.110.083683
15. Peretti DE, Vállez García D, Reesink FE, van der Goot T, De Deyn PP, de Jong BM, et al. Relative cerebral flow from dynamic PIB scans as an alternative for FDG scans in Alzheimer's disease PET studies. PLoS ONE. (2019) 14:e0211000. doi: 10.1371/journal.pone.0211000
16. Tolboom N, Yaqub M, Boellaard R, Luurtsema G, Windhorst AD, Scheltens P, et al. Test-retest variability of quantitative [11C]PIB studies in Alzheimer's disease. Eur J Nucl Med Mol Imaging. (2009) 36:1629–38. doi: 10.1007/s00259-009-1129-6
17. Amtage F, Spehl TS, Hellwig S, Sahm U, Hellwig B, Reuland P, et al. Assessment of striatal dopamine D2/D3 receptor availability with PET and 18F-Desmethoxyfallypride: comparison of imaging protocols suited for clinical routine. J Nucl Med. (2012) 53:1558–64. doi: 10.2967/jnumed.112.103812
18. Sandiego CM, Gallezot J-D, Lim K, Ropchan J, Lin S-F, Gao H, et al. Reference region modeling approaches for amphetamine challenge studies with [ 11 C]FLB 457 and PET. J Cereb Blood Flow Metab. (2015) 35:623–9. doi: 10.1038/jcbfm.2014.237
19. Naganawa M, Nabulsi N, Planeta B, Gallezot J-D, Lin S-F, Najafzadeh S, et al. Tracer kinetic modeling of [ 11 C]AFM, a new PET imaging agent for the serotonin transporter. J Cereb Blood Flow Metab. (2013) 33:1886–96. doi: 10.1038/jcbfm.2013.134
20. Gallezot J-D, Nabulsi N, Neumeister A, Planeta-Wilson B, Williams WA, Singhal T, et al. Kinetic modeling of the serotonin 5-HT 1B receptor radioligand [ 11 C]P943 in humans. J Cereb Blood Flow Metab. (2010) 30:196–210. doi: 10.1038/jcbfm.2009.195
21. Golla SSV, Boellaard R, Oikonen V, Hoffmann A, van Berckel BNM, Windhorst AD, et al. Parametric binding images of the TSPO ligand 18F-DPA-714. J Nucl Med. (2016) 57:1543–7. doi: 10.2967/jnumed.116.173013
22. Arnold SE, Hyman BT, Flory J, Damasio AR, Van Hoesen GW. The topographical and neuroanatomic distribution of neurofibrillary tangles and neuritic plaques in the cerebral cortex of patients with Alzheimer's disease. Cereb Cortex. (1991) 1:103–16. doi: 10.1093/cercor/1.1.103
23. Bullich S, Barthel H, Koglin N, Becker GA, De Santi S, Jovalekic A, et al. Validation of non-invasive tracer kinetic analysis of 18 F-Florbetaben PET using a dual time-window acquisition protocol. J. Nucl. Med. (2017) 59:1104–10. doi: 10.2967/jnumed.117.200964
24. Heurling K, Buckley C, Van Laere K, Vandenberghe R, Lubberink M. Parametric imaging and quantitative analysis of the PET amyloid ligand [18 F]flutemetamol. Neuroimage. (2015) 121:184–92. doi: 10.1016/j.neuroimage.2015.07.037
25. Golla SSV, Verfaillie SCJ, Boellaard R, Adriaanse SM, Zwan MD, Schuit RC, et al. Quantification of [18 F] florbetapir : a test—retest tracer kinetic modelling study J Cereb Blood Flow Metab. (2018) 39:2172–80.
26. Resnick SM, Sojkova J, Zhou Y, An Y, Ye W, Holt DP, et al. Longitudinal cognitive decline is associated with fibrillar amyloid-beta measured by [11C]PiB. Neurology. (2010) 74:807–15. doi: 10.1212/WNL.0b013e3181d3e3e9
27. Rodriguez-Vieitez E, Carter SF, Chiotis K, Saint-Aubert L, Leuzy A, Scholl M, et al. Comparison of early-phase 11C-Deuterium-L-Deprenyl and 11C-Pittsburgh compound B PET for assessing brain perfusion in Alzheimer Disease. J Nucl Med. (2016) 57:1071–7. doi: 10.2967/jnumed.115.168732
28. Ikonomovic MD, Abrahamson EE, Price JC, Hamilton RL, Mathis CA, Paljug WR, et al. Early AD pathology in a [C-11]PiB-negative case: a PiB-amyloid imaging, biochemical, and immunohistochemical study. Acta Neuropathol. (2012) 123:433–47. doi: 10.1007/s00401-012-0943-2
29. McKhann GM, Knopman DS, Chertkow H, Hyman BT, Jack CR, Kawas CH, et al. The diagnosis of dementia due to Alzheimer's disease: recommendations from the National Institute on Aging-Alzheimer's Association workgroups on diagnostic guidelines for Alzheimer's disease. Alzheimer's Dement. (2011) 7:263–9. doi: 10.1016/j.jalz.2011.03.005
30. Petersen R, Doody R, Kurz A, Al E. Current concepts in mild cognitive impairment. Arch Neurol. (2001) 58:1985–92. doi: 10.1001/archneur.58.12.1985.
31. Ashburner J, Friston KJ. Unified segmentation. Neuroimage. (2005) 26:839–51. doi: 10.1016/j.neuroimage.2005.02.018
32. Hammers A, Allom R, Koepp MJ, Free SL, Myers R, Lemieux L, et al. Three-dimensional maximum probability atlas of the human brain, with particular reference to the temporal lobe. Hum Brain Mapp. (2003) 19:224–47. doi: 10.1002/hbm.10123
33. Joachim CL, Morris JH, Selkoe DJ. Diffuse senile plaques occur commonly in the cerebellum in Alzheimer's disease. Am. J. Pathol. (1989) 135:309–19. doi: 10.1097/00005072-198905000-00093
34. Price JC, Klunk WE, Lopresti BJ, Lu X, Hoge JA, Ziolko SK, et al. Kinetic modeling of amyloid binding in humans using PET imaging and Pittsburgh Compound-B. J Cereb Blood Flow Metab. (2005) 25:1528–47. doi: 10.1038/sj.jcbfm.9600146
35. Yamaguchi H, Hirai S, Morimatsu M, Shoji M, Nakazato Y. Diffuse type of senile plaques in the cerebellum of Alzheimer-type dementia demonstrated by β protein immunostain. Acta Neuropathol. (1989) 77:314–9. doi: 10.1007/BF00687584
36. Lopes Alves I, Vállez García DV, Parente A, Doorduin J, da Silva AMM, Koole M, et al. Parametric imaging of [11C]Flumazenil binding in the rat brain. Mol Imaging Biol. (2018) 20:114–23. doi: 10.1007/s11307-017-1098-2
37. R Core Team. R: A Language and Environment for Statistical Computing. Vienna: R Foundation for Statistical Computing (2017). Available online at: https://www.R-project.org/
38. Fodero-Tavoletti MT, Rowe CC, McLean CA, Leone L, Li Q-X, Masters CL, et al. Characterization of PiB binding to white matter in Alzheimer Disease and other dementias. J Nucl Med. (2009) 50:198–204. doi: 10.2967/jnumed.108.057984
Keywords: Alzheimer's disease, pharmacokinetic modeling, Pittsburgh compound B, SRTM, SRTM2
Citation: Peretti DE, Reesink FE, Doorduin J, de Jong BM, De Deyn PP, Dierckx RAJO, Boellaard R and Vállez García D (2019) Optimization of the Parameter Estimation for the Pharmacokinetic Modeling of Dynamic PIB PET Scans Using SRTM2. Front. Phys. 7:212. doi: 10.3389/fphy.2019.00212
Received: 06 August 2019; Accepted: 21 November 2019;
Published: 12 December 2019.
Edited by:
Ivo Rausch, Medical University of Vienna, AustriaReviewed by:
Barbara Katharina Geist, Medical University of Vienna, AustriaAnders Bertil Rodell, Aarhus University Hospital, Denmark
Copyright © 2019 Peretti, Reesink, Doorduin, de Jong, De Deyn, Dierckx, Boellaard and Vállez García. This is an open-access article distributed under the terms of the Creative Commons Attribution License (CC BY). The use, distribution or reproduction in other forums is permitted, provided the original author(s) and the copyright owner(s) are credited and that the original publication in this journal is cited, in accordance with accepted academic practice. No use, distribution or reproduction is permitted which does not comply with these terms.
*Correspondence: David Vállez García, ZC52YWxsZXotZ2FyY2lhQHVtY2cubmw=