
94% of researchers rate our articles as excellent or good
Learn more about the work of our research integrity team to safeguard the quality of each article we publish.
Find out more
REVIEW article
Front. Phys., 07 November 2019
Sec. Soft Matter Physics
Volume 7 - 2019 | https://doi.org/10.3389/fphy.2019.00176
This article is part of the Research TopicNon-local Modeling and Diverging Lengthscales in Structured FluidsView all 6 articles
Recent experiments show that the deformation properties of a wide range of solid materials are surprisingly similar. When slowly pushed, they deform via intermittent slips, similar to earthquakes. The statistics of these slips agree across vastly different structures and scales. A simple analytical model explains why this is the case. The model also predicts which statistical quantities are independent of the microscopic details (i.e., they are “universal”), and which ones are not. The model provides physical intuition for the deformation mechanism and new ways to organize experimental data. It also shows how to transfer results from one scale to another. The model predictions agree with experiments. The results are expected to be relevant for failure prediction, hazard prevention, and the design of next-generation materials.
Different types of solids can have vastly different structures at the microscopic scale. Their atoms may be arranged on a lattice, as in crystals, or sit in random positions, as in metallic glasses. At longer length scales, solids can comprise densely packed grains, powders, or porous structures (e.g., in the case of many rocks). Despite these widely different structures, it appears these solids have surprisingly similar deformation properties: under slow compression many deform via intermittent slips, similar to earthquakes. Most earthquakes are small, some are of intermediate size, and relatively few are large. Histograms of earthquake size follow the famous Gutenberg-Richter law, which is a simple power-law function that extends over many decades in size. Lab-scale solids behave in the same way. If you were to bend your fork and could listen to the acoustic emission, you would hear crackling noise, which is the manifestation of small slips in the metal [1–3]. Recent experiments on slowly compressed crystals showed that histograms of the slip sizes follow roughly the same Gutenberg-Richter power law as earthquakes with many other similar statistical properties [1–5]. The same is true for millimeter-scale bulk metallic glasses [5, 6], centimeter-scale rocks [5], and meter-scale granular materials [5, 7, 8]. Additionally in many solids such as these, the average slip size grows with the applied force or stress (which is force per area). As you push harder on the sample, the slips grow larger [3–5, 9, 10]. Again a related stress dependence is also reported for earthquakes [11] on faults at different stress levels.
The aforementioned observations suggest that a universality class may exist for solids that show intermittent discrete deformation events (often referred to as slips). Systems within a single universality class show the same slip statistics and dynamics, irrespective of the microscopic details. A number of deformation models [see for example [12–22] and references therein for an incomplete list] focus on the behavior near a yield point, often in the steady state and in the absence of shear bands. In this article, however, we review a particularly simple model that has predicted and explained observed similarities across scales [23] and that provides many predictions for the slip dynamics. The model does not require fitting parameters or operation in the steady state, and it allows for the formation of shear bands. This model has also shown agreement with experimental results for a number of materials [e.g., 4–10].
The premise of the model is that most solids have weak spots that are elastically coupled. Weak spots are regions that are prone to slipping. In crystals they are dislocations, and in glasses or granular materials they are zones where the atoms or grains are especially susceptible to slipping under shear. If a weak spot slips, it can trigger other weak spots to slip also, thereby resulting in a slip avalanche. If the deformation takes place sufficiently slowly, each avalanche is well-separated in time from the others [24, 25]. The model can be applied for either constant-displacement-rate or constant-force-rate conditions.
The model assumes each weak spot is stuck until the local force or stress exceeds a random threshold. For ductile materials [such as nanoscale single crystals [4]], the thresholds on average remain at a certain level, while for brittle materials (such as metallic glasses), the thresholds can be weakened locally by the slips [6, 23]. Whenever the local stress exceeds the local threshold stress, a weak spot slips by a random amount and subsequently re-sticks. The weak spots are coupled through long-range elastic interactions. Through these interactions, slipping weak spots trigger other weak spots to slip as well, creating a slip avalanche. In most experiments, the slips tend to localize along planes, shear bands, glide planes, or earthquake fault zones. Such a simple model is successful because using tools from the theory of phase transitions such as the renormalization group, one can show that in this case, the long-range interactions are so long range that mean-field theory, which assumes infinite-range interactions, gives the correct scaling behavior for the slip statistics [23, 26] on scales that are large compared to the microscopic details of the material. In short, the coarse-grained model is able to predict the universal, detail-independent avalanche statistics. The mean-field model can be solved analytically—and it provides a long list of predictions for the slip statistics and their dynamics. In the following, we first briefly review the model equations and predictions [23], and then show comparisons to recent experiments.
Details of the model equations are given, for example, in Dahmen et al. [23] and Fisher et al. [26] and the references therein. The discrete version is particularly simple. Modeling the slip plane with N lattice points, the local stress τl at a lattice point l is τl = (J/N) [Σm (um – ul)] + F [23]. Here F is the applied (shear) stress, and um is the accumulated local slip distance along the slip plane at site m. Each lattice site slips when the local stress exceeds the local failure (slip) stress τf, l = τs, l (or τd, l). Here τs, l is a static failure stress, and τd, l (τd, l < τs, l) is a weakened dynamic failure stress. A site can then slip by a random amount Δul resulting in a stress reduction τf, l – τa, l ~ 2G Δul where G ~J is the elastic shear modulus, and τa, l is the local random arrest stress or sticking stress, at which the site resticks. For zero weakening (i.e., weakening parameter ε = 0), the failure stress takes a static value τf, l = τs, l. For stress-controlled deformation starting from a relaxed (zero stress) state, the external stress F is increased, and the system approaches a “depinning transition” at the critical yield stress Fc, which has been studied previously in other contexts [4, 23]. For a fixed strain rate, the system operates near the critical stress [23, 26]. At finite weakening (with weakening parameter ε = (τs, l – τd, l)/(τs, l – τa, l) > 0) after a slip at the static failure stress τs, l, the slip stress is reduced to the lower dynamic threshold τf, l = τd, l and it remains at that reduced value until the ensuing slip avalanche is completed. Only afterward does it reheal to its static threshold stress τf, l = τs, l.
For the slow deformation of ductile solids, like copper, the model predicts broad distributions of slip avalanche sizes, following a power law distribution with a cutoff of a size that grows with applied stress up to a maximum value that is set by either the sample size or the work-hardening of the material [3, 4, 23]. For somewhat brittle materials, like bulk metallic glasses and rocks, and similarly also for densely packed granular materials, we assume that the slip thresholds are weakened upon slip (ε > 0) and in that case the model predicts “stick-slip” behavior, with small precursor slip avalanches and almost periodically recurring large slip avalanches that reach the boundaries of the sample [6, 23, 24].
In experiments, the slip-size distributions can be extracted from measurements of time series of the stress or strain or in some cases from acoustic emission or heat pulses. The emission experiments use sound waves or heat pulses to extract information about the size/energy and location of the slips [4, 5].
For ductile materials the model predictions can be used to extract the failure stress from the slip statistics measured at lower stresses. Figures 1, 2 illustrate the main idea. Figures 1A,B show images of a slowly compressed Nb nanopillar from an experiment conducted as shown in Figure 1D by Andrew Jennings and Julia Greer. Figure 1C shows the stress-strain curves obtained in this way [4]. Stress-drops reflect the slip avalanches. Figure 2 shows the fraction of slips larger than size S for different windows of stress. Clearly the average slip size increases as the failure stress is approached. The model predicts this trend as shown in the inset. The collapse of all slip distributions onto the predicted gray function was obtained by rescaling the curves at low stresses according to the model predictions. The material-specific failure stress was extracted by varying it until the curves collapsed.
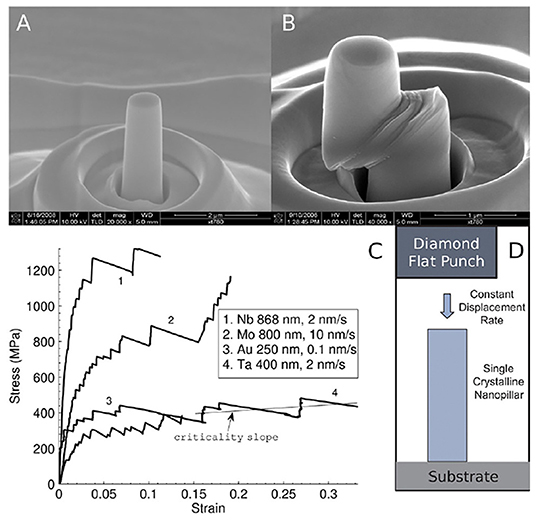
Figure 1. Nanopillar compression tests from Friedman et al. [4]. (A,B) Scanning electron micrographs of a 868-nm-diameter Nb pillar at 52° tilt, before, and after compression, respectively. (C) Stress-strain curves for increasing stress (each contains thousands of points) for four metals compressed at different displacement rates. Negatively sloped lines connect two points at the beginning and end of fast slips. The Nb stress-strain curve corresponds to the pillar in (A,B). (D) Schematic of the compression test methodology. For details, see [4] and references therein [Reprinted with permission from Friedman et al. [4] Copyright (2012) by the American Physical Society].
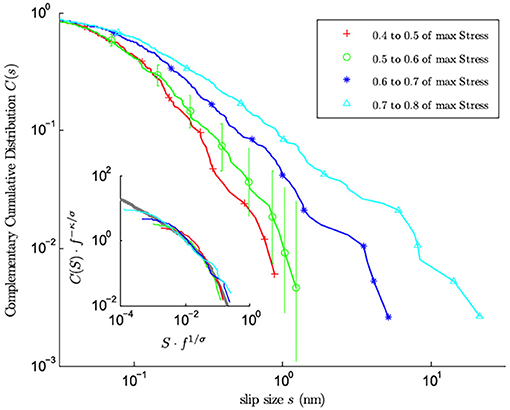
Figure 2. Stress-binned complementary cumulative distribution C(S) of slip sizes S for different bins of applied stress (note that “s” on the horizontal axis in the main figure represents the slip size denoted “S” in the inset and also in this review). The data was obtained from the compression of seven Mo nanopillars of approximate diameter 800 nm, compressed at a 0.1 nm/s nominal displacement rate. The inset shows a scaling collapse of the data using the mean-field model predictions κ = 1.5 and σ = 0.5 onto the predicted mean-field scaling function shown in gray. For details, see [4] and references therein [Reprinted with permission from Friedman et al. [4] Copyright (2012) by the American Physical Society].
The model has no intrinsic length scale nor any information about the material's microstructure. We therefore expect it to apply equally well to amorphous materials, such as bulk metallic glasses (BMGs), as to crystals. BMGs are metallic alloys with amorphous structure and excellent strength properties. Figure 3A shows an experimental setup for the compression of mm-sized BMG samples, and Figure 3B shows stress vs. time curves [6]. The inset shows the observed stick slip behavior that is consistent with the model predictions for brittle materials. In stick-slip, a random series of smaller slips precedes the roughly periodically recurring large slips that cut through the sample [6, 23, 24].
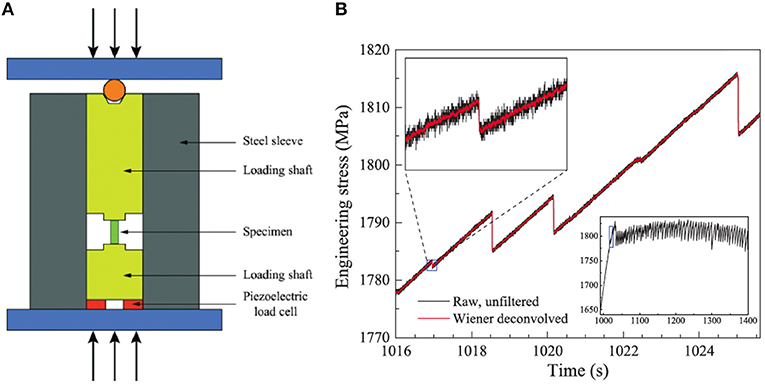
Figure 3. Experimental setup and stress drops. (A) Schematic diagram of the experimental setup. Two tungsten carbide platens that are constrained by a steel sleeve compress the metallic glass sample, see [6] and references therein for details. (B) Lower-right inset: applied stress vs. time. Main figure: magnification of the data in the small window in the lower-right inset. Slip avalanches manifest as sudden drops in applied stress for constant-displacement-rate testing. Upper-left inset is further magnification, showing one stress drop. Black curves indicate the raw, unfiltered stress-time series, and red curves indicate the time series after Wiener deconvolution (see [6] and references therein) [Reprinted with permission from Antonaglia et al. [6] Copyright (2014) by the American Physical Society].
This particular experiment was performed at exceptionally high time-resolution (100 kHz); a high data acquisition rate is required to conduct a detailed study of the dynamics of individual slips [6]. As predicted by the model, large and small slips have very different propagation modes: Figures 4A,B show that the small slips propagate in a very jerky way, i.e., intermittently with a fluctuating stress drop rate, while the large ones shown in Figure 5 have a smooth slip velocity–time profile, i.e., they zip through the sample in crack-like fashion. Figure 6 shows the rescaled average time profiles of the avalanches. In Figure 6A, the profiles are averaged over all avalanches rescaled to the same duration. Comparing the symmetric shape of the basic mean-field model to predictions of different model variants as shown in Figure 6B suggests that the slip dynamics are overdamped [6, 26, 28, 29].
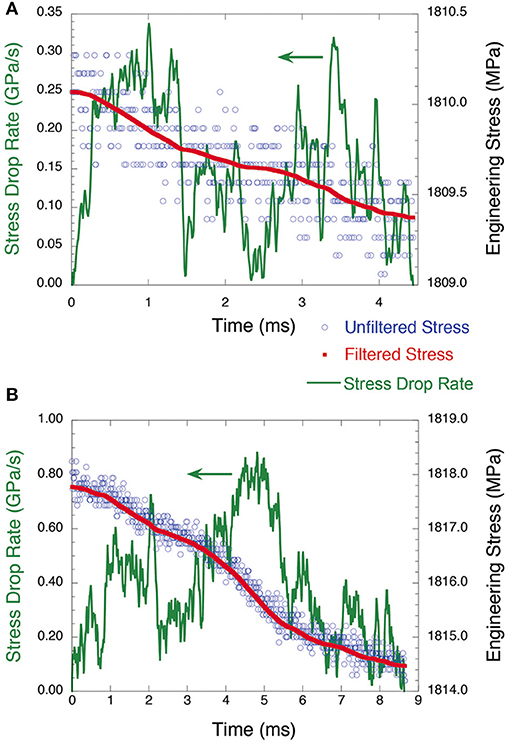
Figure 4. The stress drop rate Ṡ vs. time for a single avalanche in the small avalanche regime after Wiener filtering is performed. The unfiltered and Wiener-filtered data for stress vs. time are also shown. The axes scales are different for the plots. (A) This avalanche lasts ~4.4 ms with a stress drop size of 0.7 MPa and a maximum stress drop rate of 0.34 GPa/s. (B) This avalanche lasts ~8.6 ms with a stress drop size of 3.3 MPa and a maximum stress drop rate of 0.88 GPa/s [Reprinted from Wright et al. [27], with the permission of AIP Publishing].
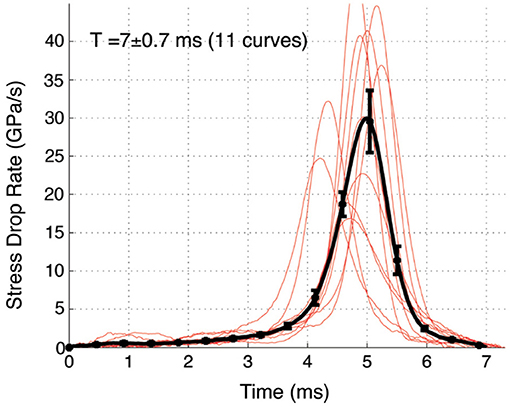
Figure 5. The individual avalanche profiles (in red) as well as the averaged profile (in black) of those “large” avalanches within the bin 7 – 0.7 ms ≤ T ≤ 7 + 0.7 ms and S ≥ 10 MPa, i.e., avalanches with duration of 7 ms ± 0.7 ms in the large avalanche regime [Reprinted from Wright et al. [27], with the permission of AIP Publishing].
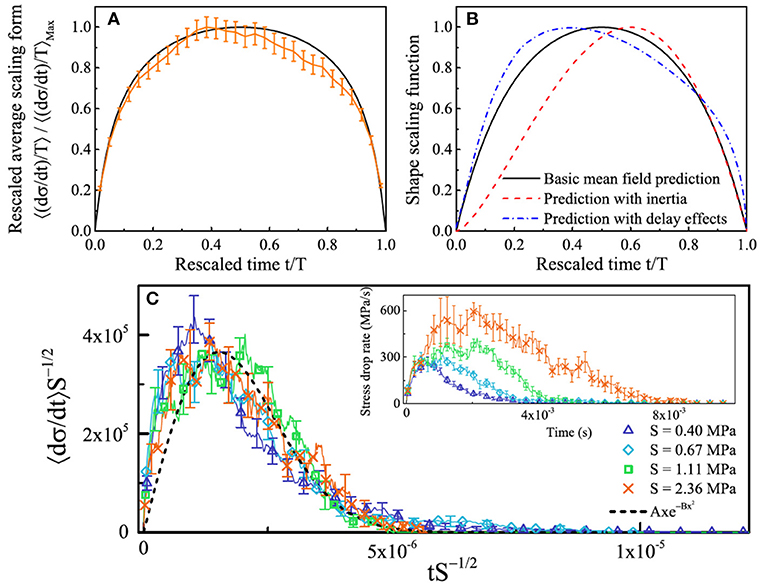
Figure 6. Average avalanche profiles of “small” avalanches. (A) Orange curve: Stress-drop rate profiles divided by duration T averaged over all small avalanches in the scaling regime. The model prediction is shown by the black curve. (B) Model predictions for average avalanche profiles for different model assumptions. (C) Inset shows the unscaled average stress-drop rate profiles for different stress-drop sizes S, collapsed in the main figure (scaling both axes by a factor of S−1/2). The main figure shows the agreement of the collapse with the predicted collapse scaling function (black curve, for non-universal values of the constants A = 3.98 × 10¹¹ and B = 2.18 × 10¹¹) [Reprinted with permission from Antonaglia et al. [6] Copyright (2014) by the American Physical Society].
Figure 6C shows that the average time profiles of different-size small avalanches are simple rescalings of each other, as one expects for avalanches that are distributed according to a power law. Using the model predictions, they can be collapsed onto the predicted time profile, as shown in the main figure. The agreement with the model predictions is remarkable.
Similar scaling has been found for experiments at different stresses and strain-rates [10]. Many more predictions about both the statistics and the dynamics of these avalanches can be tested in experiments. Thus, far about 15 different statistical predictions have been tested and found to agree with the behavior in experiments on BMGs [6, 10, 27]. Many more predictions will be tested in future experiments. Since the model predictions agree with the deformation properties of nanocrystals and BMGs on very different scales, there is no reason why it should not also apply at even larger scales. Figure 7 illustrates the size scales of samples of single-crystal nano- and micro-pillars, mm-scale bulk metallic glasses (amorphous), cm-scale rocks (polycrystalline), m-scale granular materials (amorphous) [4, 5, 7–9, 19, 30, 31], and earthquakes on faults that may span up to hundreds of kilometers in length [5]. Figure 8 demonstrates that for all of these different materials, the slip-size distributions obtained at different values of the applied stresses can be collapsed on top of each other and onto a scaling function predicted by the model. The collapse was obtained by rescaling the distributions according to the predicted mean-field scaling forms.
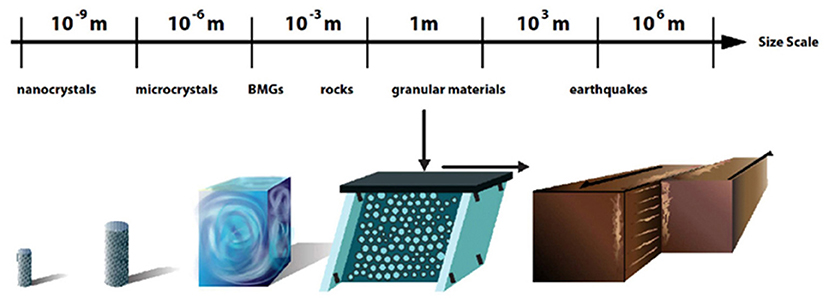
Figure 7. Sketch of size scales of samples showing the same slip avalanche statistics and spanning 12–13 decades in length [Reprinted from Uhl et al. [5] licensed under http://creativecommons.org/licenses/by/4.0/].
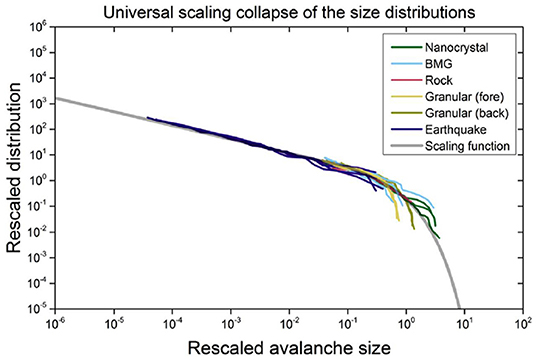
Figure 8. Scaling collapse of the slip statistics (size CCDF) from different stress-windows of five different materials on scales spanning 12 decades in length, onto each other and onto the predicted scaling function of the mean-field model (see [5] and references therein for details) [Reprinted from Uhl et al. [5] licensed under http://creativecommons.org/licenses/by/4.0/].
Similar agreement with the model predictions has been observed in ferroelastics with twin boundaries [32], and for the motion of magnetic domain walls in soft magnets [32–35]. Related results were also found for porous materials [36], neurons [37] and even flickering stars [38]. Regrettably space limitations in this brief review prevent the discussion of many other recent models, e.g., those that focus on the deformation of amorphous materials in the absence of shear localization. The goal here is to highlight a particularly simple model that provides intuition and is useful for organizing experimental data and appears consistent with observations in a wide range of experimental systems (Note that in some experiments machine oscillations can skew the experimental results [39]).
Tools from the theory of phase transitions, such as the renormalization group [35], can be used to coarse grain the system to scales that are large compared to the microscopic details. On these scales the dynamics are given by slip avalanches of coupled weak spots. The model described here, as well as models for a wide range of different materials, flow to the same fixed point under this coarse-graining transformation [23, 26]. This fixed point is responsible for the observed universal scaling behavior of the slip avalanche size distributions. The renormalization group thus renders a mathematical explanation for why a simple mean-field model for coupled weak spots with failure thresholds can explain the agreement across scales and material structures [5, 23], on scales that are large compared to the microscopic details.
These results tell us that simple models are useful for describing far-from-equilibrium avalanche statistics and dynamics. In fact, the parameter range where critical scaling is seen is often much larger in far-from equilibrium systems than in typical equilibrium systems. In plasticity the power-law slip-size distributions are often observed over a wide range of stresses and strain rates. For both science and engineering, many important insights and applications may emerge from these results:
• We have already seen that the noise created by the slips at low stresses contains information about the stress at which the material will break.
• The simple model provides intuition for the deformation process. It describes material failure as a non-equilibrium phase transition, and identifies the relevant tuning parameters, such as stress and strain-rate, that affect the size of the largest slip avalanches [10, 23, 26].
• The model predictions for universal behavior can be used to transfer results from one materials study to another and from one scale to another. Thus, the model tells us how to use laboratory experiments on bulk metallic glasses to interpret the slip statistics and dynamics in granular materials and even earthquakes.
• The model tells us how to organize experimental data. It predicts which quantities are expected to be the same for different materials and on different scales and which ones are not. For example, the scaling exponents and collapse functions are predicted to be the same for many different material structures and scales, while the exact value of the failure stress should depend on the microscopic details, and thus be material specific.
• The model predicts how the statistical properties of the slip avalanches are related. For example it gives exponent relations that predict how the scaling behavior of the slip-size distributions, the slip-duration distributions, and the power spectra of acoustic emission during the deformation are related. Knowledge about these connections is useful for comparing experiments that use different experimental measurement methods. For example, the model enables us to predict the scaling behavior obtained from acoustic emission experiments from stress drop measurements and vice versa.
• The model provides an understanding of the deformation mechanism from the slip statistics and the slip dynamics. It can be used to predict whether inertia or frictional delay effects play a significant role during the propagation of the slips. For example, comparison of the experiments on bulk metallic glasses with the predictions suggests that the slips in the shear bands do not have frictional delay effects [6].
• Potential deviations from the mean-field predictions that may be discovered in future experiments can be used to provide new insights into differences between avalanche dynamics in various contexts. For example, neuron firing avalanches in the brain have different slip statistics than the slip avalanches in solid materials, even though both result from coupled threshold processes. The reason is that in the brain the individual cells are coupled through a complicated network that affects the scaling behavior of the avalanche statistics [37].
• Similar modeling ideas and data analysis tools can be applied to many other systems with avalanches, including magnetic materials, neuron firing avalanches in the brain, decision making processes, sociological conflicts, imbibition, fracture front propagation, ferroelastics, power-grid failures, and maybe even the stock-market [35].
KD and JU wrote the first draft of the manuscript. All authors contributed to manuscript revision, read, and approved the submitted version.
KD gratefully acknowledges support from the National Science Foundation (NSF) DMR 10-05209, NSF CBET 13-36634, PHY11-25915, MGA, and the Aspen Center for Physics. WW thanks NSF DMR 1042734 and the Heinemann Family Professorship at Bucknell University. KD and WW thank the Kavli Institute for Theoretical Physics (KITP) (NSF PHY17-48958).
The authors declare that the research was conducted in the absence of any commercial or financial relationships that could be construed as a potential conflict of interest.
Many people have contributed to this perspective; we especially thank the scientists who kindly shared their experimental and observational data with us: Thorsten Becker, Robert Behringer, Rachel Byer, Dmitry Denisov, Georg Dresen, Thomas Goebel, Julia Greer, Xiaojun Gu, Todd Hufnagel, Andrew Jennings, Ju-Young Kim, Peter Liaw, K. A. Lörincz, Robert Maaß, Junwei Qiao, Steven Robare, Peter Schall, Danijel Schorlemmer, Molei Tao, Katherine Van Ness, Xie Xie, Jien-Wei Yeh, Yong Zhang, and Jien-Min Zuo, and the students who analyzed the data and compared them to model predictions, including James Antonaglia, Braden Brinkman, Nir Friedman, Michael LeBlanc, Xin Liu, Yun Liu, Aya Nawano, Shivesh Pathak, Ryan Swindeman, Gregory Schwarz, Li Shu, Georgios Tsekenis, and Matthew Wraith. We also thank Jim Wolfe for very helpful comments.
1. Miguel M-C, Vespignani A, Zapperi S, Weiss J, Grasso J-R. Intermittent dislocation flow in viscoplastic deformation. Nature. (2001) 410:667–71. doi: 10.1038/35070524
2. Dimiduk DM, Woodward C, LeSar R, Uchic MD. Scale-free intermittent flow in crystal plasticity, Science. (2006) 312:1188–90. doi: 10.1126/science.1123889
3. Zaiser M. Scale invariance in plastic flow of crystalline solids. Adv Phys. (2006) 55:185–245. doi: 10.1080/00018730600583514
4. Friedman N, Jennings AT, Tsekenis G, Kim J-Y, Tao M, Uhl JT, et al. Statistics of dislocation slip avalanches in nanosized single crystals show tuned critical behavior predicted by a simple mean field model. Phys Rev Lett. (2012) 109:095507. doi: 10.1103/PhysRevLett.109.095507
5. Uhl JT, Pathak S, Schorlemmer D, Liu X, Swindeman R, Brinkman BAW, et al. Universal quake statistics: from compressed nanocrystals to earthquakes. Sci Rep. (2015) 5:16493. doi: 10.1038/srep16493
6. Antonaglia J, Wright WJ, Gu XJ, Byer RR, Hufnagel TC, LeBlanc M, et al. Bulk metallic glasses deform via slip avalanches. Phys Rev Lett. (2014) 112:155501. doi: 10.1103/PhysRevLett.112.155501
7. Denisov DV, Lörincz KA, Wright WJ, Hufnagel TC, Nawano A, Gu XJ, et al. Universal slip dynamics in metallic glasses and granular matter – linking frictional weakening with inertial effects. Sci Rep. (2017) 7:43376. doi: 10.1038/srep43376
8. Denisov DV, Lörincz KA, Uhl JT, Dahmen KA, Schall P. Universality of slip avalanches in flowing granular matter. Nat Commun. (2016) 7:10641. doi: 10.1038/ncomms10641
9. Wright WJ, Long AA, Gu XJ, Liu X, Hufnagel TC, Dahmen KA. Slip statistics for a bulk metallic glass composite reflects its ductility. J Appl Phys. (2018) 124:185101. doi: 10.1063/1.5051723
10. Antonaglia J, Xie X, Schwarz G, Wraith M, Qiao J, Zhang Y, et al. Tuned critical avalanche scaling in bulk metallic glasses. Sci Rep. (2014) 4:4382. doi: 10.1038/srep04382
11. Schorlemmer D, Wiemer S, Wyss M. Variations in earthquake-size distribution across different stress regimes. Nature. (2005) 437:539–42. doi: 10.1038/nature04094
12. Hess S, Kröger M. Elastic and plastic behavior of model solids. Technische Mechanik. (2002) 22:79–88. doi: 10.3929/ethz-a-010678022
13. Maloney CE, Lemaître A. Amorphous systems in athermal, quasistatic shear. Phys Rev E. (2006) 74:016118. doi: 10.1103/PhysRevE.74.016118
14. Bouchbinder E, Langer JS, Procaccia I. Athermal shear-transformation-zone theory of amorphous plastic deformation. I. Basic principles. Phys Rev E. (2007) 75:036107. doi: 10.1103/PhysRevE.75.036107
15. Dasgupta R, Hentschel HGE, Procaccia I. Microscopic mechanism of shear bands in amorphous solids. Phys Rev Lett. (2012) 109:255502. doi: 10.1103/PhysRevLett.109.255502
16. Salerno KM, Maloney CE, Robbins MO. Avalanches in strained amorphous solids: does inertia destroy critical behavior? Phys Rev Lett. (2012) 109:105703. doi: 10.1103/PhysRevLett.109.105703
17. Lin J, Lerner E, Rosso A, Wyart M. Scaling description of the yielding transition in soft amorphous solids at zero temperature. Proc Natl Acad Sci USA. (2014) 111:14382–7. doi: 10.1073/pnas.1406391111
18. Salerno KM, Robbins MO. Effect of inertia on sheared disordered solids: critical scaling of avalanches in two and three dimensions. Phys Rev E. (2013) 88:062206. doi: 10.1103/PhysRevE.88.062206
19. Barés J, Wang D, Wang D, Bertrand T, O'Hern CS, Behringer RP. Local and global avalanches in a two-dimensional sheared granular medium. Phys Rev E. (2017) 96:052902 doi: 10.1103/PhysRevE.96.052902
20. Sethna JP, Bierbaum MK, Dahmen KA, Goodrich CP, Greer JR, Hayden LX, et al. Deformation of crystals: connections with statistical physics. Annu Rev Mater Res. (2017) 47:217–46. doi: 10.1146/annurev-matsci-070115-032036
21. Clark AH, Thompson JD, Shattuck MD, Ouellette NT, O'Hern CS. Critical scaling near the yielding transition in granular media. Phys Rev E. (2018) 97:062901. doi: 10.1103/PhysRevE.97.062901
22. Thompson JD, Clark AH. Critical scaling for yield is independent of distance to isostaticity. Phys Rev Res. (2019) 1:012002(R). doi: 10.1103/PhysRevResearch.1.012002
23. Dahmen KA, Ben-Zion Y, Uhl JT. Micromechanical model for deformation in solids with universal predictions for stress-strain curves and slip avalanches. Phys Rev Lett. (2009) 102:175501. doi: 10.1103/PhysRevLett.102.175501
24. McFaul LW, Wright WJ, Gu XJ, Uhl JT, Dahmen KA. Aftershocks in slowly compressed bulk metallic glasses: experiments and theory. Phys Rev E. (2018) 97:063005. doi: 10.1103/PhysRevE.97.063005
25. LeBlanc M, Nawano A, Wright WJ, Gu XJ, Uhl JT, Dahmen KA. Avalanche statistics from data with low time resolution. Phys Rev E. (2016) 94:051235. doi: 10.1103/PhysRevE.94.052135
26. Fisher DS, Dahmen K, Ramanathan S, Ben-Zion Y. Statistics of earthquakes in simple models of heterogeneous faults. Phys Rev Lett. (1997) 78:4885. doi: 10.1103/PhysRevLett.78.4885
27. Wright WJ, Liu Y, Gu XJ, Van Ness KD, Robare SL, Liu X, et al. Experimental evidence for both progressive and simultaneous shear during quasistatic compression of a bulk metallic glass. J Appl Phys. (2016) 119:084908. doi: 10.1063/1.4942004
28. Zapperi S, Castellano C, Colaiori F, Durin G. Signature of effective mass in crackling-noise asymmetry. Nat Phys. (2005) 1:46. doi: 10.1038/nphys101
29. Baldassarri A, Colaiori F, Castellano C. Average shape of a fluctuation: universality in excursions of stochastic processes. Phys Rev Lett. (2003) 90:060601. doi: 10.1103/PhysRevLett.90.060601
30. Dahmen KA, Ben-Zion Y, Uhl JT. A simple analytic theory for the statistics of avalanches in sheared granular materials. Nat Phys. (2011) 7:554–57. doi: 10.1038/nphys1957
31. Long AA, Denisov DV, Schall P, Hufnagel TC, Gu XJ, Wright WJ, et al. From critical behavior to catastrophic runaways: comparing sheared granular materials with bulk metallic glasses. Granular Matter. (2019) 21:99. doi: 10.1007/s10035-019-0946-y
32. Salje EKH, Dahmen KA. Crackling noise in disordered materials. Ann Rev Cond Mat Phys. (2014) 5:233–54. doi: 10.1146/annurev-conmatphys-031113-133838
33. Papanikolaou S, Bohn F, Sommer RL, Durin G, Zapperi S, Sethna JP. Universality beyond power laws and the average avalanche shape. Nat Phys. (2011) 7:316–20. doi: 10.1038/nphys1884
34. Durin G, Zapperi S. Chapter 3 - The Barkhausen effect. In: Bertotti G, Mayergoyz ID, editors. The Science of Hysteresis. Vol. 2. Amsterdam: Academic Press (2005). p. 181–267. doi: 10.1016/B978-012480874-4/50014-2
35. Sethna JP, Dahmen KA, Myers CR. Crackling noise. Nature. (2001) 410:242–50. doi: 10.1038/35065675
36. Baró J, Corral A, Illa X, Planes A, Salje EKH, Schranz W, et al. Statistical similarity between the compression of a porous material and earthquakes. Phys Rev Lett. (2013) 110:088702. doi: 10.1103/PhysRevLett.110.088702
37. Friedman N, Ito S, Brinkman BAW, Shimono M, DeVille RE, Dahmen KA, et al. Universal critical dynamics in high resolution neuronal avalanche data. Phys Rev Lett. (2012) 108:208102. doi: 10.1103/PhysRevLett.108.208102
38. Sheikh MA, Weaver RL, Dahmen KA. Avalanche statistics identify intrinsic stellar processes near criticality in KIC 8462852. Phys Rev Lett. (2016) 117:261101. doi: 10.1103/PhysRevLett.117.261101
Keywords: avalanches, critical point, deformation, mean field, metallic glass, scaling, shear bands, universality
Citation: Dahmen KA, Uhl JT and Wright WJ (2019) Why the Crackling Deformations of Single Crystals, Metallic Glasses, Rock, Granular Materials, and the Earth's Crust Are So Surprisingly Similar. Front. Phys. 7:176. doi: 10.3389/fphy.2019.00176
Received: 02 July 2019; Accepted: 18 October 2019;
Published: 07 November 2019.
Edited by:
Abram H. Clark, Naval Postgraduate School, United StatesReviewed by:
Martin Kröger, ETH Zürich, SwitzerlandCopyright © 2019 Dahmen, Uhl and Wright. This is an open-access article distributed under the terms of the Creative Commons Attribution License (CC BY). The use, distribution or reproduction in other forums is permitted, provided the original author(s) and the copyright owner(s) are credited and that the original publication in this journal is cited, in accordance with accepted academic practice. No use, distribution or reproduction is permitted which does not comply with these terms.
*Correspondence: Karin A. Dahmen, ZGFobWVuQGlsbGlub2lzLmVkdQ==
Disclaimer: All claims expressed in this article are solely those of the authors and do not necessarily represent those of their affiliated organizations, or those of the publisher, the editors and the reviewers. Any product that may be evaluated in this article or claim that may be made by its manufacturer is not guaranteed or endorsed by the publisher.
Research integrity at Frontiers

Learn more about the work of our research integrity team to safeguard the quality of each article we publish.