- 1Department of Medicine, University of British Columbia, Vancouver, BC, Canada
- 2Department of Radiology, University of British Columbia, Vancouver, BC, Canada
- 3Brain Behaviour Lab, Department of Physical Therapy, University of British Columbia, Vancouver, BC, Canada
- 4Department of Pathology and Laboratory Medicine, University of British Columbia, Vancouver, BC, Canada
- 5International Collaboration on Repair Discoveries, University of British Columbia, Vancouver, BC, Canada
- 6Department of Physics and Astronomy, University of British Columbia, Vancouver, BC, Canada
- 7Department of Pediatrics, University of British Columbia, Vancouver, BC, Canada
- 8Division of Neurology, Department of Medicine, University of British Columbia, Vancouver, BC, Canada
Demyelination can be assessed structurally by magnetic resonance imaging (MRI) and functionally with transcranial magnetic stimulation (TMS). Here, we combined these techniques to investigate demyelination of the corpus callosum in multiple sclerosis (MS). Our objective was to determine if corpus callosal demyelination impacts transcallosal inhibition (TCI). TCI is a brief suppression of voluntary activity in the primary motor cortex elicited by stimulation of the homologous region of the contralateral hemisphere, which is assumed to be transmitted via the corpus callosum. MRI and TMS were performed in 26 participants with MS and 10 controls. Myelin water fraction (MWF) was measured in five regions of the corpus callosum and compared with the onset latency, duration, and depth of TCI as measured by electromyography at the forearm. Callosal MWF was greatest posteriorly compared to other regions of the corpus callosum. Lower MWF in MS compared to controls was more pronounced in the posterior corpus callosum. MS participants had a prolonged TCI duration (p = 0.016), which correlated with EDSS (p = 0.020) and disease duration (p = 0.045). In MS, TCI depth correlated negatively with the MWF of the posterior callosal midbody (p = 0.039), a region thought to mediate TCI transmission. In summary, TCI duration was increased in MS and demyelination of the posterior corpus callosum midbody was associated with measurable functional changes. This work demonstrates the potential for combining MRI and TMS with electromyography to draw insights about structure-function relationships in MS pathophysiology.
Introduction
Multiple sclerosis (MS) is a central nervous system (CNS) disease characterized by demyelination in focal lesions and normal appearing white matter (NAWM). In vivo assessment of myelin loss in MS can be ascertained with magnetic resonance imaging (MRI) by using myelin water imaging. The principles of myelin water imaging are based on the fact that in CNS tissue the MR signal decay due to T2 relaxation follows a multi-exponential time course. Non-negative least squares methods can fit the T2 decay curve to a sum of exponential components [1], which arise from water in different environments. The myelin water fraction (MWF) is the signal fraction with short T2 times (10–40 ms) arising from water trapped between myelin bilayers and has been validated as a marker for myelin in CNS tissue [2–7]. MWF may be employed to quantitatively monitor demyelination in MS [8, 9]. Lesions demonstrate heterogeneously decreased MWF and NAWM MWF is ~16% lower on average in individuals with MS than in controls [8].
An alternate approach for investigating CNS damage in MS employs transcranial magnetic stimulation (TMS). TMS has been utilized to non-invasively investigate cortical excitability, functional connectivity, and underlying white matter tract integrity in humans in vivo [10]. TMS applied over the motor cortex (M1) generates motor evoked potentials (MEPs) in contralateral musculature via the corticospinal tract. The magnitude of transcallosally-mediated inhibition between homologous M1 representations can also be interrogated with TMS. When TMS is applied over M1 during a volitional contraction of a muscle ipsilateral to the side of stimulation, a transient inhibition of muscle activity is observed due to transcallosally-mediated inhibition [11, 12]. The degree of inhibition is represented by the magnitude of suppression of activity in the electromyogram (EMG) of the ipsilateral muscle, termed the ipsilateral silent period (iSP) [13]. Longer durations of the iSP and/or greater EMG suppression during the iSP represent larger degrees of transcallosally-mediated inhibition measured with TMS. In previous work, individuals with MS displayed delayed onset and prolonged duration, but similar depth of inhibition on average, when compared with healthy controls [14, 15]. iSP onset and duration correlate with the total area of MS lesions in the CC [16], and an absence of an iSP has been observed in individuals with lesions in the CC arising from infarcts and other abnormalities [13, 17].
Used together, MWF imaging and TMS-evoked EMG responses have the potential to provide complementary information about the structure-function relationship in brain white matter. Other MRI techniques such as diffusion tensor imaging, in conjunction with TCI, have uncovered potential relationships between functional connectivity and white matter fibre microstructure in healthy adults [18]. However, DTI does not provide a specific measure of myelin content as it is influenced by crossing fibres (although, this may be less of an issue in the CC) and the presence of MS pathology such as oedema or inflammation [19, 20]. MWF, as a myelin-specific imaging marker, has the potential to enable demonstration of the impact of diffuse demyelination on the functional connectivity of transcallosal fibres as measured by TCI. We hypothesized that localized MWF changes in the corpus callosum would be correlated with TCI, especially onset latency and duration. In this exploratory study, we sought to characterize the relationship between CC MWF and TCI to examine whether the joint use of imaging and functional studies could help inform CC function.
Materials and Methods
Study Participants
Twenty-six individuals with relapsing remitting MS (RRMS), ages 28–59 years (mean age 42.0 years, 5 males/21 females), were included in the study, as well as 10 healthy controls recruited from the university community (mean age 43.4 years, 2 males/8 females). The MS cohort had an Kurtzke Expanded Disability Status Scale (EDSS) [21] range of 0.0–6.0 (median: 2.0) and a disease duration of 0.5–28 years (mean: 7.54 years) (Figure 1). All MS participants were on glatiramer acetate (GA, Copaxone®) treatment at the time of testing, and had previously been prescribed GA treatment for 0–4.5 years (mean length of time on GA = 1.15 years). All study participants provided written informed consent and all study procedures were approved by the University of British Columbia Clinical Ethics Research Board (H09-01938).
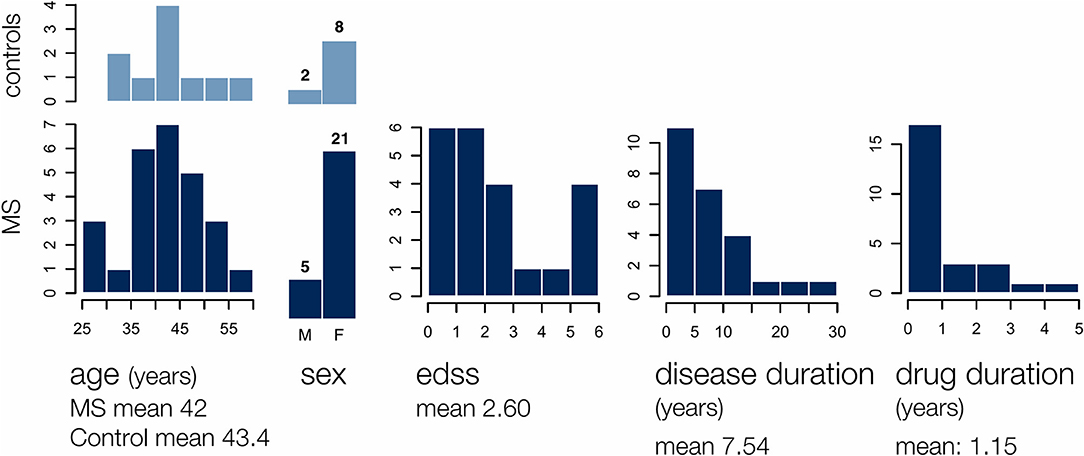
Figure 1. The MS group participants included 5 males and 21 females of age 28–59 years, with an EDSS range of 0–6, a disease duration of 0.5–28 years, and a glatiramer acetate use duration of 0–5 years. Demographics for 10 age and gender matched controls are also shown.
Magnetic Resonance Imaging Protocol and Analysis
MRI Acquisition
MRI scans were performed on a Philips 3.0 T Achieva scanner with an 8 channel head coil to collect the following sequences: (1) axial 3DT1-weighted turbo field echo (TR: 1,638 ms, TE: 3.5 ms, TI: 850 ms, voxel: 1.00 × 1.00 × 1.00 mm), (2) sagittal 3D combined gradient echo and spin echo (GRASE) [22, 23] (TR: 1,000 ms, echo spacing: 10 ms, 32 spin echoes with a gradient echo immediately before and another immediately after, voxel acquired at 0.99 × 1.01 × 5.00 mm, reconstructed to 0.96 × 0.96 × 2.5 mm, sense factor 2), and (3) sagittal 3D turbo spin echo double inversion recovery [TR: 8,000 ms, TEeff: 156 ms, TI: 3,200/500 ms, voxel acquired at 1.00 × 1.00 × 2.00 mm, reconstructed to 1.00 × 1.00 × 1.00 mm, sense factor 2.5 (phase) and 2 (slice)].
Image Registration
Registration was performed using the software tools provided by The Oxford Centre for Functional Magnetic Resonance Imaging of the Brain (FMRIB), the FMRIB Software Library (FSL) [24, 25]. 3DT1 images of each subject were registered to T2 GRASE images using FMRIB's Linear Image Registration Tool (FLIRT) to allow delineation of the CC for region of interest (ROI) selection.
Calculation and Mapping of Myelin Water Fraction
The T2 decay curve obtained by the T2 GRASE sequence was modelled by multiple exponential components and the T2 distribution was estimated using non-negative least squares with the extended phase graph algorithm [22] applied in order to account for the effect of stimulated echo artefact on the decay curves. MWF in each image voxel was computed as the ratio of the area under the T2 distribution between 10 and 40 ms to the total area under the distribution [1, 22].
Region of Interest Analysis
The CC was defined in the sagittal plane of registered images by manually selected ROIs with a minimum lateral width of 7 mm (central slice + 3 mm in each direction from the midline). MWF values were averaged over the whole CC, as well as in five anterior to posterior fractions defined slice-wise based on the scheme proposed by Hofer and Frahm [26] (Figure 2). This segmentation scheme provides regions roughly in agreement with more recent work [27] while unambiguously delineating segments along the maximum-length anterior-posterior (A-P). A single unblinded rater drew all ROIs. For quality assurance checks, automated segmentation was also undertaken and MWF values were compared to rule out significant discrepancies. This allowed us to ensure that MWF mean values would not change dramatically with slightly different ROIs and mitigated the risk of bias. Automated segmentation of the CC was performed by registration of the JHU ICBM atlas CC region in FSL [28–30]. T2 GRASE images were registered onto 3DT1 images and masks obtained by automated segmentation were applied to MWF maps co-registered using the same registration matrix.
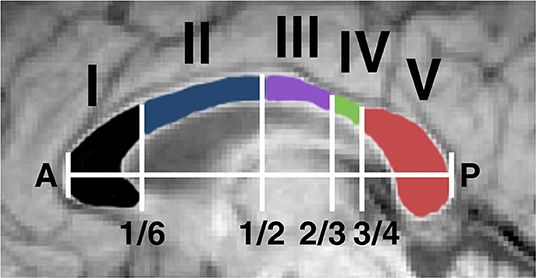
Figure 2. The corpus callosum was segmented into structurally distinct regions for analysis of regional myelin water fraction. This was performed by an automated system which identified a maximum length anterior-posterior (AP) line and selected segments based on fractional AP position. The segments have been shown to contain fibres connecting (I) prefrontal, (II) premotor and supplementary motor, (III) motor, (IV) sensory, and (V) parietal, temporal, and occipital regions [26].
Obtaining an Anterior-to-Posterior CC MWF Distribution
Within the CC, MWF was averaged across all vertical voxel-thick strips in each sagittal slice and interpolated linearly to 100 values between the anterior and posterior ends. These 100 values per slice were averaged across slices, yielding an anterior-to-posterior MWF distribution for each individual. These distributions were then averaged across all participants with MS and controls separately and a 95% confidence interval was calculated for each point.
Transcranial Magnetic Stimulation Protocol and Analysis
Transcranial Magnetic Stimulation
TMS was performed using a figure-of-eight coil attached to a Magstim 2002 stimulator targeting the motor cortex representation of the contra-lateral forearm extensor musculature. Recording electrodes for EMG were placed on the extensor carpi radialis (ECR) muscle bilaterally with the ground electrode on the olecranon process of the elbow. The optimal site for TMS activation of the ECR was determined using standard procedures [31]. The motor threshold was defined as the lowest stimulation intensity that elicited a motor response in ECR of ≥50 μV in 5 of 10 trials [32]. Participants were asked to perform a voluntary contraction to 20% of their maximal force using an isometric hand dynamometer. TMS stimulus intensity was adjusted to 1.5 times the threshold for evoking a motor response or to maximum output if the threshold exceeded 66% of the maximum stimulator output. Study participants performed an isometric grip contraction using the hand ipsilateral to the stimulated hemisphere. Transient inhibition in voluntary EMG activity was used to quantify the iSP. The stimulation protocol was performed bilaterally starting with a randomly selected side.
Ipsilateral Silent Period Identification
EMG data was averaged across 20 trials per participant per hemisphere to achieve a satisfactory signal-to-noise ratio. Automated detection located the minimum point in the EMG data between 15 and 90 ms after the TMS stimulus, within the physiological range of TCI times. It then located the onset (start) and offset (end) times of the iSP as the nearest points above the pre-stimulus mean on either side of the minimum (Figure 3). Where adjustment of the automated selection was required or the iSP was absent, traces were reviewed in detail by at least two researchers. iSP duration was calculated as the difference between offset and onset times. The inhibition depth was calculated by subtracting the mean iSP amplitude from the mean iSP pre-stimulus amplitude.
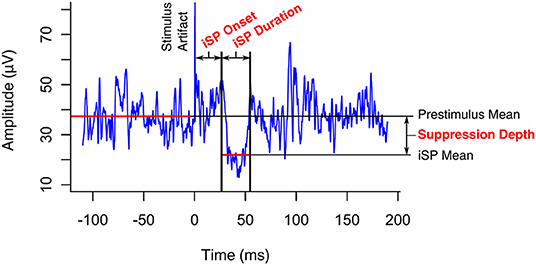
Figure 3. Transcallosal inhibition (TCI) of voluntary hand contraction was elicited by transcranial magnetic stimulation of the ipsilateral motor representation of the hand. The ipsilateral silent period (iSP) was identified on the resulting electromyogram as a transient inhibition of voluntary activity and its onset, duration, and depth were quantified as shown.
Analysis of Myelin Water and TCI Data
Treatment of Non-normally Distributed Data
Non-normality in data was identified visually by histograms and quantile-quantile (Q-Q) plots. Shapiro-Wilk tests with a Holm-Bonferroni [33] adjusted p < 0.05 were taken as further evidence of non-normality. All CC MWF and TCI measures (onset, duration, and depth) yielded normally distributed data with the exception of inhibition depth (Supplemental Figure 1). Thus, for subsequent parametric analyses, inhibition depth values were subject to a power transform. The Box-Cox method identified the value of the optimal power parameter, λ, to be zero [34]. Therefore, the transform yi = GM(y) ln yi was applied, where is the geometric mean of the set of observations {y1…yn}. This resulted in normally distributed data and is referred to here as the transformed inhibition depth.
Independent MRI and TMS Analysis
Myelin water maps and TCI data were analysed independently to identify differences between stimulated hemisphere (left vs. right), study groups (MS vs. control), and CC regions (I–V).
MWF values obtained from manual CC selection were compared with values obtained by automated segmentation using a paired t-test. Paired t-tests were performed to assess differences in TCI between hemispheres. Two-tailed homoscedastic student's t-tests with a Holm-Bonferroni correction were performed to test for differences in MWF and TCI quantifiers between MS and controls. One-way ANOVA was employed to compare mean MWF among the CC regions and Tukey's range test was performed for pairwise comparisons with adjusted significance thresholds.
This analysis was visualized using standard boxplots displaying means, quartiles, and outliers. p-values were reported and values below 0.05 were taken to be statistically significant. All reported margins of error represent 95% confidence intervals.
Correlations
Scatterplots between MWF data (whole CC and regions I–V) and TCI quantifiers (onset, duration, and depth) were used to identify correlations in individuals with MS alone. Pearson product-moment correlations were performed and correlation test p-values were computed and adjusted for multiple comparisons using a Holm-Bonferroni correction.
Results
Six MS participants and one control did not show quantifiable bilateral TCI. In addition, one MS participant had contraindications to TMS. These individuals were incorporated into the MRI-only analysis, but omitted from analyses where TMS data was required. One MS participant had MRI contraindications and was excluded from analyses requiring MRI data. Independent analyses of MRI and TMS data, as well as correlations between MRI and TMS data are reported here. Within our 26-participant cohort, no reported structural or functional measurements were observed to differ significantly between males and females (unadjusted p > 0.1 for all 28 measured variables assessed).
MWF Was Higher in the Posterior CC Than in the Anterior CC
We examined the association of MWF with both region and group (MS vs. control) using a generalized estimating equations (GEE) approach to account for repeated measures (within-sample error) and assuming independence between samples. MWF varied significantly by region, and was highest in the posterior CC (Figure 4). Post-hoc pairwise comparisons of neighbouring regions with a Bonferroni correction of p-values showed statistically significant differences between II and III (p = 2.4 × 10⁻⁶) and IV and V (p = 0.00061). This distribution of MWF was seen independently in both MS and control groups (Supplemental Table 1).
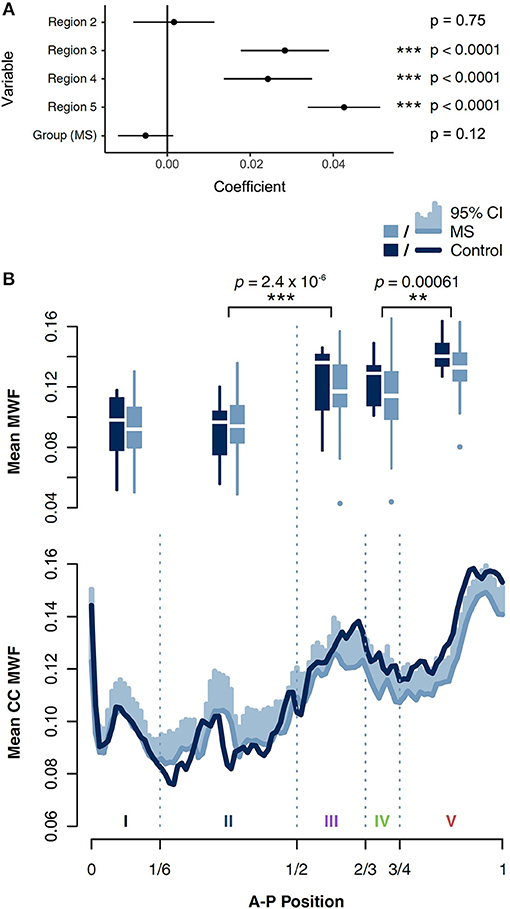
Figure 4. (A) MWF was found to vary significantly by corpus callosal region using a multivariate generalized estimating equations (GEE) model. MWF was lower in MS than in controls, but this finding did not reach statistical significance. Likelihood ratios are shown relative to their difference from control group, region 1. (B) Boxplots of MWF in five regions of the CC in individuals with MS and controls. Significant differences based on Tukey's range test between adjacent regions are shown. MWF averaged in voxel-thick vertical strips in each sagittal slice were interpolated linearly to 100 values between anterior and posterior ends, and then averaged across slices to obtain a CC MWF distribution for each subject. These distributions were then averaged across individuals with MS and controls separately, with 95% confidence intervals shown.
Although median MWF was consistently lower in MS across all regions, this trend did not independently achieve statistical significance (p = 0.12). In a separate model, we also examined the interaction of group and region as a regression term, which was also not a statistically significant predictor of MWF (Supplementary Figure 2).
iSP Duration Was Increased in Individuals With MS Compared With Controls
Paired t-tests on iSP onset, iSP duration, and transformed inhibition depth did not yield evidence of a significant difference between stimulation of left and right hemispheres (iSP onset p = 0.995, iSP duration p = 0.995, transformed inhibition depth p = 0.358; Holm-Bonferroni adjusted p-values). TCI values were averaged across the two hemispheres. A comparison between individuals with MS and controls demonstrated that average iSP duration was significantly prolonged in individuals with MS compared to controls (MS: 36.0 ± 5.2 ms; control: 25.6 ± 8.2 ms; adjusted p = 0.048). There was no significant difference in iSP onset and transformed inhibition depth between MS and control groups (Figure 5). However, median values and quantile-wise comparison suggested a possible subtle increase in iSP onset latency and decrease in inhibition depth in individuals with MS (Supplemental Figure 1). Considering this finding, post-hoc analysis of clinical measures found that iSP duration correlated with EDSS score (r = 0.614, p = 0.020) and disease duration (r = 0.551, p = 0.045), whereas iSP onset did not (Figure 6).
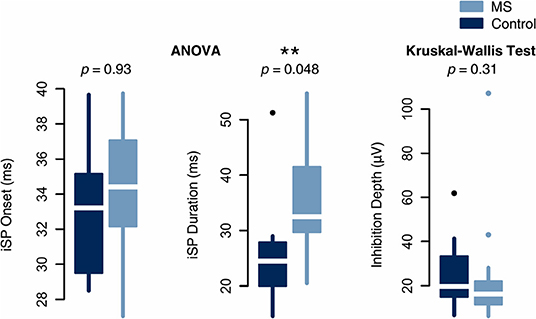
Figure 5. Analysis of inter-group differences in normally distributed TCI measures by one-way ANOVA and non-normally distributed measures by the non-parametric Kruskal-Wallis test. iSP duration was significantly increased in MS whereas iSP onset and inhibition depth were not significantly different between groups.
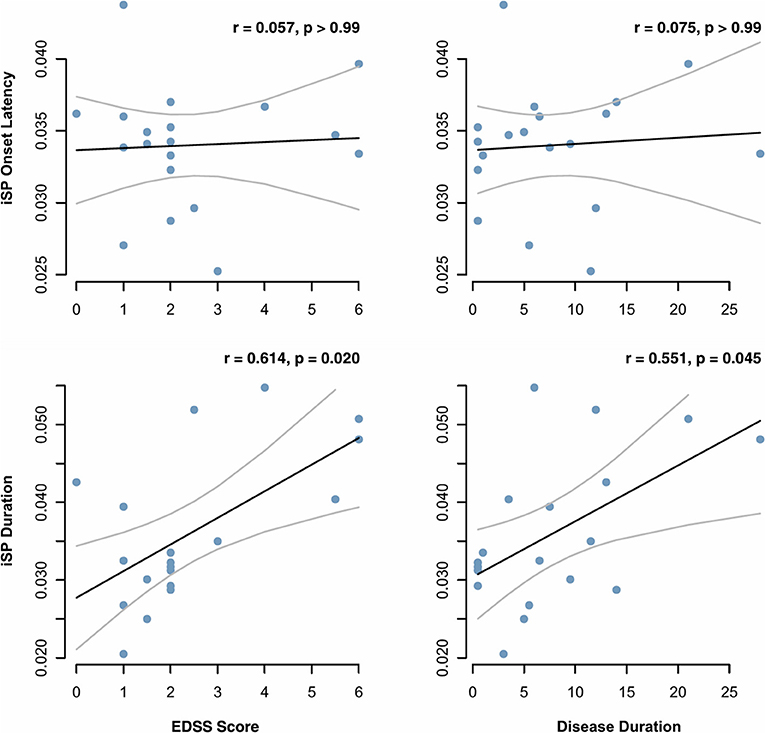
Figure 6. Onset latency and duration of the ipsilateral silent period (iSP), as measured by transcranial magnetic stimulation, were correlated with MS clinical measures. Correlation coefficients and p values were calculated based on Pearson correlation and adjusted for multiple comparisons by the Holm-Bonferroni method.
MWF in Regions III and IV Correlated Negatively With Inhibition Depth in MS
MWF in regions III and IV correlated negatively with transformed inhibition depth in the MS group (Pearson product-moment correlation: r = −0.73, adjusted p = 0.0062 in both regions). The same correlations were non-significant when MS and control data was combined (r = −0.47, adjusted p = 0.17 in region III; r = −0.53, adjusted p = 0.059 in region IV) (Figure 7). iSP onset and duration did not correlate with MWF in any region. No systematic artefacts were observed in the regression standardized residuals.
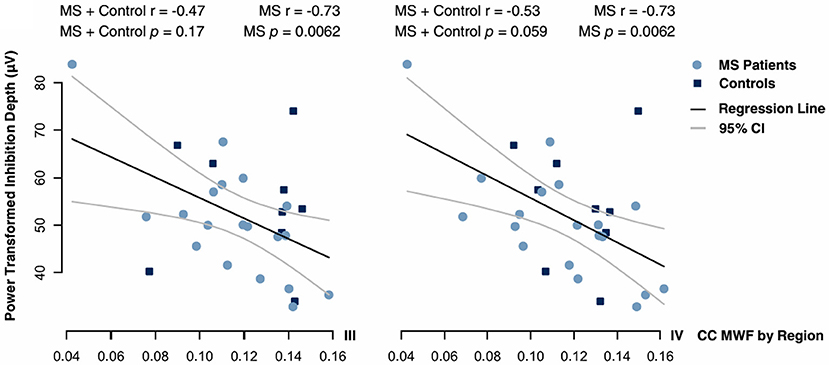
Figure 7. Correlations between inhibition depth with Box-Cox power transform and MWF in regions III and IV of the CC. Data were fitted by Pearson regression. Product-moment correlation coefficients and p-values adjusted for multiple comparisons by a Holm-Bonferroni correction are given.
Discussion
This study investigated relationships between MRI-based measures of CC myelination and TMS-based measures of transcallosal connectivity. TMS measures showed that iSP duration was significantly prolonged in MS compared to controls. We also found that the distribution of MWF across the corpus callosum was in agreement with previous studies [3, 35]. In addition, the MWF in CC regions III and IV (posterior midbody) correlated with the transformed depth of inhibition. MS participants showed reduced MWF along the length of the corpus callosum. Although, the present analysis was not sufficiently powered to confirm statistical significance, this finding agrees with that of previous study [8]. These findings allow us to draw conclusions both on the clinical utility of these techniques as well as the underlying neurobiology of CC demyelination.
iSP Duration May Be a More Sensitive Biomarker of MS Disability Than iSP Onset Latency
iSP duration was significantly longer in MS than in controls while iSP onset latency and inhibition depth were comparable between groups. Two previous studies observed both prolonged iSP duration and increased iSP onset latency in MS patients [14, 36]. In the first study [14], the MS subjects had greater EDSS scores (range 2–8, median 3.0). For the second study [36], the MS subjects had milder disability (EDSS 0–4.5, mean 1.5) Another study on 49 RRMS subjects EDSS 0.0–4.0 (mean 1.3) observed prolonged iSP duration but no change in iSP latency relative to healthy controls [37]. Based on EDSS, our participants also had less advanced disease (range 0–6, median 2.0). To assess the effect of disease severity on iSP onset latency and duration, we performed post-hoc analysis which demonstrated that, in our MS participants, iSP duration correlated with clinical measures of disability whereas iSP onset latency did not (Figure 6). Taken together, these findings provide evidence that iSP duration may be a more sensitive biomarker than delayed iSP onset in individuals with lower disability as measured by EDSS.
We propose that our observations may arise from incomplete demyelination, resulting in a “spreading” of TCI, thereby prolonging the iSP duration rather than delaying iSP onset (Figure 8). One proposed mechanism of selective neuronal damage is size-selective demyelination, with smaller axons demonstrating a greater susceptibility to damage [38]. When compared with a healthy white matter tract, uniformly demyelinated tracts in more advanced disease cause delayed iSP onset. However, partially demyelinated tracts may lead to an increased iSP duration due to a wider distribution of conduction velocities among individual neurons. Although iSP duration differed between MS and control groups, it did not correlate with CC MWF.

Figure 8. Selective demyelination may play a role in prolonged iSP duration. When compared with (1) a healthy white matter tract, (2) uniformly demyelinated tracts in more advanced disease cause delayed iSP onset. However, (3) partially demyelinated tracts may lead to an increased iSP duration due to a wider distribution of conduction velocities among individual neurons.
Interpretation of the Correlation Between Depth of TCI and CC Posterior Midbody MWF
Inhibition depth correlated negatively with MS MWF in regions III and IV of the CC, which make up the posterior midbody, a region containing axons associated with the motor and sensory cortices [26]. Lesion studies demonstrate that the posterior midbody carries the majority of fibres associated with transcallosal inhibition (TCI) [16, 39, 40]. In addition, we found that tracts in the posterior midbody possessed 27% higher MWF when compared with the anterior half of the CC trunk. The decrease in MWF in the MS group from control group was larger in the posterior regions than in the anterior regions of the CC. This agrees with previous findings which showed that the splenium of the CC has a higher MWF than the genu by 26% in MS and 32% in controls, and that the splenium has a significantly lower MWF in MS whereas the genu does not [8].
The negative correlation between MWF in regions III/IV and inhibition depth indicates that demyelination of these TCI-mediating regions is associated with greater inhibition depth. Callosal atrophy and axonal damage have been previously shown to weaken or eliminate TCI [36, 41]. Also, higher fractional anisotropy values correlate with greater inhibition depth during the iSP in healthy individuals [18]. Our data suggest the opposite relationship between TCI and demyelination. This finding suggests that demyelination within specific regions of the CC alters TCI in a manner that differs from axonal damage. Given that a polysynaptic circuit mediates TCI, the observed association could possibly reflect compensatory intracortical mechanisms that may explain this unexpected finding in MS. Future work should characterize intracortical excitability in conjunction with TCI assessments to better understand the relationships between demyelination and cortical circuit excitability.
Because the CC has been observed to continually mediate both inhibitory and excitatory processes [42], CC damage may dysregulate these processes and cause TCI to either increase or decrease in amplitude. For example, studies of CC damage and its effect on neuromuscular tone have found that while congenital agenesis of the CC is linked with decrease muscle tone [43], CC injury has also been observed to cause hypertonia in some animal models [44].
Our findings demonstrate that the tracts of regions III and IV of the CC, previously shown to mediate TCI, are highly myelinated in healthy brains but undergo demyelination in MS that is more severe than other regions of the CC. Demyelination in this critical region, as assessed by MWF, correlates with increases in TCI in MS participants but not controls. This amounts to a localizable structure-function relationship within the CC characterized by MRI and TMS together.
Limitations of the Study
From rodent spinal cord studies, there is evidence that, due to movement of water between the myelin bilayers and the intra and extracellular spaces, the measured MWF is reduced in neurons which have thinner myelin sheaths [45]. Such effects have not been confirmed in the brain, but could lead to an underestimation of MWF in regions with thin myelin. Although the control cohort was matched for age and sex, coming from a university population, the controls likely had more years of education than the MS cohort which may affect the MWF [46]. The observation of fewer significant correlations between iSP parameters and MWF in the control group compared to the MS group may have been partly due to there being fewer control subjects. The ROIs were defined for a narrow slice of the CC to avoid anatomical ambiguity in more lateral slices, but it is possible that this would fail to capture demyelination occurring more laterally within transcallosal fibres. Both MWF and TCI are subject to noise and systematic artefacts. Time-averaging of TCI data across trials is necessary to obtain a sufficient signal to noise ratio, but may introduce artefacts or suppress subpopulations of trials with outlying onsets and/or durations. Finally, we did not look for the presence or absence of focal lesions in the corpus callosum for the MS cohort and we did not control for subject age, education, disease duration, or EDSS; our goal was a global characterisation of the corpus callosum and it's five segments for comparison with TMS. While we did not control for age in this study, previous work [47] has shown minimal change in MWF in the corpus callosum in healthy controls aged 25–55 years.
Conclusions
Our study investigated the process of TCI, the distribution of CC MWF, and the effects of CC demyelination on transcallosal connectivity in RRMS. Taken together with previous studies, our work further describes the diagnostic value of iSP onset and duration, demonstrating that iSP duration is a sensitive MS biomarker. The pairing of myelin water imaging and TMS has elucidated structure-function relationships of CC myelination. Correlations between MWF and inhibition depth provide evidence that demyelination in the posterior CC, particularly regions III and IV, can increase inhibition depth. This supports the notion that the posterior midbody of the CC mediates TCI and demonstrates that increases in TCI magnitude may be indicative of demyelination. It is our hope that these findings encourage further study in the combined use of MRI and TMS techniques for monitoring neurological disease. This study serves as a starting point for understanding how these non-invasive methods can enable in vivo characterization of the structure-function relationships of myelin.
Data Availability Statement
The datasets for this study will not be made publicly available because public data availability was not part of the consent form signed by study participants. Requests to access the datasets should be directed to the corresponding author.
Ethics Statement
This study was carried out in accordance with the recommendations of the University of British Columbia Clinical Research Ethics Board with written informed consent from all subjects. All subjects gave written informed consent in accordance with the Declaration of Helsinki. The protocol was approved by the UBC Clinical Research Ethics Board—Approval Certificate (H09-01938).
Author Contributions
IV, CL, AT, DL, LB, and AM: conception and design of study. IV, AT, and MZ: data collection. EZ, IV, and MB: data analysis. EZ, IV, MZ, MB, CL, AR, AT, DL, LB, and AM: data interpretation, edited, and revised manuscript. EZ: drafted manuscript.
Funding
Funding was provided by Teva Canada Innovation and an NSERC Discovery grant to AM.
Conflict of Interest
AT has received research grants from the MS Society of Canada and honoraria from Biogen, Chugai, Sanofi Genzyme, Roche, Teva Neurosciences, and EMD Serono not related to this analysis. DL has received research funding from the Canadian Institute of Health Research and Multiple Sclerosis Society of Canada. He is the Emeritus Director of the UBC MS/MRI Research Group which has been contracted to perform central analysis of MRI scans for therapeutic trials with Novartis, Perceptives, Roche and Sanofi-Aventis. The UBC MS/MRI Research Group has also received grant support for investigator-initiated independent studies from Genzyme, Merck-Serono, Novartis and Roche. He has acted as a consultant to Vertex Pharmaceuticals and served on the Data and Safety Advisory Board for Opexa Therapeutics and Scientific Advisory Boards for Adelphi Group, Novartis and Roche. He has also given lectures which have been supported by non-restricted education grants from Novartis and Biogen.
The remaining authors declare that the research was conducted in the absence of any commercial or financial relationships that could be construed as a potential conflict of interest.
Acknowledgments
The authors would like to sincerely thank all of the study participants, as well as MRI technologists and support staff at the UBC MRI Research Centre. This study was supported by funding from Teva Canada Innovation. The decision to publish this article was solely the responsibility of the authors. All statements, opinions, and content presented in the published article are those of the authors and do not represent the opinions of Teva. Teva provided a medical accuracy review of the article. The UBC MRI Research Centre acknowledges the ongoing support of Philips Healthcare. We also thank Nolan Shelley, Praveena Manogaran, Yinshan Zhao, and Alex Ng for helpful discussion regarding analysis and statistics, and Chantal Roy-Hewitson for clinical support. EZ was supported by a UBC Dean of Science Undergraduate Summer Research Award. MB was supported by funding from the Heart and Stroke Foundation. CL was the recipient of the Women Against MS endMS Research and Training Network Transitional Career Development Award from the Multiple Sclerosis Society of Canada. AR was supported by a CIHR New Investigator Award and was supported by Canada Research Chairs, the Natural Sciences and Engineering Research Council of Canada, and the National MS Society. LB was funded by the Canadian Research Chairs and the Michael Smith Foundation for Health Research. AM was supported by grants from the Natural Sciences and Engineering Research Council of Canada and the MS Society of Canada.
Supplementary Material
The Supplementary Material for this article can be found online at: https://www.frontiersin.org/articles/10.3389/fphy.2019.00141/full#supplementary-material
References
1. Whittall KP, Mackay AL. Quantitative interpretation of nmr relaxation data. J Magn Reson. (1989) 84:134–52. doi: 10.1016/0022-2364(89)90011-5
2. Mackay A, Whittall K, Adler J, Li D, Paty D, Graeb D. In vivo visualization of myelin water in brain by magnetic resonance. Magn Reson Med. (1994) 31:673–7. doi: 10.1002/mrm.1910310614
3. Whittall KP, Mackay AL, Graeb DA, Nugent RA, Li DK, Paty DW. In vivo measurement of T2 distributions and water contents in normal human brain. Magn Reson Med. (1997) 37:34–43. doi: 10.1002/mrm.1910370107
4. Moore GRW, Leung E, Mackay AL, Vavasour IM, Whittall KP, Cover KS, et al. A pathology-MRI study of the short-T2 component in formalin-fixed multiple sclerosis brain. Neurology. (2000) 55:1506–10. doi: 10.1212/WNL.55.10.1506
5. Webb S, Munro CA, Midha R, Stanisz GJ. Is multicomponent T2 a good measure of myelin content in peripheral nerve? Magn Reson Med. (2003) 49:638–45. doi: 10.1002/mrm.10411
6. Laule C, Leung E, Lis DK, Traboulsee AL, Paty DW, Mackay AL, et al. Myelin water imaging in multiple sclerosis: quantitative correlations with histopathology. Mult Scler. (2006) 12:747–53. doi: 10.1177/1352458506070928
7. Laule C, Kozlowski P, Leung E, Li DK, Mackay AL, Moore GR. Myelin water imaging of multiple sclerosis at 7 T: correlations with histopathology. Neuroimage. (2008) 40:1575–80. doi: 10.1016/j.neuroimage.2007.12.008
8. Laule C, Vavasour IM, Moore GRW, Oger J, Li DKB, Paty DW, et al. Water content and myelin water fraction in multiple sclerosis: a T2 relaxation study. J Neurol. (2004) 251:284–93. doi: 10.1007/s00415-004-0306-6
9. Vargas WS, Monohan E, Pandya S, Raj A, Vartanian T, Nguyen TD, et al. Measuring longitudinal myelin water fraction in new multiple sclerosis lesions. Neuroimage Clin. (2015) 9:369–75. doi: 10.1016/j.nicl.2015.09.003
10. Barker AT, Jalinous R, Freeston IL. Non-invasive magnetic stimulation of human motor cortex. Lancet. (1985) 1:1106–7. doi: 10.1016/S0140-6736(85)92413-4
11. Wassermann EM, Fuhr P, Cohen LG, Hallett M. Effects of transcranial magnetic stimulation on ipsilateral muscles. Neurology. (1991) 41:1795–9. doi: 10.1212/WNL.41.11.1795
12. Ferbert A, Priori A, Rothwell JC, Day BL, Colebatch JG, Marsden CD. Interhemispheric inhibition of the human motor cortex. J Physiol. (1992) 453:525–46. doi: 10.1113/jphysiol.1992.sp019243
13. Meyer BU, Roricht S, Grafin Von Einsiedel H, Kruggel F, Weindl A. Inhibitory and excitatory interhemispheric transfers between motor cortical areas in normal humans and patients with abnormalities of the corpus callosum. Brain. (1995) 118:429–40. doi: 10.1093/brain/118.2.429
14. Boroojerdi B, Hungs M, Mull M, Topper R, Noth J. Interhemispheric inhibition in patients with multiple sclerosis. Electroencephalogr Clin Neurophysiol. (1998) 109:230–7. doi: 10.1016/S0924-980X(98)00013-7
15. Neva JL, Lakhani B, Brown KE, Wadden KP, Mang CS, Ledwell NH, et al. Multiple measures of corticospinal excitability are associated with clinical features of multiple sclerosis. Behav Brain Res. (2016) 297:187–95. doi: 10.1016/j.bbr.2015.10.015
16. Hoppner J, Kunesch E, Buchmann J, Hess A, Grossmann A, Benecke R. Demyelination and axonal degeneration in corpus callosum assessed by analysis of transcallosally mediated inhibition in multiple sclerosis. Clin Neurophysiol. (1999) 110:748–56. doi: 10.1016/S1388-2457(98)00075-3
17. Li JY, Lai PH, Chen R. Transcallosal inhibition in patients with callosal infarction. J Neurophysiol. (2013) 109:659–65. doi: 10.1152/jn.01044.2011
18. Fling BW, Benson BL, Seidler RD. Transcallosal sensorimotor fiber tract structure-function relationships. Hum Brain Mapp. (2013) 34:384–95. doi: 10.1002/hbm.21437
19. Mädler B, Drabycz SA, Kolind SH, Whittall KP, Mackay AL. Is diffusion anisotropy an accurate monitor of myelination? Correlation of multicomponent T2 relaxation and diffusion tensor anisotropy in human brain. Magn Reson Imaging. (2008) 26:874–888. doi: 10.1016/j.mri.2008.01.047
20. Jones DK, Knosche TR, Turner R. White matter integrity, fiber count, and other fallacies: the do's and don'ts of diffusion MRI. Neuroimage. (2013) 73:239–54. doi: 10.1016/j.neuroimage.2012.06.081
21. Kurtzke JF. Rating neurologic impairment in multiple sclerosis: an expanded disability status scale (EDSS). Neurology. (1983) 33:1444–52. doi: 10.1212/WNL.33.11.1444
22. Prasloski T, Madler B, Xiang QS, Mackay A, Jones C. Applications of stimulated echo correction to multicomponent T2 analysis. Magn Reson Med. (2012) 67:1803–14. doi: 10.1002/mrm.23157
23. Prasloski T, Rauscher A, Mackay AL, Hodgson M, Vavasour IM, Laule C, et al. Rapid whole cerebrum myelin water imaging using a 3D GRASE sequence. Neuroimage. (2012) 63:533–9. doi: 10.1016/j.neuroimage.2012.06.064
24. Smith SM, Jenkinson M, Woolrich MW, Beckmann CF, Behrens TE, Johansen-Berg H, et al. Advances in functional and structural MR image analysis and implementation as FSL. Neuroimage. (2004) 23 (Suppl 1):S208–219. doi: 10.1016/j.neuroimage.2004.07.051
25. Jenkinson M, Beckmann CF, Behrens TE, Woolrich MW, Smith SM. FSL. Neuroimage. (2012) 62:782–90. doi: 10.1016/j.neuroimage.2011.09.015
26. Hofer S, Frahm J. Topography of the human corpus callosum revisited–comprehensive fiber tractography using diffusion tensor magnetic resonance imaging. Neuroimage. (2006) 32:989–94. doi: 10.1016/j.neuroimage.2006.05.044
27. Caminiti R, Carducci F, Piervincenzi C, Battaglia-Mayer A, Confalone G, Visco-Comandini F, et al. Diameter, length, speed, and conduction delay of callosal axons in macaque monkeys and humans: comparing data from histology and magnetic resonance imaging diffusion tractography. J Neurosci. (2013) 33:14501–11. doi: 10.1523/JNEUROSCI.0761-13.2013
29. Wakana S, Caprihan A, Panzenboeck MM, Fallon JH, Perry M, Gollub RL, et al. Reproducibility of quantitative tractography methods applied to cerebral white matter. Neuroimage. (2007) 36:630–44. doi: 10.1016/j.neuroimage.2007.02.049
30. Hua K, Zhang J, Wakana S, Jiang H, Li X, Reich DS, et al. Tract probability maps in stereotaxic spaces: analyses of white matter anatomy and tract-specific quantification. Neuroimage. (2008) 39:336–47. doi: 10.1016/j.neuroimage.2007.07.053
31. Devanne H, Lavoie BA, Capaday C. Input-output properties and gain changes in the human corticospinal pathway. Exp Brain Res. (1997) 114:329–38. doi: 10.1007/PL00005641
32. Rossi S, Hallett M, Rossini PM, Pascual-Leone A. Safety, ethical considerations, and application guidelines for the use of transcranial magnetic stimulation in clinical practice and research. Clin Neurophysiol. (2009) 120:2008–39. doi: 10.1016/j.clinph.2009.08.016
34. Box G, Cox D. An analysis of transformations. J R Stat Soc Ser B. (1964) 26:211–52. doi: 10.1111/j.2517-6161.1964.tb00553.x
35. Bjornholm L, Nikkinen J, Kiviniemi V, Nordstrom T, Niemela S, Drakesmith M, et al. Structural properties of the human corpus callosum: multimodal assessment and sex differences. Neuroimage. (2017) 152:108–18. doi: 10.1016/j.neuroimage.2017.02.056
36. Lenzi D, Conte A, Mainero C, Frasca V, Fubelli F, Totaro P, et al. Effect of corpus callosum damage on ipsilateral motor activation in patients with multiple sclerosis: a functional and anatomical study. Hum Brain Mapp. (2007) 28:636–44. doi: 10.1002/hbm.20305
37. Jung P, Beyerle A, Humpich M, Neumann-Haefelin T, Lanfermann H, Ziemann U. Ipsilateral silent period: a marker of callosal conduction abnormality in early relapsing-remitting multiple sclerosis? J Neurol Sci. (2006) 250:133–9. doi: 10.1016/j.jns.2006.08.008
38. Evangelou N, Konz D, Esiri MM, Smith S, Palace J, Matthews PM. Size-selective neuronal changes in the anterior optic pathways suggest a differential susceptibility to injury in multiple sclerosis. Brain. (2001) 124:1813–20. doi: 10.1093/brain/124.9.1813
39. Meyer BU, Roricht S, Woiciechowsky C. Topography of fibers in the human corpus callosum mediating interhemispheric inhibition between the motor cortices. Ann Neurol. (1998) 43:360–9. doi: 10.1002/ana.410430314
40. Wahl M, Lauterbach-Soon B, Hattingen E, Jung P, Singer O, Volz S, et al. Human motor corpus callosum: topography, somatotopy, and link between microstructure and function. J Neurosci. (2007) 27:12132–8. doi: 10.1523/JNEUROSCI.2320-07.2007
41. Manson SC, Palace J, Frank JA, Matthews PM. Loss of interhemispheric inhibition in patients with multiple sclerosis is related to corpus callosum atrophy. Exp Brain Res. (2006) 174:728–33. doi: 10.1007/s00221-006-0517-4
42. Bloom JS, Hynd GW. The role of the corpus callosum in interhemispheric transfer of information: excitation or inhibition? Neuropsychol Rev. (2005) 15:59–71. doi: 10.1007/s11065-005-6252-y
43. Moes P, Schilmoeller K, Schilmoeller G. Physical, motor, sensory and developmental features associated with agenesis of the corpus callosum. Child Care Health Dev. (2009) 35:656–72. doi: 10.1111/j.1365-2214.2009.00942.x
44. Drobyshevsky A, Derrick M, Wyrwicz AM, Ji X, Englof I, Ullman LM, et al. White matter injury correlates with hypertonia in an animal model of cerebral palsy. J Cereb Blood Flow Metab. (2007) 27:270–81. doi: 10.1038/sj.jcbfm.9600333
45. Harkins KD, Dula AN, Does MD. Effect of intercompartmental water exchange on the apparent myelin water fraction in multiexponential T2 measurements of rat spinal cord. Magn Reson Med. (2012) 67:793–800. doi: 10.1002/mrm.23053
46. Flynn SW, Lang DJ, Mackay AL, Goghari V, Vavasour IM, Whittall KP, et al. Abnormalities of myelination in schizophrenia detected in vivo with MRI, and post-mortem with analysis of oligodendrocyte proteins. Mol Psychiatry. (2003) 8:811–20. doi: 10.1038/sj.mp.4001337
Keywords: myelin water imaging, transcranial magnetic stimulation, multiple sclerosis, demyelinating diseases, central nervous system, neurophysiology, corpus callosum
Citation: Zhao EY, Vavasour IM, Zakeri M, Borich MR, Laule C, Rauscher A, Traboulsee A, Li DKB, Boyd LA and MacKay AL (2019) Myelin Water Imaging and Transcranial Magnetic Stimulation Suggest Structure-Function Relationships in Multiple Sclerosis. Front. Phys. 7:141. doi: 10.3389/fphy.2019.00141
Received: 29 April 2019; Accepted: 13 September 2019;
Published: 09 October 2019.
Edited by:
Marta Bianciardi, Massachusetts General Hospital and Harvard Medical School, United StatesReviewed by:
Michelle Ploughman, Memorial University of Newfoundland, CanadaJeffrey A. Stanley, Wayne State University, United States
Copyright © 2019 Zhao, Vavasour, Zakeri, Borich, Laule, Rauscher, Traboulsee, Li, Boyd and MacKay. This is an open-access article distributed under the terms of the Creative Commons Attribution License (CC BY). The use, distribution or reproduction in other forums is permitted, provided the original author(s) and the copyright owner(s) are credited and that the original publication in this journal is cited, in accordance with accepted academic practice. No use, distribution or reproduction is permitted which does not comply with these terms.
*Correspondence: Alex L. MacKay, bWFja2F5QHBoeXNpY3MudWJjLmNh
 Eric Y. Zhao
 Irene M. Vavasour2
 Marjan Zakeri
 Michael R. Borich
 Cornelia Laule
 Alexander Rauscher
 David K. B. Li
 Lara A. Boyd
 Alex L. MacKay