
94% of researchers rate our articles as excellent or good
Learn more about the work of our research integrity team to safeguard the quality of each article we publish.
Find out more
ORIGINAL RESEARCH article
Front. Phys., 20 August 2019
Sec. Biophysics
Volume 7 - 2019 | https://doi.org/10.3389/fphy.2019.00115
This article is part of the Research TopicAdvancing Our Understanding of Structure and Function in the Brain: Developing Novel Approaches for Network Inference and Emergent PhenomenaView all 11 articles
Imagined activities could actually be a cognitive basis for creative thinking. However, it is still unknown how they might be related with the architecture of the brain. A recent study has proved the relevance of the imagined activity when investigating neuronal diseases by comparing variations in the neuronal activity of patients with brain diseases and healthy subjects. One important aspect of the scientific methodologies focused on neuronal diseases is therefore to provide a trustable methodology that could allow us to distinguish between realized and imagined activities in the brain. The electroencephalogram is the result of synchronized action of the cerebrum, and our end is portraying the network dynamics through the neuronal responses when the subjects perform visuomotor and specific imaginary assignments. We use a subtle information theoretical approach accounting for the time causality of the signal and the closeness centrality of the different nodes. More specifically we perform estimations of the probability distribution of the data associated to each node using the Bandt and Pompe approach to account for the causality of the electroencephalographic signals. We calculate the Jensen-Shannon distance across different nodes, and then we quantify how fast the information flow would be through a given node to other nodes computing the closeness centrality. We perform a statistical analysis to compare the closeness centrality considering the different rhythmic oscillation bands for each node taking into account imagined and visuomotor tasks. Our discoveries stress the pertinence of the alpha band while performing and distinguishing the specific imaginary or visuomotor assignments.
One of the principal assumptions in neuroscience is that the brain computes, and this is accepted by most scientists in the area. That is, the cerebrum takes approaching tangible information, encodes it into a few biophysical factors consisting of membrane voltage or neuronal activation costs, after which a wide variety of dynamic operations are played to extract applicable features of the input. The result is that some of these computations can be stored for later access and ultimately, to control the behavior of the animal in the most convenient way. In addition, the brain processes sensory information in multiple stages in neural circuits. The information is transmitted through trains of action potential or less frequently by local field potentials (LFPs). More specifically for the action potentials, the information can also be transmitted through the counting of spikes, the temporal precision of them, the structure of the time series, the synchronization between groups of neurons, or some combination of these [1–11]. Thus, the brain does not have a single code but multiple which depend on multiple complex dynamic variables.
In particular, the scalp electroencephalogram (EEG), recorded by means of a given electrode, can be taken into consideration as a spatiotemporally smoothed version of the LFP that is incorporated over an area of 10 cm2 or greater. Electroencephalography can accurately detect brain activity at a time resolution of a single millisecond [12]. This technique provides continuous recording of the brain's electrical processes which allows us to relate changes in signal with a particular cognitive task. It is conceivable to extract from the EEG the functional connectivity network. However, the elucidation of the inter-connectivity from sensor level recordings is not straightforward [13]. In this manner some endeavors to use convenient techniques on the time series dynamics recreated from scalp EEG signals can be found in the literature [14–17]. Network theory is usually based on graph theory, probability theory, statistical mechanics, and dynamical systems [14–28].
The brain is a large-scale complex network and discovering interdependencies between at least two EEG electrodes can be described utilizing a few methodologies [29]. Let us remark that the network analysis of EEG data can help us to gain a deeper understanding of the brain functions as finding the correct functional connectivity of the brain through EEG signal can be used as a biomarker to diagnose mental disorders [17, 30, 31]. Investigating the dynamics of the EEG signals complex network means to estimate the degree of correlation across the different temporal patterns for the different electrodes or nodes. Fluctuations of electrical activity registered by EEG show correlated neuronal activity [32]. The extent of oscillatory coupling between two EEG signals can be used as a measure of strength to reflect network activity of the brain. The human brain can be understood as a large-scale complex network [15, 33, 34], the topological properties of EEG-derived networks describe working memory phases [35], and variations in the path length connectivity across nodes can be linked with mental diseases [17, 31].
Methods of EEG analysis are based on the investigation of dynamic changes of electrical activity in time, frequency, and space. A straight methodology for assessing the associations is finding how comparable the signals' waveforms are of each frequency when a time-lag is used to one of them. This is evaluated through cross-correlation [30, 36, 37]. However, non-linear components of coupling can control the neuronal activity. In this way non-linear affinity measures ought to be considered to determine the brain complex network. Bandt and Pompe (BP) proposed a novel methodology that comprises in changing the signal, by means of a symbolic methodology, into a sequence of patterns and then making inference over them [38–40]. In view of the evaluation of the ordinal structures present in the time series and their neighborhood impact on the related probability density function they include the signals' own temporal causality through a methodology of simple application and direct estimation [38–42]. Thus, the BP approach permits us to find important causative data associated with the hidden non-linear variables that regulate the system. Statistical complexity measures are useful to quantify stochastic systems and to detect whether a system is not deterministic or random. The perfect order and the maximum randomness can be depicted all around effectively on the grounds that they do not have any structure and in the two cases the statistical complexity is zero. In any case, between these two limits there is a wide scope of ordinal structures of important stochastic nature. The complexity measure has been effectively utilized in perception and portrayal of various dynamical regimes [38–43]. The non-linear elements of the cerebrum are of dissipative nature, and subject to non-equilibrium conditions that describe the developing properties of the neurons and portray the conduct of the neuronal capacities. The Jensen-Shannon divergence, which evaluates the contrast between (at least two) probability distribution functions (PDFs), is particularly valuable to compare the symbol-composition of different sequences. Statistical complexity enables us to measure basic features about the dynamic of the PDF related to the EEG recorded activity [38–43]. This measure originally obtained from Information Theory enables us to evaluate the non-linear dynamics of the electro-cortical responses [38–43]. The statistical complexity is the result of two entropies, the Shannon entropy and Jensen–Shannon divergence, however it is a non-trivial mathematical relation of the entropy since it relies upon two probability functions, i.e., the one relating to the condition of the system and the uniform PDF taken as reference state. Essentially, in the present work we estimate the normalized Jensen-Shannon distance between two probabilities, however one comparing to the condition of the electrical activity in one electrode and the state PDF taken from another electrode as reference [44]. The aim of this study is to perform a discrimination of imagined [45] and non-imagined tasks through the application of the Jensen–Shannon divergence of the BP probabilities across different electrodes sites in combination with estimation of the closeness centrality of nodes. We conduct a statistical analysis to examine the closeness centrality for the different rhythmic oscillation bands and nodes, considering imagined and visuomotor tasks. Our current approach allows us to discriminate imagined and non-imagined tasks characterizing the most important nodes within a graph for the different rhythmic oscillation bands using a functional network based on the BP formalism and the Jensen–Shannon divergence.
Consider a time signal of length M, and at first, we expect that there are not equivalent abundance esteems in the time signal, that is the probability P(xt1 = xt2) = 0 ∀ t1 ≠ t2. Bandt and Pompe presented in their foundational paper an effective technique for the assessment of PDF related to a time signal utilizing a symbolization system [38]. For a point by point portrayal of the methodology we allude the reader to [46]. The significant symbolic descriptions are (i) made by ranking the magnitudes of the signal and (ii) characterized by reordering the symbols in upward order; this is similar to a state space reconstruction with embedding dimension D and time lag τ. Further subtleties portraying the focal points that make the BP system more helpful than regular techniques dependent on range dividing (i.e., PDF amplitude histograms) can be discovered in Olivares et al. [47, 48], Rosso et al. [49, 50], Rosso and Masoller [39, 40], Saco et al. [51], and Keller and Sinn [52]. The BP approach can be used for any kind of signals, and the main condition for the appropriateness of this procedure is a stationary hypothesis (that is, for k ≤ D, the likelihood for xt < xt+k ought not be conditional on t [38]). To utilize the Bandt and Pompe [38] procedure for assessing the PDF, P, related with the signal, one starts considering parcellings of the appropriate D-dimensional space that will “uncover” pertinent subtleties of the ordinal structure of a signal with D > 1 (D ∈ ℕ) and τ (τ ∈ ℕ). Consider the “ordinal pattern” of order (length) D produced by (s) ↦ (xs−(D−1)τ, xs−(D−2)τ, ⋯ , xs−τ, xs ), that gives to each time s the D-dimensional vector of magnitudes in instants s,s − τ, ⋯ , s − (D − 1)τ. Notice that when the D−value is greater, more data about the past are incorporated into our vectors. We designate “ordinal pattern” identified with the time (s) to the configuration π = (r0, r1, ⋯ , rD−1) of [0, 1, ⋯ , D−1] characterized by xs−rD−1 τ ≤ xs−rD − 2 τ ≤ ⋯ ≤ xs−r1 τ ≤ xs−r0 τ . Vitally, to get a one of a kind outcome we take ri < ri−1 if xs−ri = xs−ri−1. This can be warranted if the xt comes from a continuous PDF, so similar magnitudes are unlikely. In this manner, for all the D! conceivable configurations π of order D, their related relative frequencies can be determined by the occasions this specific arrangement is found in the signal divided by the full number of configurations:
We allude the image ♯ to “number.” That is, an ordinal PDF P = {p(πi), i = 1, ⋯ , D!} is obtained from the signal. In this way it is conceivable to measure the variety of the permutations of length D got from a scalar signal by estimating the Shannon Entropy and MPR statistical complexity. The embedding measurement D decides the quantity of possible states D!. The signal of length M that one needs so as to work with truthful estimators is M ≫ D! [49]. We wish to underline that Bandt and Pompe recommended working with 4 ≤ D ≤ 6 and explicitly considered a delay τ = 1 in their foundational paper [38]. Be that as it may, another estimation of τ can likewise generate extra knowledge [47, 48, 53–57].
Entropy gives us an amount of incertitude and is the most representative case of the information quantifiers. For a PDF f(x) with x ∈ Δ ⊂ ℝ and , we characterize the Shannon Entropy S [58] as
In the discrete case, let be , a time series with M samples and the related PDF, given by P ≡ {pj; j = 1, ⋯, N} with and N the quantity of conceivable states of the examined physical system. Then, Shannon's logarithmic data measure [58] is characterized by
This quantity is equivalent to zero when we can anticipate with sureness which of the conceivable outcomes j, whose probabilities are given by and , it will truly occur. So, in this condition we have maximum information about the hidden procedure. In contrast, this information is negligible for a uniform PDF Pe = {pj = 1/N, ∀j = 1, ⋯ , N}. Regarding the interpretation, the entropy of P(X) indicates the base number of bits expected to encode the estimations of an arbitrary variable X with probability density function P(X). The Shannon entropy S is a quantity of “global character” that is not extremely susceptible to high changes in the PDF that happens in a short zone. Nonetheless, it is essential to bring up that ordinal structures present in a signal are not evaluated by haphazardness or randomness measures.
Let us now consider a time series measured by a given electrode that can be represented by a symbolization alphabet to which we assign a probability distribution Q = {qj, j = 1, ⋯ , N}, and another electrode measures a different time series represented also by different symbols that were drawn from a different probability distribution, P ≡ {pj; j = 1, ⋯, N}. The “cross-entropy” between Q and P is the Kullback-Leibler (KL) distance that is a very useful way to measure the difference between two probability distributions. The KL distance is
This can be rewritten as
Thus the KL divergence represents the number of extra bits necessary to code a source whose symbols were drawn from the distribution P, given that the coder was designed for a source whose symbols were drawn from Q. Despite KL usually being referred as a distance measure between probability distributions, Kullback–Leibler divergence is not a true metric as it does not have the property of symmetry.
On the other hand, Jensen–Shannon divergence enables us to quantify the similitude between two distributions and has been utilized in statistics and probability theory. The Jensen–Shannon divergence is defined as
It is based on the Kullback–Leibler divergence, with some remarkable and important differences: it is symmetric and always provides finite values.
The Jensen–Shannon divergence, which evaluates the distinction between PDFs, is very helpful to analyze the symbolic configuration between various symbolic messages [59]. As non-linear measures ought to be considered to decipher the brain complex network, a straightforward way to investigate this inter-connectivity is using BP formalism in combination with JS disparity (or distance). Let us now consider a time series measured by a given electrode in a brain area that can be represented by a BP symbolization alphabet with probability distribution Q and another electrode sited in another brain area and with different time series represented by probability distribution, P. If we estimate JS(P||Q) a smaller JS implies greater interconnectivity between electrodes, and greater values of JS implies a lower inter-connectivity across them. Thus, the Jensen–Shannon measure in combination with the BP approach can provide us a novel quantification of the network inter-connectivity across EEG electrodes [44].
Our point in this section is to portray the interconnectivity of the EEG frequency bands when the subjects play out a visuomotor or imagined assignment. We have considered for the present investigation the EEG visuomotor Movement/Imagery Dataset recorded utilizing BCI2000 instrumentation accessible through Physionet [12, 41–43, 45, 60, 61]. Figure 1 shows the experimental setup that comprises an arrangement of various utilized electrodes.
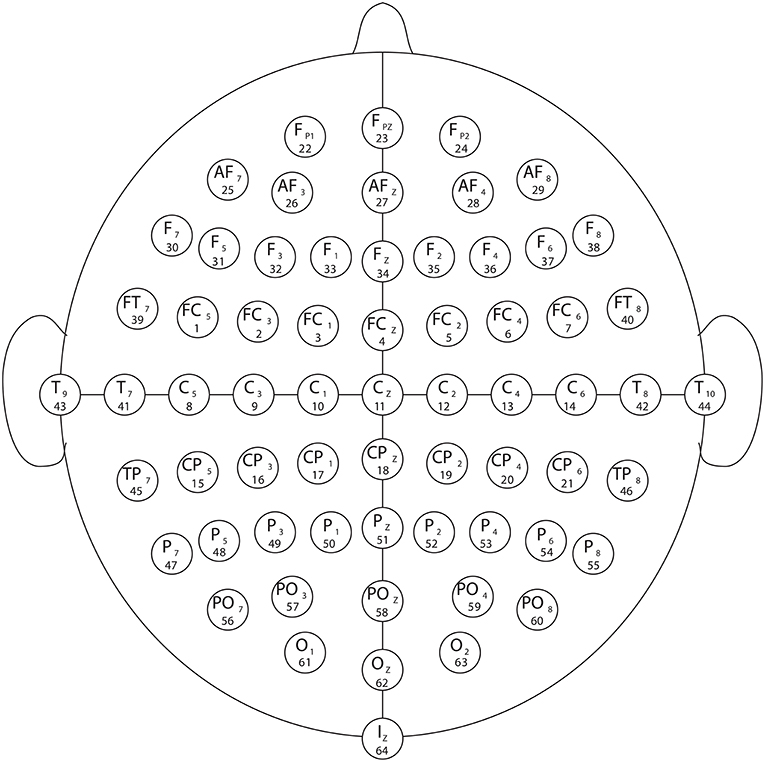
Figure 1. Electrode arrangement as per the international 10–20 system (as in [12, 41–43, 45, 61–63]). The numbers below each electrode name indicate the order in which they appear in the recordings.
The experimental setup of the BCI2000 framework [12, 45] incorporates a set of 64 electrodes used to register the electrical responses of the cerebrum through the EEG signals while the subjects perform diverse assignments of visuomotor or imaginary kinds [12, 41–43, 45, 61–63]. Each subject performed one of each of the four after assignments:
1. An objective shows up on either the left or the right half of the screen. The subject opens and shuts the matching hand until the objective vanishes. At that point the subject unwinds.
2. An objective shows up on either the left or the right half of the screen. The subject envisions opening and shutting the matching hand until the objective vanishes. At that point the subject unwinds.
3. An objective shows up on either the upper or the lower half of the screen. The subject opens and closes either the two hands (if the objective is on the upper half) or the two feet (if the objective is on the base) until the objective vanishes. At that point the subject unwinds.
4. An objective shows up on either the upper or the lower half of the screen. The subject envisions opening and closing either the two hands (if the objective is on the upper half) or the two feet (if the objective is on the base) until the objective vanishes. At that point the subject unwinds.
Eye blink artifacts were produced by quick motions of the eyelid along the cornea, for example, amid an eye squint. In any case, muscular artifacts were cautiously checked toward the start of each recording and confirmed all through the experiment [12, 45, 61–63]. Significantly, in our present investigation the muscular and technical artifacts were discarded following the methodology exhibited in Schalk et al. [12] and Schalk and Mellinger [45]. That is, a Common Average Reference (CAR) is carried out before artifact rejection as demonstrated in Schalk et al. [12] and Schalk and Mellinger [45].
Various oscillatory rhythms have been connected to various parts of perception that are very significant to see how actions are prepared in the human brain [12]. The EEG records the electrical activity of the brain that by a sensory incitement, or a visuomotor output, exhibits distinctive rhythms such as delta (∈ [1, 4) Hz), theta (∈ [4, 8) Hz), alpha (∈ [8, 13) Hz), beta (∈ [13, 31) Hz), and gamma (≥31 Hz).
For a detailed description of the study, the design of the experiment, group of subjects, the condition of the experiment used and the EEG equipment used for the measurements, we refer the reader to [12, 43, 45, 61–63]. The classic scenario where the subjects are performing the motor action using an event-related desynchronization (ERD) analysis is carefully described for the different oscillation bands by Kim et al. [64].
For each subject and for each task we obtain the network, using the BP symbolization technique for each electrode and obtaining a weighted graph, with each weight given by the JS divergence, normalized by taking the maximum value between realized and imagined tasks. For completeness, we show an ERP signal of the current data in the Supplemental Material, and for further details we refer the reader to [43]). Specifically, we utilize the Kaiser filtering window created in Belitski et al. [65] to filter the raw signals for the diverse oscillation bands. The EEG are sampled at 160Hz. But due to the high frequency artifacts that obscured the EEG, and to expel variances at DC level and increment the signal to noise ratio, the records where passed first through a filter between 1 and 50 Hz utilizing a filter created in Belitski et al. [65].
After this filtering, each EEG signal was decomposed, using the Kaiser filtering window created in Belitski et al. [65], in the frequency bands given in Table 1. For further insights regarding the filtering we allude the reader to [41].
Networks are usually built considering different thresholds, and then graphs are constructed. This framework allows us to analyze the functional connectome of the brain. We describe the diverse network rhythmic activity of the brain as indicated by unmistakable visuomotor and imagery tasks using an information theory approach. The main idea of the current analysis is to gain a better understanding of situations in which a given oscillation band recruits specific brain networks for a given oscillation supporting a distinction between the forms identified with attention and development of imaginary movements. We estimate the degree of network interconnectivity as the normalized Jensen-Shannon distance JS between two probabilities: one corresponding to the state of the system in one electrode and the state distribution taken of another electrode as reference state, that is to say by estimating the normalized Jensen–Shannon distance between the BP probabilities across different electrodes sites as in Equation (6). We have normalized the Jensen–Shannon distance by taking the maximum value between realized and imagined tasks. Due to the length of time series we consider D = 6 and τ = 1 for all BP estimations as in (Bandt and Pompe [38], Rosso and Masoller [39, 40], Baravalle et al. [41, 42]). So as to perform examinations inside the BP formalism, we have to meet the condition (M ≫ D!); in this case we have 20,000 points for each case.
Graph theory is the investigation of systems of interacting elements, which are structures used to pose pairwise and/or multiple relations between them [66]. A graph in this setting is comprised of nodes which are associated by edges. The centrality of a node in a system is a measure of the basic importance of the node. While thinking about a graph, closeness centrality of a given node is a measure of centrality in a system and is evaluated as the quantity of nodes less one, N − 1, partitioned by the summation of the length of the shortest path between the node of interest and every single other node in the diagram.
That is
where d(j, i) is the separation between vertices i and j. Closeness centrality measures how short the shortest paths are from node i to all nodes, and we have 62 nodes in total because we exclude the two reference electrodes T9 and T10. We choose the closeness centrality because it is a helpful measure to estimate level of efficiency and convenience that gauges how quick the transmission of data would be through a given node all the available nodes [17, 67–72].
As we mentioned previously, our objective is to focus on a better understanding of situations in which a given oscillation band recruits specific brain networks for a given oscillation supporting a distinction between the forms identified with attention and development of imaginary movements. In order to compare the closeness centrality for the different tasks, statistical tests are performed for each node. In consequence, we establish the following statistical analysis protocol for the obtained results of closeness centrality: (a) we first perform a t-test between imagined and realized tasks for each of the considered bands, and (b) in order to obtain a more accurate statistical test we also perform a false discovery rate (FDR) correction. We choose the Benjamini–Hochberg methodology at a specified FDR of 5% as in Benjamini and Hochberg [73] and Nielsen et al. [74].
In the following we show the analysis performed for the visuomotor task 1 and its corresponding imagined task 2. Our outcomes are equivalent for the visuomotor/imagery tasks 3 and 4. Figures 2A,B, 3A,B display the mean of the interconnectivity for the 109 subjects when playing out the visuomotor assignment for the 64-channel EEG considering the diverse rhythms delta, theta, alpha 1 and alpha 2. Figures 2C,D, 3C,D are equivalent to Figures 2A,B, 3A,B but performing the imagined task. Figures 4A,B, 5A,B depict the network averaged values of the interconnectivity for performing the visuomotor task when considering the beta 1, beta 2, gamma 1 and gamma 2 bands, respectively. Figures 4C,D, 5C,D are the same as in Figures 4A,B, 5A,B but performing the imagined task. Small differences can be appreciated between the network of the realized and imagined tasks. Furthermore, Figures 6A,B show the node interconnectivity when considering the executed visuomotor task in view of the theta and alpha 1 bands for the electrode Oz (or node) in the visual cortex. Figures 6C,D show the node interconnectivity when considering the imagined task taking into account the same node in the visual cortex. Figures 6A–D depict also the averaged values considering 109 subjects. We can appreciate from the previous figures that there are differences in the network interconnectivity for the different conditions, however the current results are not quantifying how different the networks are. That is to say we can not infer from the previous figures which are the most relevant network structures. For completeness in the Supplementary Material we also include the analysis for all the other bands that are not being depicted in Figure 6.
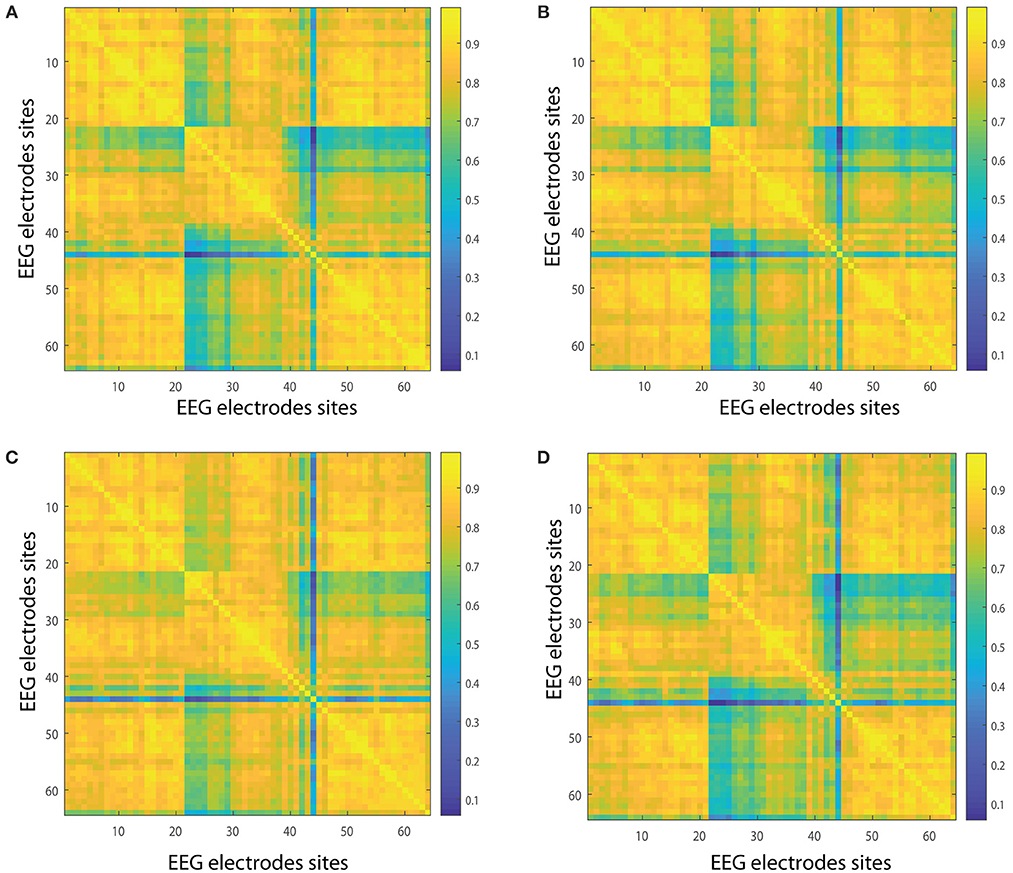
Figure 2. Network interconnectivity. (A,B) Show the network averaged values of the interconnectivity considering 109 subjects when performing the visuomotor task for the 64-channel EEG considering the different oscillation bands delta and theta. (C,D) Are the same as (A,B) but considering the imagined task. We consider D = 6 and τ = 1. Delta oscillation band corresponds to [1, 4)Hz and theta oscillation band to [4, 8)Hz.
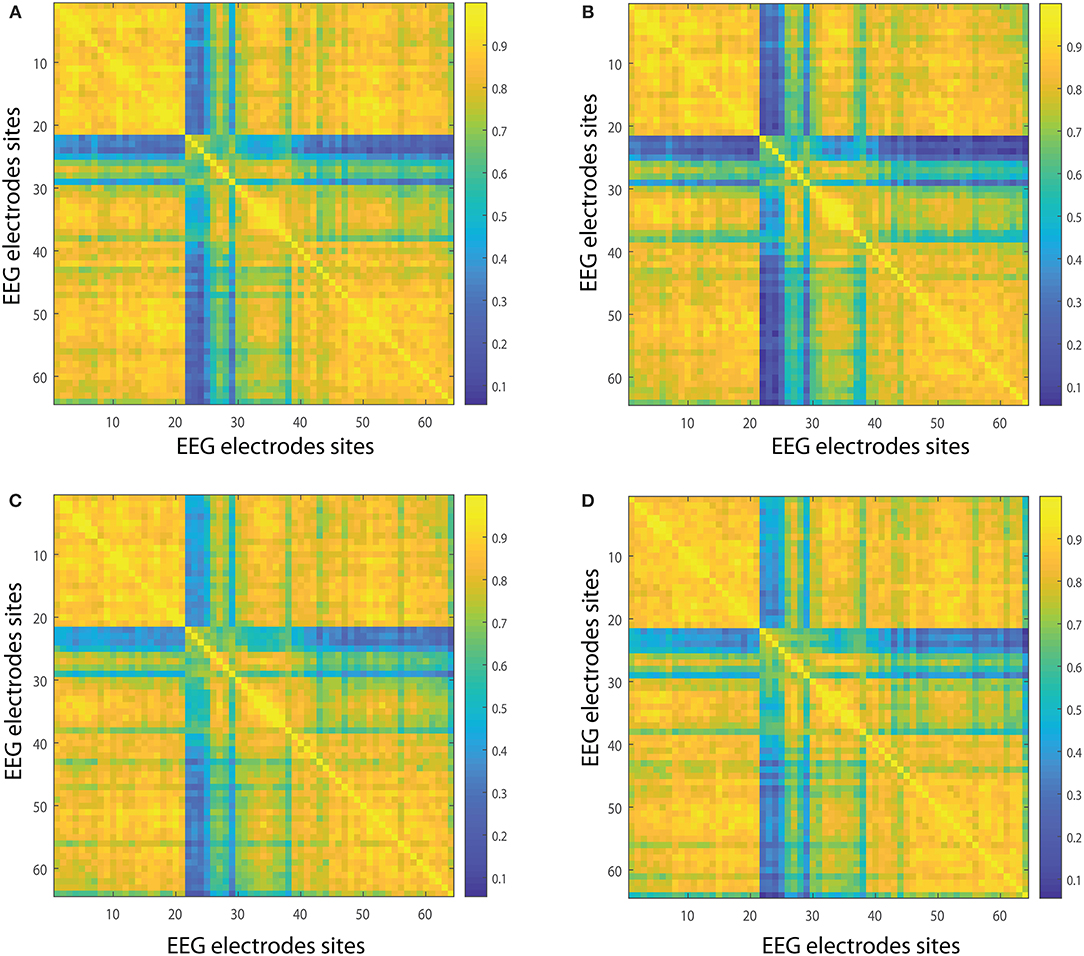
Figure 3. Network interconnectivity. (A,B) Show the network averaged values of the interconnectivity considering 109 subjects when performing the visuomotor task for the 64-channel EEG considering the different oscillation bands alpha 1 and alpha 2. (C,D) Are the same as (A,B) but considering the imagined task. We consider D = 6 and τ = 1. Alpha 1 oscillation band corresponds to [8, 10)Hz and alpha 2 oscillation band to [10, 13)Hz.
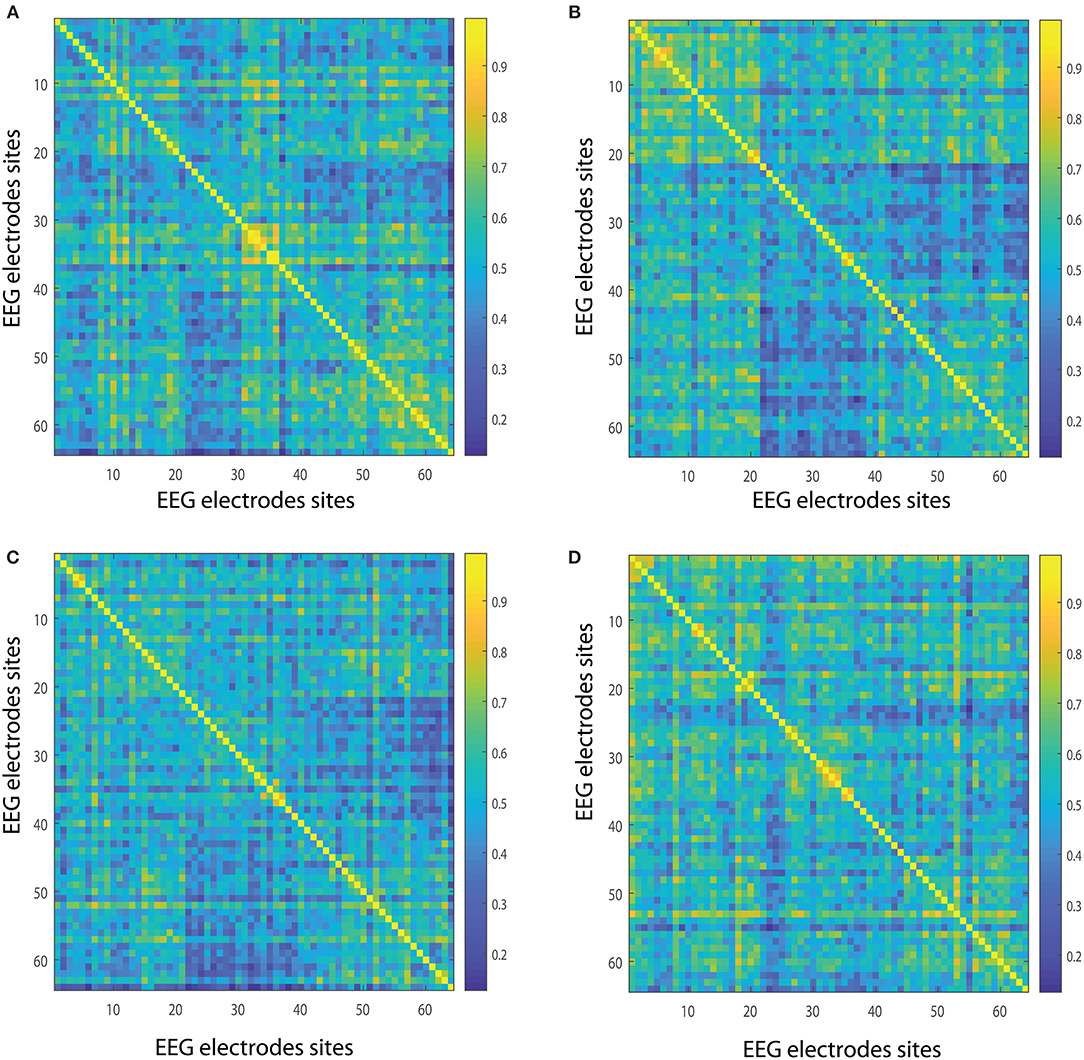
Figure 4. Network interconnectivity. (A,B) Show the network averaged values of the interconnectivity considering 109 subjects when performing the visuomotor task for the 64-channel EEG considering the different oscillation bands beta 1 and beta 2. (C,D) Are the same as (A,B) but considering the imagined task. We consider D = 6 and τ = 1. Beta 1 oscillation band corresponds to [13, 18)Hz and beta 2 oscillation band to [18, 31)Hz.
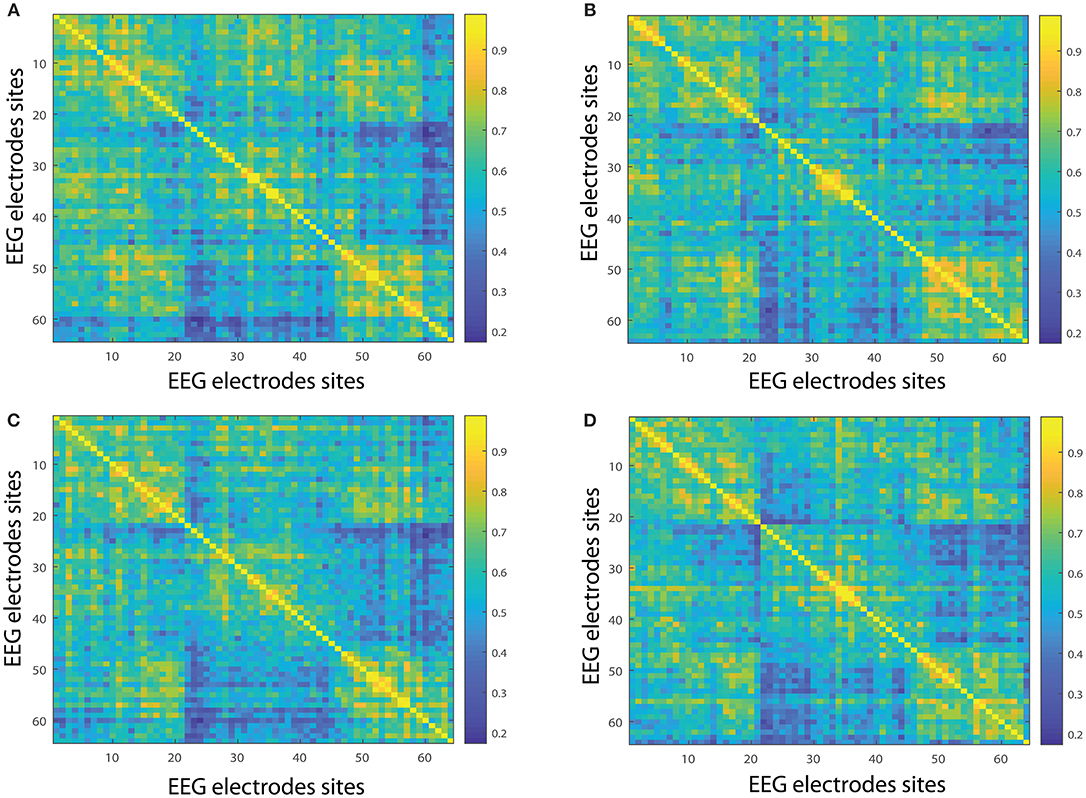
Figure 5. Network interconnectivity. (A,B) Show the network averaged values of the interconnectivity considering 109 subjects when performing the visuomotor task for the 64-channel EEG considering the different oscillation bands alpha 1 and alpha 2. (C,D) Are the same as (A,B) but considering the imagined task. We consider D = 6 and τ = 1. Gamma 1 oscillation band corresponds to [31, 41)Hz and gamma 2 oscillation band to [41, 50)Hz.
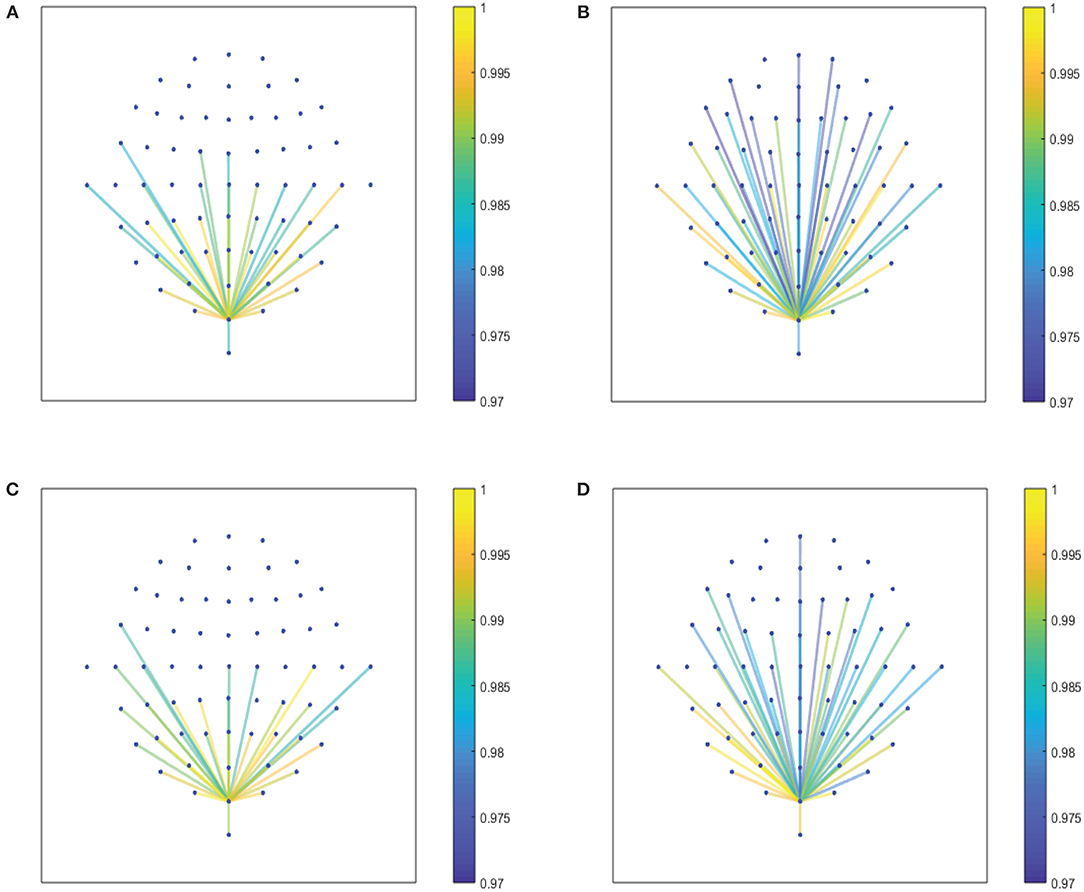
Figure 6. (A,B) Show the node interconnectivity when considering the executed visuomotor task and taking the theta and alpha 1 band for the electrode Oz (or node) in the visual cortex. (C,D) Show the node interconnectivity when considering the imagined task. We consider D = 6 and τ = 1.
In order to quantify the structural relevance of each node for the realized and imagined tasks, we investigate the closeness centrality of different nodes. Figures 7A,B show the closeness centrality , as in Equation (7), taking into account the average over 109 subjects for the 62-channel EEG considering the realized task when considering delta and theta, respectively. Figures 7C,D, are the same as in Figures 7A,B but performing the imagined task. Let us emphasize that Figures 8A, 9A depict the closeness centrality [as in Equation (7)] considering the alpha 1 and alpha 2 bands, respectively, taking into account the average over 109 subjects for the 62-channels EEG considering the realized task. Figures 8B, 9B are the same as in Figures 8A, 9A but executing the imagined task. Figures 10A,B, 11A,B depict the closeness centrality when realizing the visuomotor task considering the beta 1, beta 2, gamma 1 and gamma 2 bands, respectively. Figures 10C,D, 11C,D are the same as in Figures 10A,B, 11A,B but performing the imagined task. The electrodes T9 and T10 have been excluded from the current analysis of the nodes centrality as they are reference electrodes [43].
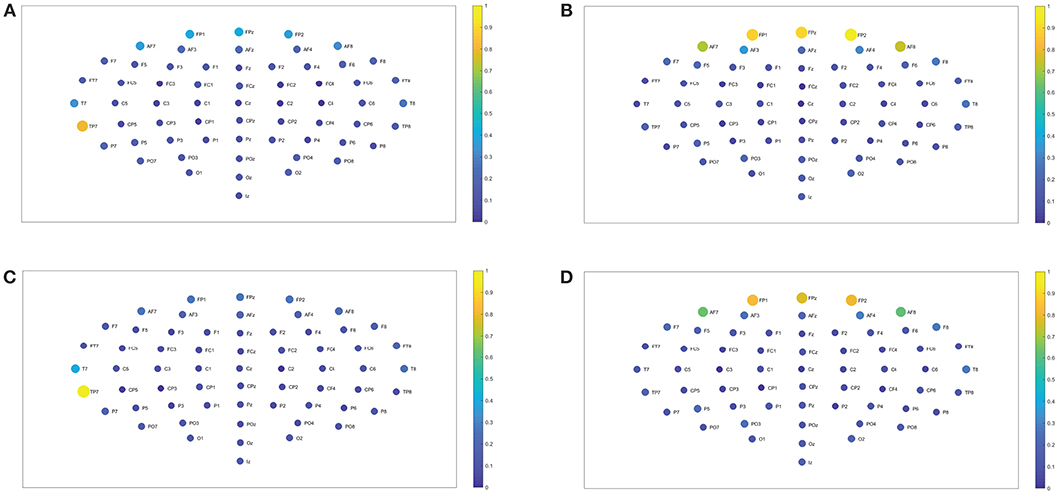
Figure 7. Closeness centrality. (A,B) Show the nodes' closeness centrality considering 109 subjects when performing the visuomotor task for the 62-channels EEG considering the different oscillation bands delta and theta. (C,D) Are the same as (A,B) but considering the imagined task. We consider D = 6 and τ = 1. Delta oscillation band corresponds to [1, 4)Hz and theta oscillation band to [4, 8)Hz.
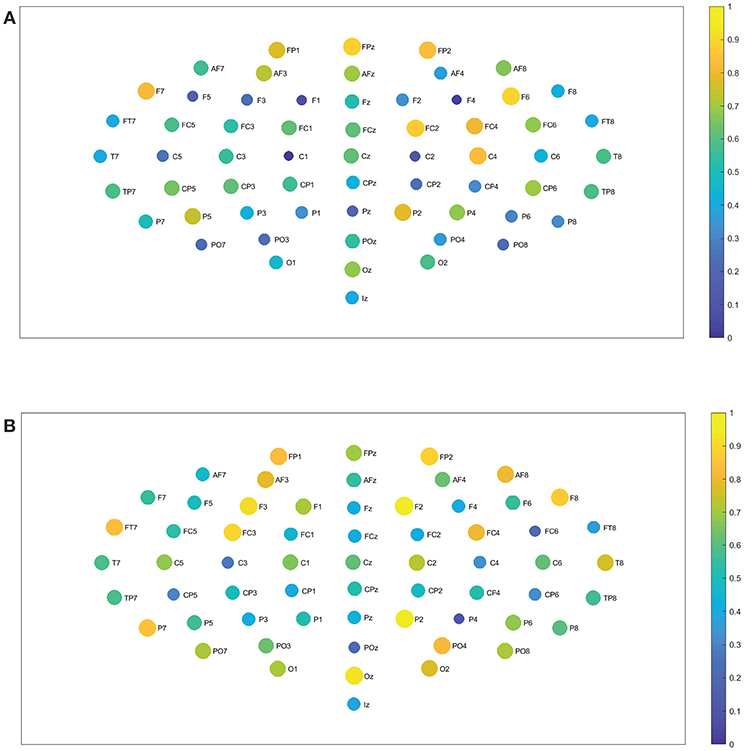
Figure 8. Closeness centrality. (A) Shows the node closeness centrality considering 109 subjects when performing the visuomotor task for the 62-channels EEG considering the oscillation band alpha 1. (B) Is the same as (A) but considering the imagined task. We consider D = 6 and τ = 1. Alpha 1 oscillation band corresponds to [8, 10)Hz.
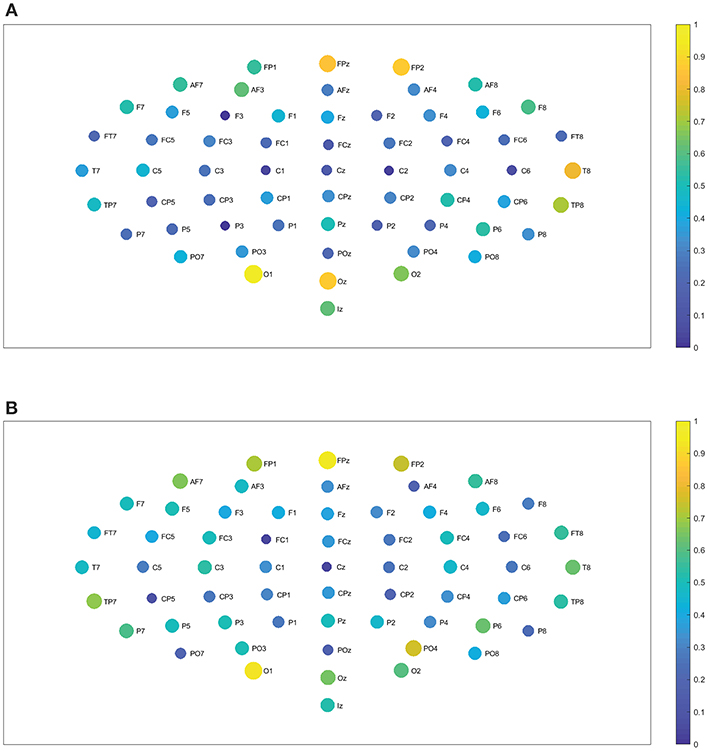
Figure 9. Closeness centrality. (A) Shows the node closeness centrality considering 109 subjects when performing the visuomotor task for the 62-channels EEG considering the oscillation band alpha 2. (B) Is the same as (A) but considering the imagined task. We consider D = 6 and τ = 1. Alpha 2 oscillation band corresponds to [10,13)Hz.
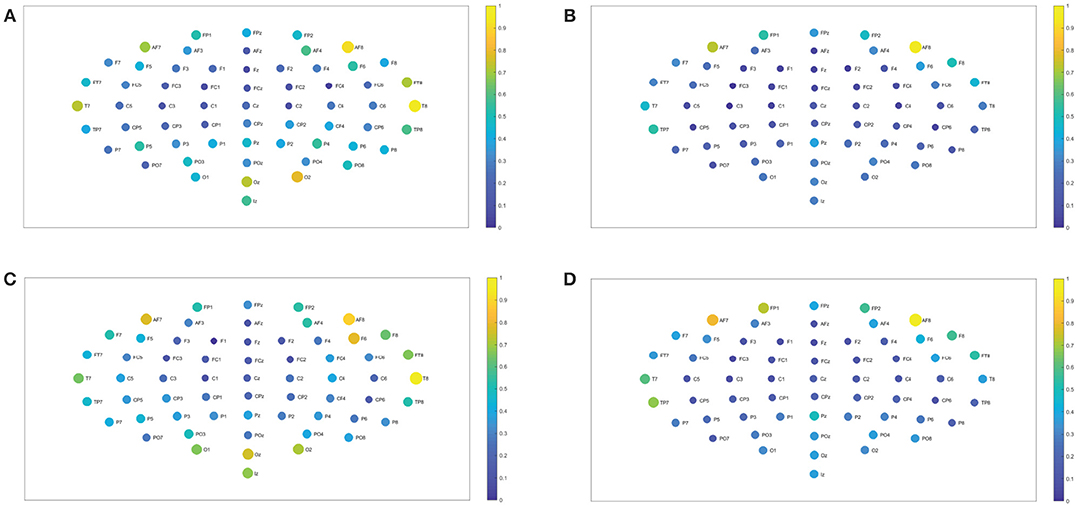
Figure 10. Closeness centrality. (A,B) Show the nodes' closeness centrality considering 109 subjects when performing the visuomotor task for the 62-channels EEG considering the different oscillation bands beta 1 and beta 2. (C,D) Are the same as (A,B) but considering the imagined task. We consider D = 6 and τ = 1. Beta 1 oscillation band corresponds to [13, 18)Hz and beta 2 oscillation band to [18, 31)Hz.
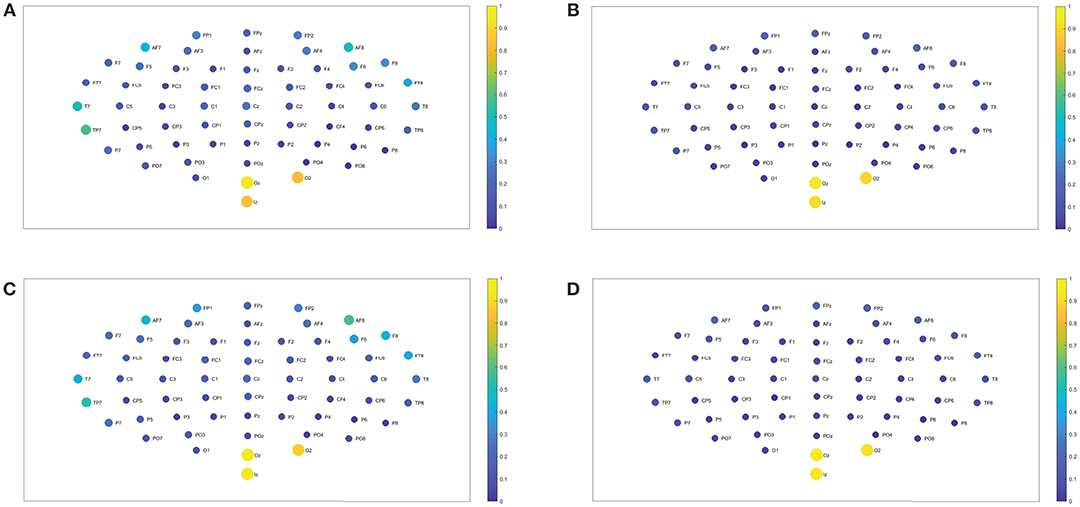
Figure 11. Closeness centrality. (A,B) Show the nodes' centrality considering 109 subjects when performing the visuomotor task for the 62-channels EEG considering the different oscillation bands gamma 1 and gamma 2. (C,D) Are the same as (A,B) but considering the imagined task. We consider D = 6 and τ = 1. Gamma 1 oscillation band corresponds to [31, 41)Hz and gamma 2 oscillation band to [41, 50)Hz.
In the case of the delta band, TP7 showed the highest closeness centrality for imagined and realized tasks. While in the theta band FP1, FPz, and FP2 depicted the highest centrality, both for both tasks. When considering the beta 1, the highest centrality is given by AF8, T8, O2, and Oz for the realized task. In the case of the imagined task, beta 1 has the highest centrality for AF7, AF8, F6, T8, and Oz. Beta 2 depicted the highest centrality in AF8 for the realized task and AF7, AF8 for the imagined task. Alpha 1 displays higher centrality for FP1, FPz, FP2, F7, F6, FC2, FC4, C4, and P2 for the realized task. When considering the imagined task alpha 1 showed the highest centrality for the nodes FP1, FP2, AF8, AF3, F3, F2, FT7, FC3, FC4, P2, P7, T8, PO4, Oz, and O2. In contrast the highest centrality of the alpha 2 band is given by the nodes FPz, FP2, T8, O1, and Oz for the realized task. The highest centrality of the imagined task is given by FPz, O1, and PO4 for alpha 2. Gamma 1 and gamma 2 presented the highest centrality in Oz, O2, and Tz for the realized and imagined tasks. Overall, it is important to point out that delta, theta, beta and gamma bands show lower closeness centrality and therefore depict a lower efficiency of the information of the data that could be transmitted through a given node to all the available nodes.
We find no significant differences between the realized and imagined tasks for most of the different bands, with the exception of the alpha 1 and alpha 2 bands that depict an unequal closeness centrality in several nodes of the network when comparing both tasks (see Figures 8A,B, 9A,B). After performing the FDR correction we find no significant differences between realized and imagined tasks when considering the delta, theta, beta 1, beta 2, gamma 1 and gamma 2 bands. In the case of the alpha 1 band (see Figures 8A,B), as mentioned we first performed a t-test between imagined and realized tasks obtaining 26 sites with significant differences. After performing a FDR correction we find 17 nodes/sites that present significant differences between imagined and non-imagined tasks. The electrodes that accomplished both tests were FPz, AF8, F7, F8, F3, F2, F6, FT7, AFz, FC3, C5, C2, T8, PO7, PO8, C1, and Oz. In the case of alpha 2 (see Figures 9A,B) there were eight sites that showed significant differences when performing the t-test, and six electrodes presented significant differences when applying a FDR correction between tasks. The electrodes that accomplished both tests were T8, TP7, P7, Oz, Iz, and PO4. Finally, for completeness, Figures 12A–C depict the results of the closeness centrality derived from statistical comparison between realized and imagined tasks for all the significant nodes within alpha 1. Figure 12D shows all the significant nodes within the alpha 2 band. Let us emphasize that the estimation of the network closeness centrality played an ultimate role, as when we implemented other network measures they did not produce any quantifiable difference between realized and imagined tasks for the different analyzed bands. Here, a systematic method in which nodes are weighted by closeness centrality was proposed. We demonstrate how the combination of the estimation of the Jensen–Shannon divergence of the BP probabilities across different nodes encompassed with calculations of the nodes closeness centrality has significance to distinguish imagined from realized motor tasks. We found a higher degree of closeness centrality in the case of the imagined task when compared with the realized ones, looking upon the alpha band. Thus these results shows that imagined processes are linked to changes in the alpha levels of centrality of the different nodes in the brain. Overall we emphasize that the alpha 1 band shows a higher level of closeness centrality than the other bands, therefore it depicts a quicker level information flow from a given node to other nodes.
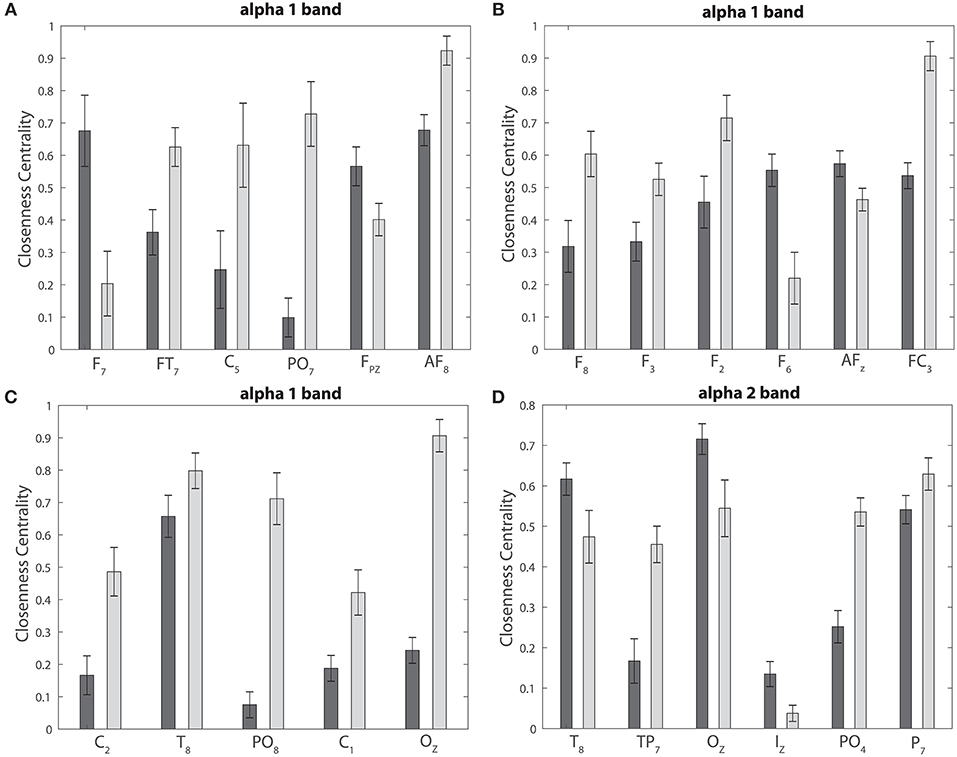
Figure 12. Statistical comparison and closeness centrality. (A–C) Depict the closeness centrality for the realized and imagined tasks considering the significant nodes for the alpha 1 band. (D) Is the same as (A–C) but considering the alpha 2 band. In all cases: dark gray bars, realized task; light gray bars, imagined task.
Attention is a mechanism required for focusing on what is critical at each moment of time, while suppressing any unessential information. This mechanism is also required to perform mental imagery, activating the synchronized network of multiple areas of the brain [45]. This synchronized activity of many neurons communicating with one another generates brain waves [45]. Brain waves are rhythmic oscillation patterns that can be registered as macroscopic oscillations utilizing EEG sensors on the scalp. The descriptions are quite broad: delta rhythmic are related to sleep states; theta might be entrance to further understanding learning and memory; alpha is usually related to attention, lucid thinking and integration; beta is present during the state of alert and problem solving; and gamma rhythms modulate perception and consciousness [45]. Moreover, brain oscillation rhythms can provide hints about the network functionality during imagined and realized tasks. In our current study we have considered the causality of the EEG signals using the BP approach, and through a statistical analysis that combined the Jensen–Shannon distance with the estimation of the closeness centrality we estimate the level efficiency on data transmission for a given node to all the available nodes taking into account the different rhythmic oscillation bands. Our current results emphasize the relevance of the alpha 1 band when detecting nodes that spread information with different efficiency through the graph for realized and imagined tasks.
We propose an effective technique that enables us to determine quantitatively the amount of the node closeness centrality inside the diverse rhythms considering the causality of the EEG signals. So as to do it thus, we exactly evaluate the distinctive highlights of oscillatory patterns considering keen estimates representing the causal structure of the signal utilizing the BP procedure. More specifically, we estimate the network interconnectivity by estimating the normalized Jensen–Shannon distance between the BP probabilities across different nodes, quantifying the non-linear dynamics of the EEG signals. We choose thereafter to compute the closeness centrality because it is a helpful measure to estimate the level of efficiency and convenience that gauges how quick the transmission of data would be through a given node all the available nodes [67–72]. Our methodology enables us to characterize the “closeness centrality properties” of various nodes inside the EEG rhythms, considering the causality of the signal and gathering the rising dynamical properties of the diverse oscillation patterns of the brain while performing distinctive visuomotor or imagery tasks. That is to say in the current paper, we analyze EEG network organization through the closeness centrality to study how to discriminate imagined and non-imagined tasks for the different rhythmic oscillations, showing that the alpha 1 bands allow us to discriminate between both assignments. Thus, we determine that the current approach combining the BP estimation with the Jensen-Shannon distance and the closeness centrality is a viable option for classification of hand realized and imagined signals.
It has been found that alpha frequency oscillations posses an important role in inhibitory control actions managing access of data of a cognition procedure and working memory [75–77]. Our findings show that several nodes within the gamma 1 band have an overall higher amount of closeness centrality during the imagined task in comparison to realized tasks. These higher amounts of centrality are located within the pre-motor, motor, and visual cortex areas. Thus, we can conclude that the imagined cognitive processes coincide with higher alpha 1 levels of closeness centrality of the different nodes. Our discoveries underscore the significance of the alpha band while taking part in cognitive tasks. That is in concurrence with strong proof that EEG alpha power is especially susceptible to different imagination-related requests, and that is happening due to creativity interventions [78]. We suggest that increased levels of centrality of several nodes for alpha 1 levels during the imaginative tasks might be important neurocognitive processes related to the internal attention required to perform mental imagery tasks.
As far as we can tell, there is still no ideal way to deal with the construction of a brain computer interphase (BCI) based on motor imagined tasks (MI-BCI, [79]). Specifically, features extraction and determination of relevant patterns and biomarkers for developing a successful MI-BCI are still under debate. Thus, it is extremely useful to investigate new methodologies that can offer a better understanding of how motor imagined patterns and connectivity differs from the non-imagined/realized activities. Recently, new research has investigated the possibility of taking measures that were originally developed in graph theory for data classification as they could provide important information about the connectivity [80]. In particular, a recent study has shown that graph metrics can be used for EEG-BCIs based on hand motor imagery graphs, as they are a feasible option for classification of hand motor imagined signals [81]. A recent study showed that the activity of the globulous pallidus is significantly reduced during imagined locomotion in patients with Parkinson disease when compared to healthy subjects [82]. Importantly the authors showed, using fMRI measures, that Parkinson disease patients displayed larger beta weights in the visuomotor zone amid envisioned turning contrasted with forward or in reverse while controls did not, and that overground marching speed is associated with beta weights amid imagined marching in a few locomotor areas in patients with Parkinson disease and not in controls [82]. The early detection and diagnosis based on extracting features of the neuronal networks EEG topology thought imagined tasks can be of ultimate help for understanding brain functions and neuronal diseases. When one performs a network analysis, markers of closeness centrality allow us to find the most relevant vertices within a graph. Applications means identifying the most important structure of the neuronal network, therefore the main relevance of the nodes' centrality is identifying the different networks that might be related with neural diseases. The detection of those differences between realized and imagined features is a relevant highlight of the EEG topology that can be of assistance for inferring the brain functions. Moreover, we plan future related work to perform estimations of wavelet phase coherence to obtain the connectivity matrices for the different oscillations bands and to estimate the betweenness centrality across them to identify possible nodes that might mediate communication with the other nodes for the different imagined/realized tasks as performed in Makarov et al. [83]. We suggest that the current tool that combines a subtle information theoretical approach, representing the causality of the signal together with a quantification of the levels of centrality for the different nodes, can be very useful for early detection of neuronal diseases.
The datasets EEGMIDB for this study can be found in the physionet database. (https://archive.physionet.org/pn4/eegmmidb/).
Authors contributed equally in the design of this research as well as in the writing of this paper. All authors have read and approved the final manuscript.
We gratefully acknowledge PIP 11220130100327CO (2014/2016) CONICET, Argentina (FM) and Universidad Nacional de La Plata, Argentina (project 11/X812).
The authors declare that the research was conducted in the absence of any commercial or financial relationships that could be construed as a potential conflict of interest.
The Supplementary Material for this article can be found online at: https://www.frontiersin.org/articles/10.3389/fphy.2019.00115/full#supplementary-material
1. Averbeck BB, Latham PE, Pouget A. Neural correlations, population coding and computation. Nat Rev Neurosci. (2006) 7:358–66. doi: 10.1038/nrn1888
2. Panzeri S, Schultz SR, Treves A, Rolls ET. Correlations and the encoding of information in the nervous system. Proc Biol Sci. (1999) 266:1001–12. doi: 10.1098/rspb.1999.0736
3. Panzeri S, Schultz SR. A unified approach to the study of temporal, correlational, and rate coding. Neural Comput. (2001) 13:1311–49. doi: 10.1162/08997660152002870
4. Montani F, Kohn A, Smith MA, Schultz SR. The role of correlations in direction and contrast coding in the primary visual cortex. J Neurosci. (2007) 27:2338–48. doi: 10.1523/JNEUROSCI.3417-06.2007
5. Montani F, Ince RA, Senatore R, Arabzadeh E, Diamond ME, Panzeri S. The impact of high-order interactions on the rate of synchronous discharge and information transmission in somatosensory cortex. Philos Trans R Soc A. (2009) 367:3297–310. doi: 10.1098/rsta.2009.0082
6. Montani F, Phoka E, Portesi M, Schultz SR. Statistical modelling of higher-order correlations in pools of neural activity. Phys A Stat Mech Appl. (2013) 392:3066–86. doi: 10.1016/j.physa.2013.03.012
7. Montangie L, Montani F. Quantifying higher-order correlations in a neuronal pool. Physica A. (2015) 421:388–400. doi: 10.1016/j.physa.2014.11.046
8. Montangie L, Montani F. Effect of interacting second- and third-order stimulus-dependent correlations on population-coding asymmetries. Phys Rev E. (2016) 94:1–5. doi: 10.1103/PhysRevE.94.042303
9. Montangie L, Montani F. Higher-order correlations in common input shapes the output spiking activity of a neural population. Phys A Stat Mech Appl. (2017) 471:845–61. doi: 10.1016/j.physa.2016.12.002
10. Montangie L, Montani F. Common inputs in subthreshold membrane potential: the role of quiescent states in neuronal activity. Phys Rev E. (2018) 97:060302. doi: 10.1103/PhysRevE.97.060302
11. Montani F, Oliynyk A, Fadiga L. Superlinear summation of information in premotor neuron pairs. Int J Neur Syst. (2017) 27:1650009. doi: 10.1142/S012906571650009X
12. Schalk G, McFarland DJ, Hinterberger T, Birbaumer N, Wolpaw JR. BCI2000: a general-purpose brain-computer interface (BCI) system. IEEE Trans Biomed Eng. (2004) 51:1034–43. doi: 10.1109/TBME.2004.827072
13. Schoffelen JM, Gross J. Source connectivity analysis with MEG and EEG. Hum Brain Map. (2009) 30:1857–65. doi: 10.1002/hbm.20745
14. Bassett DS, Bullmore ET. Human brain networks in health and disease. Curr Opin Neurol. (2009) 22:340–7. doi: 10.1097/WCO.0b013e32832d93dd
15. Bullmore ET, Sporns O. Complex brain networks: graph theoretical analysis of structural and functional systems. Nat Rev Neurosci. (2009) 10:186–98. doi: 10.1038/nrn2575
16. Bassett DS, Wymbs NF, Porter MA, Mucha PJ, Carlson JM, Grafton ST. Dynamic reconfiguration of human brain networks during learning. Nat Rev Neurosci. (2011) 108:7641–6. doi: 10.1073/pnas.1018985108
17. Stam CJ, Reijneveld JC. Graph theoretical analysis of complex networks in the brain. Nonlinear Biomed Phys. (2007) 1:3. doi: 10.1186/1753-4631-1-3
18. Martínez JH, Buldú JM, Papo D, Fallani F, Chavez M. Role of inter-hemispheric connections in functional brain networks. Sci Rep. (2018) 8:10246. doi: 10.1038/s41598-018-28467-x
19. Martínez JH, López ME, Ariza P, Chavez M, Pineda-Pardo JA, López-Sanz D, et al. Functional brain networks reveal the existence of cognitive reserve and the interplay between network topology and dynamics. Sci Rep. (2018) 8:10525. doi: 10.1038/s41598-018-28747-6
20. Barreiro M, Marti AC, Masoller C. Inferring long memory processes in the climate network via ordinal pattern analysis. Chaos. (2011) 21:013101. doi: 10.1063/1.3545273
21. Schieber TA, Carpi L, Diaz-Guilera A, Pardalos PM, Masoller C, Ravetti MG. Quantification of network structural dissimilarities. Nat Commun. (2017) 8:13928. doi: 10.1038/ncomms13928
22. Rubido N, Masoller C. Impact of lag information on network inference. C Eur Phys J Spec Top. (2018) 227:1243–50. doi: 10.1140/epjst/e2018-800070-1
23. Deza JI, Barreiro M, Masoller C. Assessing the direction of climate interactions by means of complex networks and information theoretic tools. Chaos. (2015) 25:033105. doi: 10.1063/1.4914101
24. Baptista MS, de Carvalho JX, Hussein MS. Finding quasi-optimal network topologies for information transmission in active networks. PLoS ONE. (2008) 3:e3479. doi: 10.1371/journal.pone.0003479
25. Baptista MS, Kurths J. Transmission of information in active networks. Phys Rev E Stat Nonlin Soft Matter Phys. (2008) 77(2 Pt 2):026205. doi: 10.1103/PhysRevE.77.026205
26. Rubido N, Martí AC, Bianco-Martínez E, Grebogi C, Baptista MS, Masoller C. Exact detection of direct links in networks of interacting dynamical units. N J Phys. (2014) 16:093010. doi: 10.1088/1367-2630/16/9/093010
27. Longden KD, Willshaw DJ. An evaluation of recurrent feedforward memory networks and their relevance to the hippocampus. Neurocomputing. (2002) 44:527–31. doi: 10.1016/S0925-2312(02)00413-7
28. Longden KD, Willshaw DJ. Asynchronous inputs and NMDA conductances predict excitatory responses in the cortical-cA1 pathway of the hippocampus. Network. (2007) 18:299–325. doi: 10.1080/09548980701587100
29. Pereda E, Quiroga RQ, Bhattacharya J. Nonlinear multivariate analysis of neurophysiological signals. Prog Neurobiol. (2005) 77:1–37. doi: 10.1016/j.pneurobio.2005.10.003
30. González GF, der Molen MJWV, Saric G, Bonte M, Tijms J, Blomert L, et al. Graph analysis of EEG resting state functional networks in dyslexic readers. Clin Neurophysiol. (2016) 127:3165–75. doi: 10.1016/j.clinph.2016.06.023
31. Stam CJ. Modern network science of neurological disorders. Nat Rev Neurosci. (2014) 15:683–95. doi: 10.1038/nrn3801
32. Nuñez A, Panetsos F, Avendaño C. Rhythmic neuronal interactions and synchronization in the rat dorsal column nuclei. Neuroscience. (2000) 100:599–609. doi: 10.1016/S0306-4522(00)00305-5
33. Bullmore ET, Bassett DS. Brain graphs: graphical models of the human brain connectome. Annu Rev Clin Psychol. (2011) 7:113–40. doi: 10.1146/annurev-clinpsy-040510-143934
34. Stam CJ, van Straaten ECW. The organization of physiological brain networks. Clin Neurophysiol. (2012) 123:1067–87. doi: 10.1016/j.clinph.2012.01.011
35. Toppi J, Astolfi L, Risetti M, Anzolin A, Kober SE, Wood G, et al. Different topological properties of EEG-derived networks describe working memory phases as revealed by graph theoretical analysis. Front Hum Neurosci. (2018) 11:637. doi: 10.3389/fnhum.2017.00637
36. Brazier MA, Casby JU. Crosscorrelation and autocorrelation studies of electroencephalographic potentials. Electroencephalogr Clin Neurophysiol. (1952) 4:201–11. doi: 10.1016/0013-4694(52)90010-2
37. Barlow JS, Brazier MA. A note on a correlator for electroencephalographic work. Electroencephalogr Clin Neurophysiol. (1954) 100:321–5. doi: 10.1016/0013-4694(54)90036-X
38. Bandt C, Pompe B. Permutation entropy: a natural complexity measure for time series. Phys Rev Lett. (2002) 88:174102. doi: 10.1103/PhysRevLett.88.174102
39. Rosso OA, Masoller C. Detecting and quantifying stochastic and coherence resonances via information-theory complexity measurements. Phys Rev E. (2009) 79:040106. doi: 10.1103/PhysRevE.79.040106
40. Rosso OA, Masoller C. Detecting and quantifying temporal correlations in stochastic resonance via information theory measures. Eur Phys J B. (2009) 69:37–43. doi: 10.1140/epjb/e2009-00146-y
41. Baravalle R, Rosso OA, Montani F. Rhythmic activities of the brain: quantifying the high complexity of beta and gamma oscillations during visuomotor tasks. Chaos. (2018) 28:075513. doi: 10.1063/1.5025187
42. Baravalle R, Rosso OA, Montani F. Causal shannon-fisher characterization of motor/imagery movements in EEG. Entropy. (2018) 20:660. doi: 10.3390/e20090660
43. Baravalle R, Rosso OA, Montani F. Discriminating imagined and non-imagined tasks in the motor cortex area: entropy-complexity plane with a wavelet decomposition. Phys A Stat Mech Appl. (2018) 511:27–39. doi: 10.1016/j.physa.2018.07.038
44. Montani F, Rosso OA, Schultz SR. Discrimination measure of correlations in a population of neurons by using the Jensen-Shannon divergence. AIP Conf Proc. (2007) 913:184–9. doi: 10.1063/1.2746745
45. Schalk G, Mellinger J. A Practical Guide to Brain-Computer Interfacing with BCI2000. London; Dordrecht; Heidelberg; New York, NY: Springer (2010).
46. Zanin M, Zunino L, Rosso OA, Papo D. Permutation entropy and its main biomedical and econophysics applications: a review. Entropy. (2012) 14:1553–77. doi: 10.3390/e14081553
47. Olivares F, Plastino A, Rosso OA. Ambiguities in the Bandt-Pompe's methodology for local entropic quantifiers. Physica A. (2012) 391:2518–26. doi: 10.1016/j.physa.2011.12.033
48. Olivares F, Plastino A, Rosso OA. Contrasting chaos with noise via local versus global information quantifiers. Phys Lett A. (2012) 376:1577–83. doi: 10.1016/j.physleta.2012.03.039
49. Rosso OA, Larrondo HA, Martín MT, Plastino A, Fuentes MA. Distinguishing noise from chaos. Phys Rev Lett. (2007) 99:154102. doi: 10.1103/PhysRevLett.99.154102
50. Rosso OA, Olivares F, Zunino L, Micco LD, Aquino ALL, Plastino A, et al. Characterization of chaotic maps using the permutation Bandt-Pompe probability distribution. Eur Phys J B. (2012) 86:116. doi: 10.1140/epjb/e2013-30764-5
51. Saco PM, Carpi LC, Figliola A, Serrano E, Rosso OA. Entropy analysis of the dynamics of El Niño/Southern Oscillation during the Holocene. Physica A. (2010) 389:5022–7. doi: 10.1016/j.physa.2010.07.006
52. Keller K, Sinn M. Ordinal analysis of time series. Physica A. (2005) 356:114–20. doi: 10.1016/j.physa.2005.05.022
53. Zunino L, Soriano MC, Fischer I, Rosso OA, Mirasso CR. Permutation-information-theory approach to unveil delay dynamics from time-series analysis. Phys Rev E. (2010) 82:046212. doi: 10.1103/PhysRevE.82.046212
54. Soriano MC, Zunino L, Rosso OA, Fischer I, Mirasso CR. Time scales of a chaotic semiconductor laser with optical feedback under the lens of a permutation information analysis. IEEE J Quant Electr. (2011) 47:252–61. doi: 10.1109/JQE.2010.2078799
55. Zunino L, Soriano MC, Rosso OA. Distinguishing chaotic and stochastic dynamics from time series by using a multiscale symbolic approach. Phys Rev E. (2012) 86:046210. doi: 10.1103/PhysRevE.86.046210
56. Rosso OA, Olivares F, Plastino A. Noise versus chaos in a causal Fisher-Shannon plane. Pap Phys. (2015) 7:070006. doi: 10.4279/pip.070006
57. Montani F, Rosso OA. Entropy–complexity characterization of brain development in chickens. Entropy. (2014) 16:4677–92. doi: 10.3390/e16084677
58. Shannon C, Weaver W. The Mathematical Theory of Communication. Champaign, IL: University of Illinois Press (1949).
59. Grosse I, Bernaola-Galván P, Carpena P, Román-Roldán R, Oliver J, Stanley HE. Analysis of symbolic sequences using the Jensen-Shannon divergence. Phys Rev E. (2002) 65:041905. doi: 10.1103/PhysRevE.65.041905
60. Wolpaw JR, McFarland DJ, Vaughan TM, Schalk G. The Wadsworth Center brain-computer interface (BCI) research and development program. IEEE Trans Neural Syst Rehabil Eng. (2003) 11:1–4. doi: 10.1109/TNSRE.2003.814442
61. Goldberger AL, Amaral LAN, Glass L, Hausdorff JM, Ivanov PC, Mark RG, et al. PhysioBank, PhysioToolkit, and PhysioNet: components of a new research resource for complex physiologic signals. Circulation. (2000) 101:e215–20. doi: 10.1161/01.CIR.101.23.e215
62. Huong NTM, Linh HQ, Khai LQ. Classification of left/right hand movement EEG signals using event related potentials and advanced features. In: 6th IFMBE Proceedings.Vol. 63, Singapore: Springer (2018). p. 209–2015.
63. Zebende GF, Filho FMO, Cruz JAL. Auto-correlation in the motor/imaginary human EEG signals: a vision about the FDFA fluctuations. PLoS ONE. (2017) 12:e0183121. doi: 10.1371/journal.pone.0183121
64. Kim Y, Ryu J, Kim KK, Took CC, Mandic DP, Park C. Motor imagery classification using Mu and Beta rhythms of EEG with strong uncorrelating transform based complex common spatial patterns. Comput Intell Neurosci. (2016) 2016:1–13. doi: 10.1155/2016/1489692
65. Belitski A, Gretton A, Magri C, Murayama Y, Montemurro MA, Logothetis NK, et al. Low-frequency local field potentials and spikes in primary visual cortex convey independent visual information. J Neurosci. (2008) 28:5696–709. doi: 10.1523/JNEUROSCI.0009-08.2008
66. Castellani G, Intrator N, Remondini D. Systems biology and brain activity in neuronal pathways by smart device and advanced signal processing. Front Genet. (2014) 5:253. doi: 10.3389/fgene.2014.00253
68. Freeman LC, Roeder D, Mulholland RR. Centrality in social networks: II. Experimental results. Soc Netw. (1979/80) 2:119–41.
69. Bolland JM. Sorting out centrality: an analysis of the performance of four centrality models in real and simulated networks. Soc Netw. (1988) 10:233–53.
70. Brandes U, Fleischer D. Centrality measures based on current flow. In: Diekert V, Durand B, editors. STACS 2005. Berlin; Heidelberg: Springer (2005). p. 533–44.
71. Brandes U, Borgatti SP, Freeman LC. Maintaining the duality of closeness and betweenness centrality. Soc Netw. (2016) 44:153–9. doi: 10.1007/978-3-540-31856-9_44
72. Borgatti SP. Centrality and network flow. Soc Netw. (2005) 27:55–71. doi: 10.1016/j.socnet.2004.11.008
73. Benjamini Y, Hochberg Y. Controlling the false discovery rate: a practical and powerful approach to multiple testing. J R Stat Soc Ser B Methodol. (1995) 57:289–300. doi: 10.1111/j.2517-6161.1995.tb02031.x
74. Nielsen JA, Zielinski BA, Ferguson MA, Lainhart JE, Anderson JS. An evaluation of the left-brain vs. right-brain hypothesis with resting state functional connectivity magnetic resonance imaging. PLoS ONE. (2013) 8:e71275. doi: 10.1371/journal.pone.0071275
75. Klimesch W. Evoked alpha and early access to the knowledge system: the P1 inhibition timing hypothesis. Brain Res. (2011) 1408:52–71. doi: 10.1016/j.brainres.2011.06.003
76. Klimesch W, Sauseng P, Hanslmayr S. The role of inhibition in task switching: a review. Brain Res. (2010) 17:1–14. doi: 10.3758/PBR.17.1.1
77. Wolff N, Zink N, Stock AK, Beste C. On the relevance of the alpha frequency oscillation's small-world network architecture for cognitive flexibility. Sci Rep. (2017) 7:13910. doi: 10.1038/s41598-017-14490-x
78. Fink A, Benedek M. EEG alpha power and creative ideation. Neurosci Biobehav Rev. (2014) 44:111–23. doi: 10.1016/j.neubiorev.2012.12.002
79. Hamedi M, Salleh SH, Noor AM. Electroencephalography motor imagery brain connectivity analysis for BCI: a review. Neural Comput. (2016) 28:999–1041. doi: 10.1162/NECO_a_00838
80. Asensio-Cubero J, Gan JQ, Palaniappan R. Multiresolution analysis over graphs for a motor imagery based online BCI game. Comput Biol Med. (2016) 68:21–6. doi: 10.1016/j.compbiomed.2015.10.016
81. Filhoa CAS, Attux R, Castellano G. Can graph metrics be used for EEG-BCIs based on hand motor imagery? Biomed Signal Process Control. (2018) 40:359–65. doi: 10.1016/j.bspc.2017.09.026
82. Peterson DS, Pickett KA, Duncan RP, Perlmutter JS, Earhart GM. Brain activity during complex imagined gait Tasks in Parkinson disease. Clin Neurophysiol. (2014) 5:995–1005. doi: 10.1016/j.clinph.2013.10.008
Keywords: neuronal dynamics, EEG, alpha oscillations, visuomotor tasks, imagined tasks
Citation: Baravalle R, Guisande N, Granado M, Rosso OA and Montani F (2019) Characterization of Visuomotor/Imaginary Movements in EEG: An Information Theory and Complex Network Approach. Front. Phys. 7:115. doi: 10.3389/fphy.2019.00115
Received: 12 March 2019; Accepted: 31 July 2019;
Published: 20 August 2019.
Edited by:
Chris G. Antonopoulos, University of Essex, United KingdomReviewed by:
Emanuela Formaggio, University of Padova, ItalyCopyright © 2019 Baravalle, Guisande, Granado, Rosso and Montani. This is an open-access article distributed under the terms of the Creative Commons Attribution License (CC BY). The use, distribution or reproduction in other forums is permitted, provided the original author(s) and the copyright owner(s) are credited and that the original publication in this journal is cited, in accordance with accepted academic practice. No use, distribution or reproduction is permitted which does not comply with these terms.
*Correspondence: Osvaldo A. Rosso, b2Fyb3Nzb0BnbWFpbC5jb20=
Disclaimer: All claims expressed in this article are solely those of the authors and do not necessarily represent those of their affiliated organizations, or those of the publisher, the editors and the reviewers. Any product that may be evaluated in this article or claim that may be made by its manufacturer is not guaranteed or endorsed by the publisher.
Research integrity at Frontiers

Learn more about the work of our research integrity team to safeguard the quality of each article we publish.