 Rainer A. Leitgeb
 Bernhard Baumann
94% of researchers rate our articles as excellent or good
Learn more about the work of our research integrity team to safeguard the quality of each article we publish.
Find out more
REVIEW article
Front. Phys. , 12 October 2018
Sec. Medical Physics and Imaging
Volume 6 - 2018 | https://doi.org/10.3389/fphy.2018.00114
This article is part of the Research Topic Multimodality Molecular Imaging View all 8 articles
Optical medical imaging techniques in general exhibit outstanding resolution and molecule-specific contrast. They come however with a limited penetration in depth and small field of view. Multimodal concepts help to combine complementary strengths of different imaging technologies. The present article reviews the advantages of optical multimodal imaging concepts using optical coherence tomography (OCT) as core technology. In particular we first discuss polarization sensitive OCT, Doppler OCT and OCT angiography, OCT elastography, and spectroscopic OCT as intramodal concepts. To highlight intermodal imaging concepts, we then chose the combination of OCT with photoacoustics, and with non-linear optical microscopy. The selected multimodal concepts and their particular complementary strengths and applications are discussed in detail. The article concludes with notes on standardization of OCT imaging and multimodal extensions.
Optical imaging has always been the most intuitive modality in medical diagnostics, starting from the most basic standard visual inspection of the patients' general appearance, to the pathologic assessment of tissue using microscopy. Modern imaging technologies advance the capabilities of optics to provide not only morphologic information, but also functional physiologic, as well as biochemical metabolic information. “Seeing is believing” has certainly been an important paradigm, although especially in medical diagnostic imaging, the uptake of new technologies has always been very reluctant. Every imaging technology has its specific contrast mechanism leading to images that need careful interpretation by correlation with true anatomy. While novel mechanisms may often provide new insights into structure and function, they also come with their specific artifacts that need to be understood. Those are related with the handling of the imaging probes, sample preparation, patient motion, etc. Therefore, in daily clinical practice, histology is still the workhorse for medical diagnostics, and serves as golden standard for novel imaging modalities. Unfortunately, the preparation of histologic samples is a very tedious, time costly, and inherently destructive process: starting from the in some cases unguided tissue extraction, to the fixation of the tissue, further processing by dehydration, clearing, and embedding, to the final sectioning and staining. The pathohistologic examination is finally done under a microscope in the office of the pathologists. This workflow becomes particularly critical during intraoperative tumor extraction, when tumor borders need to be assessed precisely. Slightly faster tissue examination is then achieved by cryo-fixation of biopsies, but the examination is still done offline outside the surgical room. It is therefore impossible to assess the full tumor margin. As a result, head and neck surgery sees inadequate margins 85% of the time. The same holds for breast cancer surgery, with reported 20–70% of cases [1]. Inadequate assessment of tumor borders results in additional surgery due to tumor recurrence with in most cases strong reduction of quality of life of the patients. Obviously there is a strong need for methods that allow for virtual optical or digital biopsy by in-situ quasi-histologic examination without the need of tissue extraction.
The strongest hopes are multimodality systems that combine in a complementary manner strengths of different imaging modalities across various physical contrast mechanisms. They have already found entrance in clinical practice. For example, photodynamic image guidance using extrinsic fluorophores as red flag technique to locate suspicious lesions during endoscopic examination. Another recent example is fluorescence guidance during brain tumor surgery using 5-aminolevulinic acid (5ALA). Maeda et al. described the enhanced permeability and retention (EPR) effect for lipid and macromolecular agents that helps to accumulate fluorescent molecules in tumors [2]. The enhanced vascular permeability supports rapid tumor growth by sustaining an adequate supply of nutrients and oxygen [2].
However, for determination of tumor grade, a cellular resolution technique is needed, such as confocal microscopy. Still, the combination of high cellular resolution with large field of view visual guidance during surgery is challenging with a single imaging modality alone. A commercial surgical microscopy platform therefore combines the surgical binocular view with an external endoscope that can be brought in close contact with the tissue of interest for virtual biopsy. The images are sent to the local pathologist that can then examine the tissue via monitor, quasi on-site. However, there is still information missing on the invasiveness of such tumors. Information, that is important to evaluate the tumor stage. This would for example mean a decision of whether a superficial early stage tumor can be removed right during examination, or the patient needs to come back for excision of a late stage invasive tumor in a full surgical setting.
Optical coherence tomography (OCT) is an optical technique for three-dimensional imaging in real-time that has been introduced about 25 years ago [3]. OCT promised to bridge the gap between large field of view tissue inspection to high cellular resolution tissue examination with the possibility to penetrate into tissue as deep as 2 mm. This penetration depth is sufficient for assisting in the decision on tumor invasiveness [4]. It was however soon found that the limited tissue specific contrast mechanism, being backscattering alone, renders precise quasi-histologic assessment a difficult task. Again, the mitigation of this drawback is to exploit multimodal extensions of OCT. This can on the one hand be achieved by functional extensions of OCT itself, or by recruiting in addition molecularly sensitive optical technologies.
The present article is therefore dedicated to highlight recent developments for intra- and inter- multimodal imaging based on OCT. We deliberately leave out the sheer endless permutation of the many other optical techniques such as fluorescence imaging, diffuse optical tomography, confocal microscopy, etc., and the combination with non-optical techniques such as ultrasound [5], magnet resonance imaging, positron emission tomography, radiography, etc. We believe that the multimodal concept of optical techniques can be well exemplified by choosing OCT and selected complementary techniques, and by highlighting the gained benefit through their combination.
Since the name OCT has been coined in 1991 [3], the method has been rapidly evolving as mature medical imaging technology until today [6]. The success story started with its application in retinal imaging, where OCT provided the perfect tool for monitoring and guiding the treatment of proliferative age-related macular degeneration (AMD) with by that time novel anti-vascular endothelial growth factor (VEGF) drugs. Soon other applications in endoscopy, intravascular imaging, and dermatology followed. OCT may be seen as missing link between high-resolution microscopy on the one end, and deep penetration but low resolution tomography techniques on the other end. Its performance parameters are benchmarked against established medical imaging technologies in Figure 1. Since standard OCT alone does not provide molecular contrast, it is already plotted in combination with photoacoustics and non-linear optical microscopy.
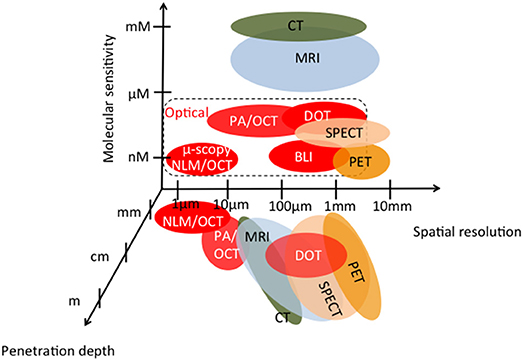
Figure 1. Medial imaging technologies as function of penetration depth, molecular sensitivity, and spatial resolution; MRI, magnetic resonance imaging; CT, computed tomography: SPECT, spectroscopic CT; PET, positron emission tomography; PA/OCT, multimodal photoacoustics -OCT; NLM/OCT, multimodal non-linear microscopy-OCT; BLI, bioluminescence imaging; DOT, diffuse optical tomography; [adapted from [7, 8]].
Despite the relatively low penetration depth of a few millimeters, OCT shared with optical microscopy the high resolution down to a few micrometers and below without the need of contact to the tissue. Therefore, it raised hope to be the tool of choice for in-situ virtual biopsy for early stage tumors overcoming the need of tissue extraction. Despite the immense advancements of this imaging technology by several orders of magnitudes in resolution, imaging speed, and sensitivity, this hope has not yet been fully manifested. The main reason is the contrast mechanism being limited to backscattering alone. The scattering property of tissue is a rather unspecific contrast, which renders it a challenging task for example to grade tumors or to assess metabolic cell states. Nevertheless, it provides high structural sensitivity with resolution close to the level of histopathology, combined with high imaging speed. This is due to the coherent amplification scheme of OCT that allows achieving shot noise limited detection even at short exposure times. OCT is based on partial coherence interferometry (PCI), which provides a one dimensional backscattered intensity profile in depth, also called A-scan. First implementations of PCI applied in the biomedical field were presented by Fercher in 1990 [9]. Combining PCI with lateral scanning to produce full tissue tomograms or B-scans gave birth to the method of OCT in 1991 [3]. Soon after, in-vivo images of retinal tissue have been presented [10, 11]. The method itself was originally based on time-domain (TD) PCI, where broad bandwidth light is split in amplitude into a reference and sample arm beam. After recombination, the superposition of both beams gives rise to visible interference fringes if the optical path length difference is less than the temporal coherence length. Scanning the reference arm length allows then interrogating the axial sample structure using heterodyne detection, with an axial resolution given by the temporal coherence length [12]. The coherence gating together with the confocal gate efficiently reduces multiply scattered light and enables imaging even in strongly scattering tissue. The axial resolution δz is given only by the spectral properties of the light source and is decoupled from the lateral resolution, unlike most other optical imaging approaches. It is related to the center wavelength λ and spectral bandwidth Δλ of the light source as (assuming a Gaussian spectrum) [13]
The relation is plotted for various center wavelengths in Figure 2. For a center wavelength of 800 nm, a bandwidth larger than 200 nm is required to achieve an axial resolution of about 1 μm [14]. At 400 nm center wavelength the required bandwidth reduces to only 50 nm. Shorter wavelength light has however the disadvantage of experiencing stronger scattering (see Figure 3) and therefore achieves only rather shallow penetration depths. Also, for ophthalmic applications, near infrared light at 800 nm or alternatively at 1060 nm is better tolerated as it is (almost) invisible to the human eye. Novel swept sources operating at 1060 nm enable better penetration into deep structures in the back of the eye, such as the choroid [15]. Longer wavelength light experiences less scattering, however, water absorption becomes dominating. An optimal compromise for imaging in endoscopy, dermatology, or intravascular imaging seems to be 1300 nm. Dental applications and neuroimaging by OCT could even employ longer wavelength light toward 1550 or 1700 nm [6, 16, 17].
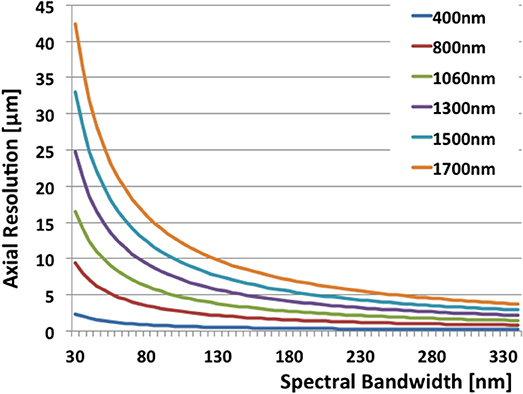
Figure 2. The relation of axial resolution and spectral bandwidth in OCT according to Equation 1 for typical wavelengths.
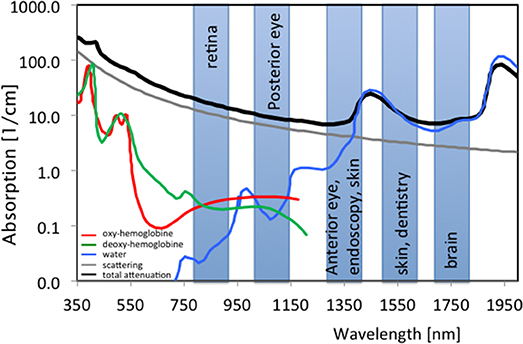
Figure 3. Spectral absorption of water and tissue chromophores together with scattering; shaded boxes are typical center wavelengths used for OCT imaging with indicated applications; green, Hb; red; HbO2, blue, H2O; gray, scattering; black, typical tissue attenuation.
TD OCT reached already its limits in detection sensitivity for medical applications at moderate A-scan rates of a few kHz. A breakthrough in OCT imaging has been achieved by recognizing the sensitivity advantage of Fourier domain (FD) OCT [18–20]. Suddenly, A-scan rates of several 10 kHz became feasible, without compromising image quality. Modern swept source technology boosted the imaging rates of research instruments even beyond 1 MHz [21] whereas 100 kHz have become standard in today's commercial OCT platforms. What is more, the paradigm shift concerning imaging speed gave new impetus to multimodal functional extensions of OCT such as Doppler OCT, or OCT elastography, and ultimately enabled successful OCT angiography. Finally, the goal to provide real time feedback to surgeons in a surgical microscope through augmented reality with 3D real time display of OCT data, has become technologically possible [22, 23]. Combining the astounding imaging capabilities of OCT with highly molecule-specific technologies in a multimodal platform will therefore be an important step toward optical digital biopsy.
Table 1 gives an overview about functional extensions of OCT and their particular additional contrast mechanisms. The most advanced of those extensions are Doppler OCT including the variant of OCT angiography (OCTA), and polarization sensitive OCT (PS OCT). Other techniques, such as OCT spectroscopy or OCT elastography (OCE) have demonstrated their strong potential for future applications in research settings. In the following, we will give a short description of those modalities and the additional contrast that can be achieved.
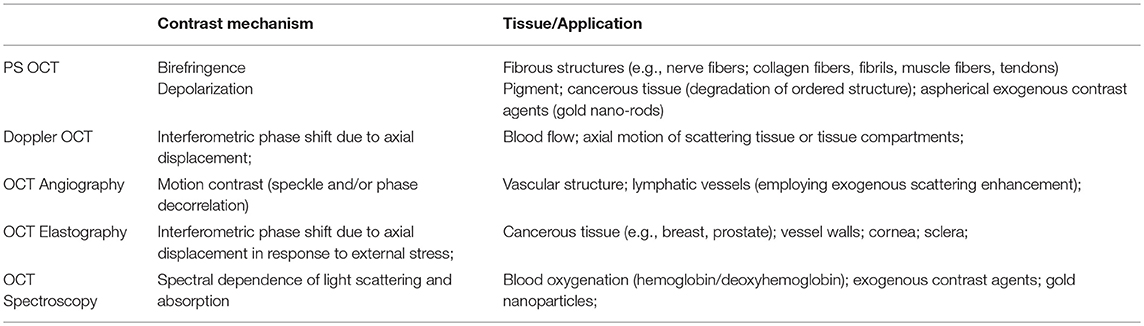
Table 1. Functional OCT extensions, their contrast mechanisms, and applications.
Doppler OCT (DOCT) had been one of the first functional extensions of OCT [24]. It senses velocities of sample structures along the observation direction. Typical moving structures in tissue are flowing red blood cells. DOCT gives therefore immediate access to tissue perfusion. In TD OCT the axial velocity of red blood cells adds to the scanning velocity of the reference arm. This increases or decreases the heterodyne detection frequency due to the Doppler effect as
where λ is the center wavelength of the light source, vr is the velocity of the moving reference arm, and vs is the axial velocity component of the sample at motion. Hence frequency analysis of the OCT signal allows extracting the velocity information from the local Doppler frequency shift f D [25, 26]. A more sensitive method for quantifying axial sample motion is based on analyzing the interference fringe phase [27]. In fact, for velocity quantification, the temporal phase difference between successive signals is determined as
where Δτ is the time difference between successive A-scans, related to the A-scan rate asfA−scan = 1/Δτ. The unambiguous maximal speed is given as v = ±λ/(4Δτ). For typical A-scan rates of TDOCT of 100 Hz−1 kHz in retinal imaging, one has access to flow velocities between 20 and 200 μm/s. This range is too slow for assessing flow within most vessels of the retinal bed. A significant boost to the performance of DOCT has been given by the introduction of FD OCT and its intrinsic higher speed. With A-scan rates of 10 kHz up to 100 kHz, flow speeds of 2 mm/s up to 20 mm/s were readily accessible [28]. The minimal detectable velocity is given by the phase noise of the OCT system. Again FD OCT, which does not need mechanical scanning of the coherence gate, is intrinsically highly phase stable and exhibits therefore an outstanding dynamic range for sensing axial flow velocities [18, 29]. Note, however that vs is the axial velocity component of the total sample velocity, i.e., the component in direction of the OCT beam. In order to determine the actual total velocity, it is important to know the so called Doppler angle between the observation direction and the sample motion direction. The full expression is given as Leitgeb et al. [24] vs, tot = vs/cos α Extraction of the Doppler angle has been the subject of several developments in DOCT. The most stable solutions are to employ multiple beams for flow triangulation, or to use en-face flow determination [30–33]. DOCT has not found large clinical acceptance, since altered flow as disease biomarker has not been validated yet in large clinical studies as disease specific biomarker. Still, it yields unique information on perfusion dynamics, which, when combined with spectroscopy for determining tissue oxygen saturation, would yield important metabolic information not available with any other technique. A recent study in the retina demonstrated how to determine tissue oxygen consumption based on the fact that the eye is an perfusion end organ [34]: arterial flow entering the eye must also leave the eye as venous flow. Hence by measuring the total flow together with the oxygen saturation the oxygen consumption is obtained, which offers exciting pharmacological research capabilities. The combination of DOCT with spectroscopy has been pushed by the availability of coherent light sources in the visible range, where chromophores such as hemoglobin exhibit strongest absorption (see Figure 3). Visible OCT as multimodal platform is therefore one of the promising current trends in OCT technology development [35–37].
The local phase change within vessels introduced by flowing red blood cells yields a natural blood flow contrast within tissue without the need for additional contrast agents [38]. For higher flow velocities or equivalently larger A-scan times the phase will be increasingly decorrelated [39]. Analyzing phase differences between B-scans as opposed to A-scans gives even rise to phase decorrelation within smallest capillaries [40]. This is the basis of modern OCT angiography: using OCT signal fluctuation or phase decorrelation to contrast flow against static bulk tissue without actually quantifying the flow [41]. The motion contrast is readily achieved by calculating average differences between intensity tomograms taken at the same location [42, 43]. Alternatively, phase differences or variances, or even differences between the full complex signals can be evaluated [41, 44, 45]. In all cases, motion contrast OCT angiography across a full 3D volume is achieved. In ophthalmology for example, standard angiography has to be performed by intravenous injection of contrast dyes. Fluorescein angiography is used to contrast retinal vasculature, whereas for the deeper choroidal vasculature indocyanine green (ICG) is administered, with the risk of anaphylactic shock and other adverse side effects. The procedure itself takes up to 20 min and needs special trained personnel. OCT angiography (OCTA) on the other hand is needle free and contrasts the full vasculature across all depths after a contact-free retinal scan of a few seconds. A small drawback of OCTA is its dependence on the motion of blood cells within the vessels, leakage is therefore hard to detect. Hence, a full picture is obtained, if necessary for accurate diagnosis, by complementing it with standard fundus angiography. An important advantage of OCTA is its intrinsic co-registration with morphologic features obtained with OCT. This intramodal multimodality concept gives new impetus to fields such as dermatology, where OCT alone has not yet reached the same importance as in ophthalmology. Angiography provides new biomarkers of disease that are characteristic for certain diseases and help for a better diagnosis by complementing the pure morphologic features. It can be further combined with OCT spectroscopy to better focus on the attenuation due to blood against static bulk tissue. OCTA is already commercially available for application in ophthalmology and dermatology.
Besides DOCT, polarization sensitive (PS) OCT is the most advanced extension of OCT imaging. Microstructural order of tissue and in general light-tissue interactions affect the polarization state of backscattered light. Resolving the polarization dependent light scattering gives access to those tissue specific parameters yielding contrast beyond intensity backscattering alone. The contrast mechanisms are birefringence, diattenuation or dichroism, and depolarization (see Figure 4). OCT detects coherent light, therefore is not capable to assess depolarization in a direct manner. Directly accessible are linear birefringence and diattenuation. Birefringent materials exhibit refractive indices that depend on the polarization orientation and on the propagation direction of light. Since the refractive index defines the propagation speed of light within the material, the transit time for the orthogonal polarization components through the material is different. Hence, one of the polarization components appears retarded with respect to the other component depending on the material thickness and the refractive index difference. Fibrous tissue consisting of parallel fibrils with a matrix of different refractive index exhibits form birefringence (Figure 4A). Examples are nerve fibers, muscle fibers, or collagen rich tissue. Diattenuation describes losses through absorption that in general can be different for the orthogonal polarization states (Figure 4B) [48–52]. It has been shown, however, that this polarization dependent effect does not seem to play a major role in biological tissue [50]. Depolarization of light may be caused by multiple scattering, as well as scattering by non-spherical particles, e.g., by gold nano-rods [53]. It has been observed in strongly pigmented tissue like the retinal pigment layer, where depolarization is caused by melanin granules (Figure 4C) [54]. There are different mathematical descriptions of material polarization effects. The most complete formalism is based on Mueller matrices and Stokes parameters that include partial polarization and depolarization. OCT on the other hand detects only fully coherent light. Thus, the measured degree of polarization will always be unity [55]. Therefore, a more convenient way to describe polarization effects in OCT is the Jones formalism [56]. A polarizing material can be described by four complex valued components of the Jones matrix, with the two component Jones vector describing the polarization state. The seven independent variables of the matrix together with a common phase factor define the phase retardation between the orthogonal polarization states, orientation of the optical axis, the diattenuation, and the orientation of the axis of diattenuation. The elements of the Jones matrix and the vector components can be converted into Mueller matrix elements and the Stokes vector [51, 57–62]. The Stokes vector components define the degree of polarization (DOP). For OCT, this definition has been generalized to the degree of polarization uniformity (DOPU) [63, 64]. The DOPU can be regarded as a DOP analyzed across several speckle grains. Although the DOP stays constant within a single speckle grain, the DOPU might become smaller than unity, since adjacent speckles might exhibit different polarization states. Obviously the analysis window defines the resolution for the DOPU map, which has been improved by high-resolution imaging, temporal, and 3D averaging [65–67]. Other developments define a depolarization index, or a differential depolarization index, that is independent of the input polarization state at the sample [68, 69].
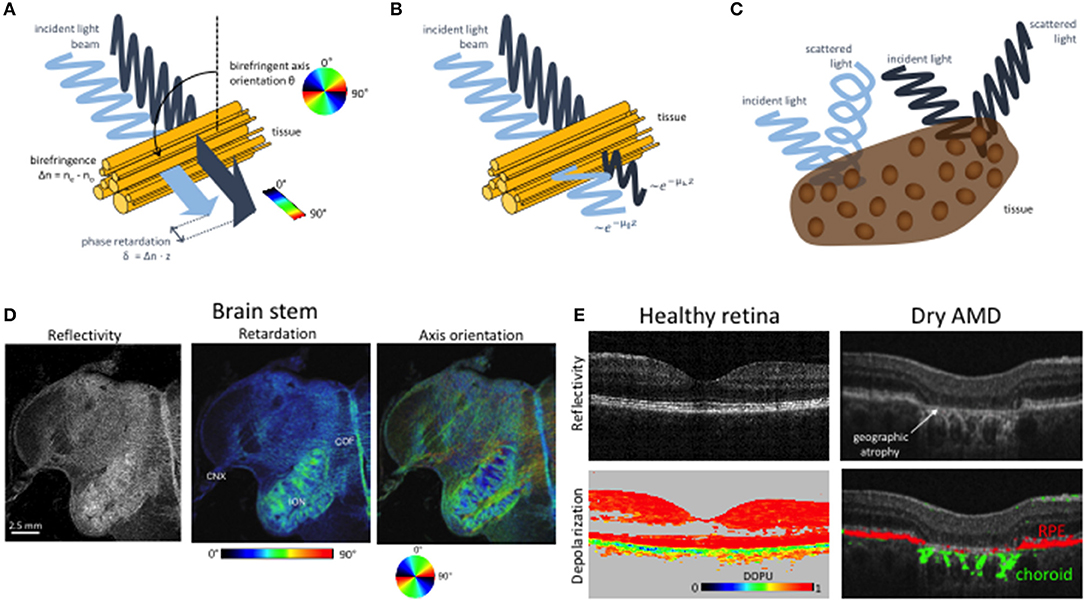
Figure 4. Imaging tissue with polarization contrast using PS OCT. (A) Cartoon of birefringence in fibrous tissue. Light polarized parallel and perpendicular to the birefringent axis propagates at different speeds. The accumulated relative phase retardation δ as well as the birefringent axis orientation θ can be measured by PS-OCT. (B) Diattenuation. The two polarization components are subject to different attenuation characteristics. (C) Depolarization. The polarization state of scattered light is scrambled in some tissues, e.g., in such containing melanin pigments. (D) PS OCT imaging of a human brain stem. The reflectivity image (left) displays the intensity of backscattered light. Birefringent structures such as the vagus nerve (cranial nerve X, CNX,) and the cerebelloolivary fibers (COF) exhibit increased retardation values (right). In the axis orientation image (right), the orientation of fiber tracts—e.g., in the inferior olivary nucleus (ION)—is shown in different colors as per the color wheel below. Modified from [46] with permission from SPIE. (E) PS OCT imaging of depolarization in the human retina. The healthy retina on the left shows a regular layered structures and strong depolarization in melanin-laden tissues such as the RPE. In late-stage dry AMD, the layered structure is destroyed in the macula. In the atrophic zone, the interrogating OCT beam can penetrate deep into the choroid. The pigmented and hence depolarizing RPE and choroid are displayed in red and green, respectively. Modified from Baumann et al. [47] with permission from OSA.
There are various implementations of PS OCT, but in general one can distinguish single input state methods, and multiple input state methods [70, 71]. The basic PS OCT setup employs two independent detection units for the orthogonal polarization states [59]. For the single state modality, the sample is illuminated by circularly polarized light [60, 72]. The measured complex interference signals of both polarization states IH, V = AH, V exp(-iφH, V) give access to sample reflectivity R, phase retardation δ, optics axis orientation θ according to Baumann [70]:
where Δφ = φV-φH. Phase retardation is an accumulative quantity with birefringent tissue depth. The actual birefringence can be extracted through determination of the phase retardation slope along depth. The determined quantities define for each pixel in the image the elements of the Stokes vector. Averaging of the elements as explained above allows determining depolarization. The main limitation of the single input state method is the assumption that the axis of polarization does not change with depth [73, 74], whereas the further assumption of negligible diattenuation is valid for most biological tissues [50, 62, 75]. By employing multiple polarization input states, it is possible to determine the full Mueller matrix elements to characterize the polarization properties of samples [51, 55, 62, 76–84]. Different polarization states are produced for example sequentially by placing an electro-optic modulator in the sample arm. Using two orthogonal states allows determining depth resolved Jones vectors and thus depth resolved accumulated phase retardation, optical axis orientation, as well as diattenuation. Depth resolved mapping of the axis orientation has for example been used for determining the orientation of birefringent collagen fibers in tissue, termed optic polarization tractography (Figure 4D) [85, 86].
Applications of PS OCT in medicine have been demonstrated for anterior and posterior eye segment imaging, endoscopic and catheter based OCT, imaging of collagen, nerves in skin and brain, cartilage imaging and imaging of tumors. For anterior eye imaging, examples include bleb formation and progression after trabeculectomy surgery [87], improved contrasting of the trabecular meshwork [88], or corneal malformation (e.g., keratoconus) and other corneal lesions [89–91]. Birefringent structures of interest of the posterior segment are the nerve fiber layer, Henle's fibers, and the sclera [92]. The first two are of importance for glaucoma diagnosis [93, 94]. It has been shown that birefringence loss is an earlier indicator of ganglion cell loss, than nerve fiber layer thickness [95]. Depolarizing effects are due to pigments in the retinal pigment layer. These can be visualized using DOPU maps, which further help for a better quantification of diseases affecting the pigment layer, such as age-related macular degeneration (AMD, see Figure 4E) [63, 96]. In addition, PSOCT supports drusen quantification, and classification [46, 97]. Especially for AMD, the combination of PSOCT and OCT Angiography seems to be a perfect multimodal combination to enhance understanding of pathogenesis, diagnosis and treatment decision [98–100]. Fiber optic implementations of PSOCT open further applications based on endoscopic probes or catheters. An important application is the intravascular assessment of atherosclerotic plaques [101–103], plaque rupture [104, 105], or monitoring and guidance of RF ablation of the endocardium [106]. In dermatology, PSOCT has been applied to assessment of burn depth [77, 107, 108], scaring [109], or identification of basal cell carcinoma [110]. In general, the determination of tumor borders based on the destruction of collagen and the associated reduced birefringence is a potentially important application that has been demonstrated for various tumors in humans and animal models [111–116].
Phase sensitive detection as used for quantifying blood flow is a general method for sensing any structural displacement. The displacement sensitivity in OCT reaches a fraction of the center wavelength and in some cases even below one nanometer. With a given stress on the tissue, the resulting displacement across a measured volume yields the mechanical properties of the tissue expressed by the elasticity module. Elastography, though with lower resolution, has been realized already in commercial medical imaging devices based on ultrasonography or magnetic resonance imaging [117]. Applications primarily for detecting liver fibrosis or for breast cancer are limited by the low resolution of those technologies which is typically in the millimeter range [118, 119]. Optical methods on the other hand share the advantage of cellular and even sub-cellular resolution. In 1998 Schmitt et al. [120] demonstrated the potential of OCT to provide in a depth resolved manner information about soft tissue deformation as response to a static compression. The use of TDOCT however limited the speed and displacement sensitivity of optical coherence elastography (OCE) and hindered its broader medical application. The rise of FDOCT and its ability to record full 3D volumes within a few seconds or less together with its higher sensitivity, both in intensity as well as in phase, brought a new impetus for functional OCT extensions. Especially during the last decade, several OCE methods have been proposed, taking advantage of developments in fast CMOS sensor technology as well as fast swept source lasers [121, 122]. In general it is possible to distinguish between compression OCE, harmonic OCE, and transient OCE. Although a forth category should be added, measuring strain in response to naturally induced stress such as to the heart beat pulse [123]. In the first case, compression is induced through a compression plate in contact with the tissue with periodic stress at frequencies of below 10 Hz. OCT recording is performed through a transparent part of the plate. The gradient of displacement with depth is called the local strain and can be displayed as elastogram [120]. Assuming that the load is leading to uniform stress across the tissue, the strain is inversely proportional to the elastic modulus. In general, strain is a tensor quantity, but phase sensitive detection allows access only to the axial component of displacement. Similar to Doppler OCT, multi beam OCT configurations might be applied to retrieve the full 3D displacement map with nanometer precision. Compression OCE may potentially be used during surgical intervention for determining tumor borders that could help avoiding tumor recurrence. Both in breast cancer as well as prostate cancer, studies demonstrated the potential of OCE to differentiate cancerous from healthy tissue in biopsies [124, 125]. For harmonic OCE, a standing mechanical wave is induced at the surface at frequencies of 50 Hz to 5 kHz. They are due to reflections at tissue boundaries on the centimeter scale. The wave appears at resonant frequencies characteristic for the tissue. The frequencies can be interrogated by scanning the excitation load frequency and determining the induced surface displacement [126, 127]. Such spectroscopic OCE provide inside into tissue viscoelasticity [128]. The challenge is however, to decouple the structural impact on the standing waves from the actual elastic properties of tissue. In case that the surface wave can propagate freely, pulsed excitation can be applied similar to ultrasound elastography. For such transient OCE, the traveling surface waves are excited at frequencies above 1 kHz and the elastic modulus of tissue is estimated from the acoustic phase velocity measured with OCT [129]. Applications in ophthalmology have been demonstrated, but in general transient techniques are time consuming and challenging for in-vivo use. Modern high-speed systems employing MHz swept sources, or parallel OCT might overcome this drawback in the future.
Another promising functional extension of OCT is spectroscopic OCT. As mentioned above, OCT relies on the temporal coherence properties of the employed light source. Shorter coherence means broader optical spectral subtend. Analysis of the backscattered spectrum can therefore be used for extracting absorption and scattering parameters of tissue. First demonstration of spectroscopic OCT employed short time Fourier transform to analyze localized spectral absorption [130, 131]. The main challenge of spectroscopic OCT is the dominant scattering contribution to the total attenuation, that is in most applications larger than actual absorption. Differential approaches assuming constant or linear scattering across the analyzed spectra partially mitigate for this drawback [132–134]. Important tissue chromophores such as hemoglobin or melanin exhibit strong absorption in the visible range. Differential absorption at different wavelengths across the isosbestic points, where oxy and deoxy-hemoglobin absorbance is equal, is also the basis of oximetry devices as applied in pulse-oximetry or for retinal oximetry. As mentioned earlier, visible light OCT that has been enabled through supercontinuum sources, is currently extensively investigated [35, 36, 135]. It allows for multimodal imaging combining OCT, OCT angiography, Doppler OCT, and tissue oximetry. Thereby, a complete image about tissue nutrition and oxygen consumption can be obtained. Another approach aims at quantifying the local signal attenuation, which is dominated by the tissue backscattering properties [136–140]. The total attenuation gives rise to an exponential decay of the backscattered signal with depth according to the Lambert-Beer's law. Hence, fitting a linear curve to the logarithmically scaled intensity profile along depths yields the attenuation coefficient as the slope of the curve. An en-face map of the slope value at the tissue surface provides local attenuation maps. Whereas such procedure works well for homogenous samples, it is challenging for actual tissue with their in general inhomogeneous distribution of scatterers. An alternative attenuation mapping procedure borrows from a method developed for ultrasound spectroscopy. Under the condition that the signal is fully attenuated along the depth scan, the local attenuation μ at pixel location i in depth can be estimated as Vermeer et al. [141]
where i is the index along depth, δzP is the axial resolution in pixels, and the summation runs from depth location i to the maximum depth index. This simple and fast approach has been first introduced to OCT for glaucoma diagnosis and promises as in the case of OCE to identify tumor borders online during surgery, without the need of tissue extraction. Glioma tissue has for example been successfully differentiated from healthy brain tissue based on attenuation mapping [142]. Also for intravascular imaging, successful application of attenuation mapping to determine and characterize plaque deposits in vessel walls has been demonstrated [137].
Other imaging modalities that help to enhance the molecular imaging aspect in a multimodal combination with OCT are listed in Table 2. They are compared with respect to their individual advantages in a combined imaging platform. Particular sections are devoted to the combination of OCT and OCTA with photoacoustic tomography and microscopy as well as with non-linear optical microscopy.
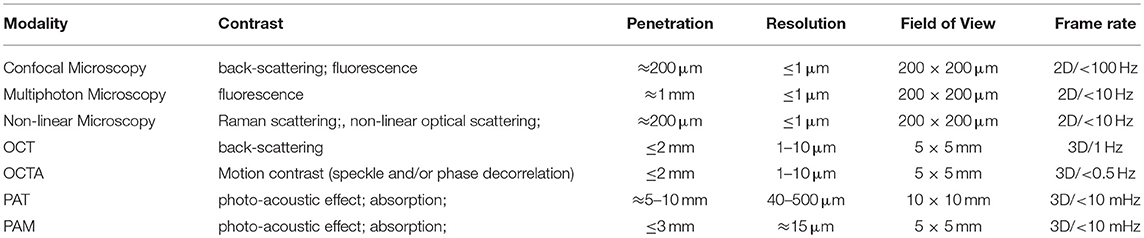
Table 2. Modalities, contrast mechanisms, and imaging parameters.
Table 3 compares the individual modalities for in-vivo medical imaging qualitatively with respect to standard imaging performance figures. The highest scores of “+++” need to be seen always in comparison with other medical imaging modalities. Concerning penetration depth for example, the highest score would certainly go to full body imaging modalities including ultrasound. Concerning structural resolution, optical microscopy does not have at current any competing technology. From the table, NLOM seems to combine a multitude of advantages concerning resolution and molecular contrast, but comes at the disadvantage of limited field-of-view, and penetration depth. OCT is capable to mitigate both disadvantages in a multimodal concept. PAT/PAM on the other hand has much better depth penetration than OCT together with the molecular specific absorption contrast, but suffers from low structural contrast and resolution. In a combined platform, OCT fills the gap of missing structural contrast and resolution. The following sections give a short description of the complementary optical techniques and outline the specific advantages of the multimodal combination highlighting some applications.
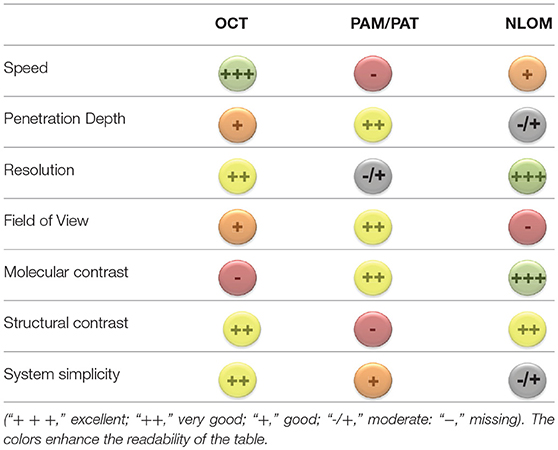
Table 3. Multimodal OCT imaging with molecular contrast.
Photo-acoustic imaging (PA) is based on the photo-acoustic effect that has been first described by Bell in 1880 [143]. A short pulse of light is absorbed by chromophore and may lead to local thermoelastic expansion. The resulting local pressure rise excites then a propagating sound wave—the photoacoustic wave—that can be detected at the tissue surface. By measuring the photoacoustic waves after exciting a full volume it is possible to reconstruct the distribution of absorbers within the volume in 3D [144]. PA covers, depending on the detection bandwidth, a large depth range, starting from several 100 μm with photoacoustic microscopy (PAM) to a few centimeters with photoacoustic tomography (PAT) [145, 146]. Since PA is based on absorption as contrast mechanism, it is fully complimentary to OCT, whose contrast is based on back-scattering alone [147, 148]. OCT is highly structurally sensitive, whereas PAT yields molecular specific absorption contrast. In most cases PAT is used for visualizing tissue vasculature, i.e., absorption by hemoglobin, down to a depth of centimeters. Hence, the combination of OCTA with PAT yields a complete description of skin perfusion. The superficial small capillary loops and underlying capillary and vessel beds with vessel diameters from 10 to 200 μm are visualized by OCTA down to a depth of 1 mm. PAT complements the angiography by resolving vessels with diameters from 100 μm on down to a depth of 5–10 mm. Vessels within the transition region at a depth of about 1 mm help to co-register both modalities (Figure 5) [149, 150]. Studies in dermatology are currently investigating the clinical impact of such combined PAT/OCT and OCTA imaging for diagnosis of skin disorders [151].
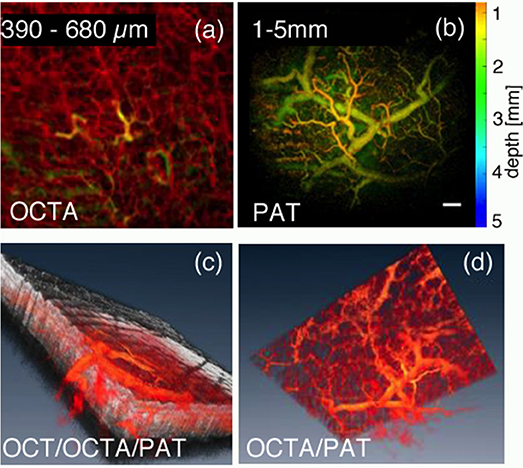
Figure 5. Combined OCT/OCTA and PAT for depth enhanced visualization of skin perfusion, (a) Maximum intensity projected OCTA for superficial capillary beds; The yellow vessel structures appear both in OCTA and PAT and are used for volume co-registration. (b) Color coded depth PAT for deeper vascular structures; (c) volume rendered view of combined OCT (gray) and OCT/PAT (red); (d) volume rendered view of combined OCTA and PAT. Scale bar is 500 μm. Modified from Liu et al. [149] with permission from OSA.
In terms of resolution and depth optical-resolution photo-acoustic microscopy (OR-PAM) can be better compared with OCT [152]. Like OCT, OR-PAM scans the excitation beam, which focal spot size defines the lateral resolution, across the tissue surface. Studies combining both modalities included for example chemically induced bovine cartilage osteoarthritis: OR-PAM shows the locations of damages in cartilage such as clefts and fissures, whereas OCT yields the overall matrix structure [153]. Another study visualized fluorescent protein labeled exocrine pancreas and blood vessels in adult zebrafish, whereas OCT yields the morphology of the matrix tissue, which ultimately allows for better correlation with histology [154]. The full potential of PA is to exploit the spectroscopic absorption contrast that can be used to calculate blood oxygen saturation. Together with OCT/OCTA and DOCT, this yields then information about tissue metabolic rate [155]. OCT and PAT/PAM can be used in articulate arm probes, that allows reaching various skin regions of patients. For inner organs, photo-acoustic probes need to be introduced into endoscopes [156]. Technological challenges for such designs have only recently been overcome, and first endoscopically combined OCT and photoacoustic imaging has been tested [157, 158]. A major limitation of PAT and PAM is the relatively slow imaging speed that makes it challenging for in-vivo applications in the presence of involuntary motion and heartbeat. One of the key factors in terms of speed is the pulse repetition rate of the laser source together with the need of large pulse energies for full field excitation in PAT. There are currently several new light sources tested for their use in photoacoustic imaging including supercontinuum sources. It is therefore expected that combined OCT and photoacoustic imaging at various scales will play an important role in future diagnostic medical devices.
We have seen that the combination of OCT with a method based on absorption can provide important complimentary information on molecular sample composition. Whereas, PAT or PAM gives access to ensemble properties of cells or organs, optical biopsy calls also for cellular resolution techniques [159]. In view of the fact that cell populations are inherently heterogeneous, cellular resolution plays an important role for assessment of tumor grade as well as immune response or in general cell fate. Furthermore, the understanding of the functional dynamics of the tumor microenvironment that has been identified as one of the hallmarks of cancer, stresses the need for both high cellular as well as metabolic resolution [160].
Multiphoton fluorescence microscopy (MPM) achieves cellular and sub-cellular resolution with a high chemical sensitivity based on endogenous as well as exogenous contrast. Compared to single photon fluorescence, it does not require confocal pin-holes due its inherent 3D sectioning capability based on non-linear absorption processes. Due to the use of longer wavelengths for excitation, MPM achieves good tissue penetration depths of several hundreds of micrometers. In addition, the application of in general lower average powers avoids photodamage and photobleaching, which is indispensable for in-vivo live cell imaging. The most common NLOM processes are two- and three-photon excitation fluorescence (TPEF, 3PEF), second harmonic generation (SHG), and coherent Raman scattering. Table 4 lists a selection of endogenous and exogenous fluorophores that can be detected with either of the MPM methods, together with relevant clinical applications. A rich overview about endogenous molecules assessable by MPM can be found in the article of Zipfel et al. [162]. We included in the table also aminolevulinic acid hydrochlorid (ALA) that is commonly excited with single photon fluorescence (SPEF). ALA accumulates in tumors due to the EPR effect [2] and can be used for efficient guidance during intrasurgical brain tumor removal as well as for guided biopsy during endoscopy. It has been successfully combined with OCT for fluorescence-guided endoscopic OCT for rat bladder imaging [163, 164].
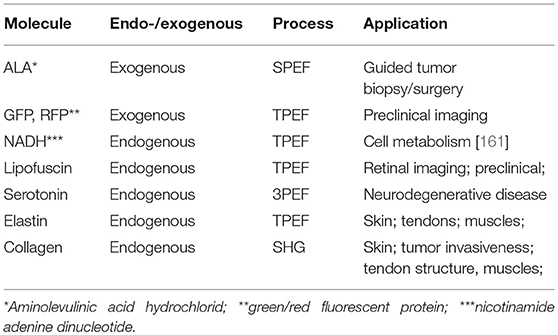
Table 4. Typical molecules to be imaged by NLOM and MPM.
MPM techniques in general require high numeric aperture (NA) optics for efficient excitation and detection. This leads to a relatively small field of view of about 200 μm in diameter. Hence, the gained benefit of metabolic contrast comes with tunnel vision that needs efficient guidance to address tissues of interest. OCT has the advantage to provide morphologic contrast on a mesoscopic scale over a larger field of view of several millimeters in diameter. In addition, it yields information about tumor invasiveness. The combination of MPM and OCT seems therefore a natural match to bridge both scale and metabolic contrast.
The combination of TPEF and OCT has been first demonstrated already in 1999 by Beaurepaire et al. [165]. Employing an ultrafast Ti:Sapph laser is the most obvious choice for such dual modality. The laser provides on the one hand the short pulses of sub-100fs, needed for efficient TPEF, and on the other hand short pulses guarantee broad optical spectra translating in high axial resolution for OCT. Its central wavelength of 800 nm with a bandwidth of typically 100–200 nm makes it also a good choice to excite important intrinsic and extrinsic fluorophores, such as nicotinamide adenine dinucleotide (NADH) or green fluorescent protein (GFP). Whereas TPEF is an absorption process similar to SPEF, SHG is a parametric non-linear process that occurs only in non-centro-symmetric molecules [166]. The most prominent example for such molecule in tissue is collagen, which is found in form of elongated fibrils in muscles, skin, smooth muscles of blood vessels, bone, cartilage, tendons, and the cornea [167]. Diseases that lead to structural disorders, such as cancer, or arthritis, or aging processes, have an immediate impact on the collagen structure [168] and thus on the SHG signal. SHG was first successfully combined with OCT using a common ultrafast Ti:Sapph laser source for in-vitro imaging of collagen [169], followed by a vast number of other implementations [170]. Of particular interest is the multimodal combination of PSOCT with SHG for imaging of collagen. Cross-modality correlation of the cellular resolution contrast of collagen rich structures yielded by SHG provides insight into the large scale contrast mechanism based on form birefringence provided by PS OCT [171]. The combination of TPEF and SHG with OCT has been reported by Vinegoni et al. [172] visualizing fibroblast cells with GFP labeled vinculin and smooth muscle tissue from a transgenic GFP mouse. Another multi-scale study measured the mechanical and microstructural response of the central cornea from New Zealand white rabbits postmortem [173]. The study included corneal SHG imaging of diseases and healthy state as well as collagen microstructural response to changes in intraocular pressure correlating the results also with OCT. Multimodal microscopy demonstrated improved molecular and multi-scale structural contrast also for ex-vivo and in-vivo skin imaging [174, 175]. A recent study demonstrated the combination of tomographic OCT with selective plane illumination microscopy (SPIM) for the study of mouse embryon development employing fluorescence microscopy with the potential to be also combined with MPM [176]. MPM has been shown to provide important metabolic information in addition to cellular structural details in various skin disorders and diseases such as basal cell carcinoma and other skin cancers, hemangioma, psoriasis, pigmented lesions, or connective tissue diseases [177, 178]. In a combined multimodal platform with OCT and OCT angiography, the endogenous proteins NADH and FAD have been visualized with TPEF as metabolic indicators, SHG contrasted collagen, and high-resolution OCT provided structural contrast on a mesoscopic scale for MPM guidance [175] (Figure 6). OCTA in addition yields complementary diagnostic information as skin diseases and disorders exhibit characteristic angiographic patterns [43]. For endoscopic applications, proper dispersion control needs to be employed, in order to deliver the necessary short pulses to the tissue through fibers. Simultaneous OCT and MPM imaging was suggested employing a double-clad fiber, with OCT recording through the single mode core, and MPM recorded through the clad [179, 180].
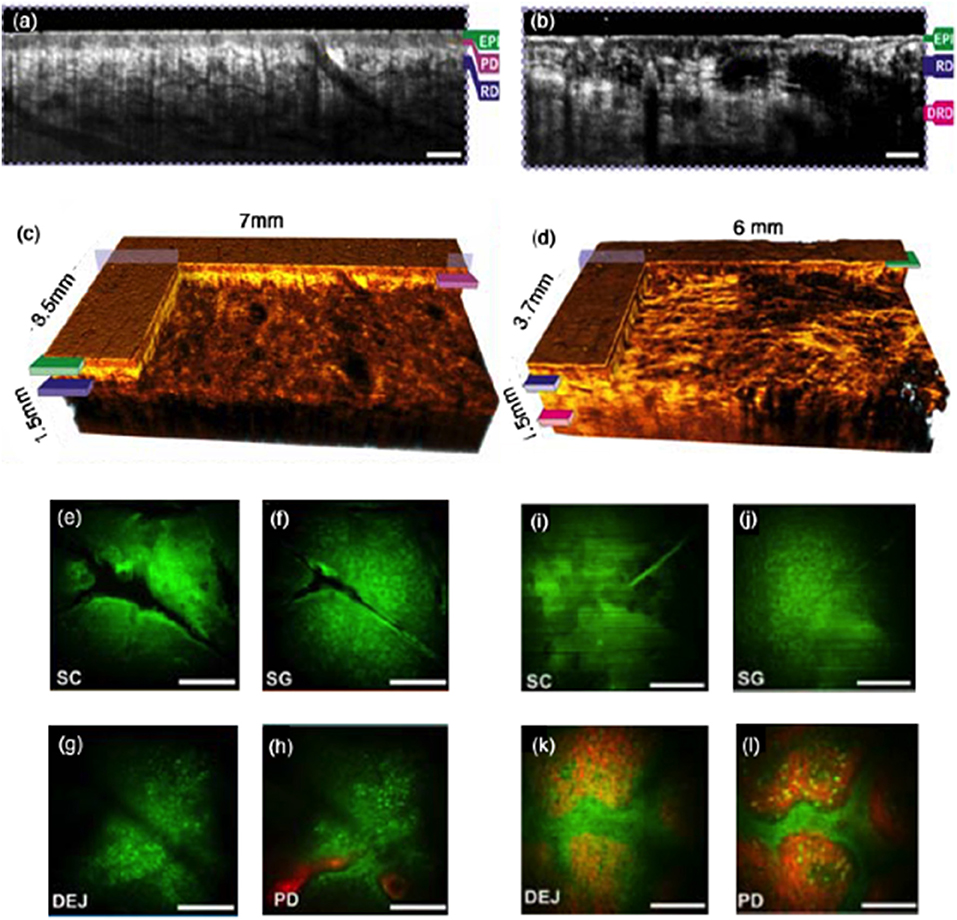
Figure 6. In vivo clinical MPM/OCT in healthy versus basal cell carcinoma (BCC) in the dorsal forearm. (a,b) OCT tomograms of healthy skin and of BCC. The scale bars indicate 500 μm; (c,d) 3D rendered OCT volume of healthy skin BCC. (e–h) MPM of healthy skin at different depths. (i–l) MPM of BCC at different depths. The scale bars indicate 100 μm. MPM is centered at the OCT volume. Green corresponds to TPF with contributions from melanin, NADH, and elastin, red displays the SHG signal attributed to collagen; EPI- epidermis; SC, stratum corneum; SG, stratum granulosum; SS, stratum spinosum; DEJ, dermalepidermal junction; RD, reticular dermis; PD, papillary dermis. Modified from Alex et al. [175] with permission from John Wiley&Sons.
Raman spectroscopy (RS) is probably the most molecularly sensitive label-free modality. The sensitivity comes however at the price of a very low efficiency: in an optimal case, only one photon out of a million incident photons experiences Raman scattering. Raman scattered light exhibits a frequency shift related to the vibrational and rotational states of a molecule [181]. The combination of RS and OCT seemed to be very useful for the interpretation of the in general complex RS spectra since OCT yields the necessary structural contrast, as shown for example for dental caries [182, 183], for application to skin cancer [183, 184], or colon cancer [185]. The latter study reported an increase of specificity, sensitivity, and accuracy for tumor assessment with a multimodal approach reaching 94% in all categories. Depth resolved confocal RS together with OCT has been demonstrated on mucosal tissue, producing individual biochemical maps from the epithelium and stroma [186].
The disadvantage of RS is the low efficiency and resulting long measurement times, which leave in-vivo applications challenging. Coherent RS, such as coherent anti-Stokes Raman scattering (CARS) and stimulated Raman scattering (SRS) have the advantage of an efficiency of several orders of magnitudes higher than RS [187]. However, the excitation process requires a priori knowledge of the excitations bands of interest. Molecule-sensitive OCT has been demonstrated by combination with coherent interferometric CARS [170, 188, 189]. Current implementations focus mainly on lipid rich structures.
Depending on the application, there are different standards that define the OCT device specifications and performance tests, the data handling, image interpretation, quantitative data extraction, and the data formats. Concerning the posterior part of the eye, the International Organization for Standardization (ISO) norm ISO 16971:2015 contains the “minimum requirements for OCT instruments and systems. It specifies tests and procedures that will verify that a system or instrument complies with this International Standard and so qualifies as an OCT in the meaning of this International Standard. It specifies type test methods and procedures that will allow the verification of capabilities of systems that are beyond the minimum required for OCTs.” It is further noted that these standards might in a future revision be extended to include all other segments of the eye [190].
The other clinically established application regards intravascular OCT. In a consensus paper compiled by the International Working Group for Intravascular OCT Standardization and Validation (IWG-IVOCT) the consensus standards for acquisition, measurement, and reporting of intravascular OCT (IVOCT) studies are made available as peer-reviewed publication [191]. It includes also recommendations for the use of polarization sensitive OCT and Doppler OCT. An important standardization regards the storing and transferring of digital IVOCT images ensuring interoperability between different IVOCT imaging systems and PACS (Picture Archive and Communication System). An established standard for exchanging medical images and other information between medical imaging devices is DICOM (Digital Imaging and Communication in Medicine). DICOM Supplement 151 supports in particular IVOCT and is part of the DICOM standard since 2011. It contains standard operation procedures (SOP) for processing and presenting IVOCT image data.
There is however no standardization yet on intermodal multimodal imaging systems.
The present article demonstrates the ability of multimodal imaging techniques to overcome limitations of single techniques with respect to resolution, penetration depth, or molecular sensitivity. Optical techniques in general suffer from limited penetration depth mainly due to light scattering, especially compared to standard radiologic imaging techniques such as ultrasound or magnetic resonance. On the other hand, they exhibit outstanding structural resolution, together with the possibility of label-free molecule-specific imaging and sensing. We demonstrated the capabilities of multimodal optical imaging using the example of optical coherence tomography together with intra- and inter modal combinations. We strongly believe that multimodal approaches will ultimately enable to perform optical biopsy levering the incidence of tumor recurrence. This will have both a massive impact on the quality of life of patients as well as their caretakers. We have further seen many more applications, where a multimodal concept enhances diagnostic capabilities also for other diseases beyond cancer. Especially age- and life-style related diseases including age-related macular degeneration, different forms of dementia, or diabetes will pose a significant burden to our future health care systems due to demographic changes. Enhanced diagnostics based on multimodal imaging is therefore part of an important flagship programme, namely the private partnership programme Photonics 21 of the European commission [192]. Ultimately, the development of advanced imaging techniques will enable novel personalized treatment, early diagnostics, and form the basis for the development of novel efficient drugs and cures for currently deadly diseases.
RL set the article scope, compiled the article and prepared figures and tables. BB edited parts of the article, prepared figures, and proof-read the article.
The authors acknowledge funding by the European Commission's Horizon 2020 programme (grant MIB number 667933; grant MOON number 732969; grant FBI number 721766), the Austrian Science Fund (FWF grant P25823-B24), and the European Research Council (ERC Starting Grant 640396 OPTIMALZ).
The authors declare that the research was conducted in the absence of any commercial or financial relationships that could be construed as a potential conflict of interest.
Funding from the Federal Ministry of Science, Research and Economy, by the European Research Council and by the European Commission's Horizon 2020 programme is acknowledged.
1. Bouyé C, Lee C. Collaboration advances intraoperative assessment of tumor margins. In BioPhotonics. Photonics Media (2014). Available online at: https://www.photonics.com/Articles/Collaboration_Advances_Intraoperative_Assessment/a57012
2. Maeda H, Wu J, Sawa T, Matsumura Y, Hori K. Tumor vascular permeability and the EPR effect in macromolecular therapeutics: a review. J Control Release (2000) 65:271–84. doi: 10.1016/S0168-3659(99)00248-5
3. Huang D, Swanson EA, Lin CP, Schuman JS, Stinson WG, Chang W, et al. Optical coherence tomography. Science (1991) 254:1178–81. doi: 10.1126/science.1957169
4. Fujimoto JG, Brezinski ME, Tearney GJ, Boppart SA, Bouma B, Hee MR, et al. Optical biopsy and imaging using optical coherence tomography. Nat Med. (1995) 1:970–2. doi: 10.1038/nm0995-970
5. Li BH, Leung ASO, Soong A, Munding CE, Lee H, Thind AS, et al. Hybrid intravascular ultrasound and optical coherence tomography catheter for imaging of coronary atherosclerosis. Catheteriz Cardiovasc Intervent. (2013) 81:494–507. doi: 10.1002/ccd.24295
6. Drexler W, Fujimoto JG.eds. Optical Coherence Tomography - Technology and Applications. 2nd edition, Heidelberg; New York, NY; Dordrecht; London: Springer International Publishing Switzerland (2015).
7. Cassidy PJ, Radda GK. Molecular imaging perspectives. J R Soc Interface (2005) 2:133–44. doi: 10.1098/rsif.2005.0040
8. Tichauer KM, Wang Y, Pogue BW, Liu JTC. Quantitative in vivo cell-surface receptor imaging in oncology: kinetic modeling and paired-agent principles from nuclear medicine and optical imaging. Phys Med Biol. (2015) 60:R239–69. doi: 10.1088/0031-9155/60/14/R239
9. Fercher AF. Ophthalmic Interferometry. In: von Bally G, Khanna, S, Editors. Optics in Medicine. Biology and Environmental Research. Amsterdam: Elsvier (1990). p. 221–35.
10. Fercher AF, Hitzenberger CK, Drexler W, Kamp G, Sattmann H. In-vivo optical coherence tomography. Am J Ophthalmol. (1993) 116:113–5. doi: 10.1016/S0002-9394(14)71762-3
11. Swanson EA, Izatt JA, Hee MR, Huang D, Lin CP, Schuman JS, et al. In-vivo retinal imaging by optical coherence tomography. Opt. Lett. (1993) 18:1864–6. doi: 10.1364/OL.18.001864
12. Hitzenberger C, Fercher AF. Optical measurement of the axial eye length by laser Doppler interferometry. Invest Ophthalmol Vis Sci. (1991) 32:616–24.
13. Fercher AF, Drexler W, Hitzenberger CK, Lasser T. Optical coherence tomography - Principles and applications. Rep Prog Phys. (2003) 66:239–303. doi: 10.1088/0034-4885/66/2/204
14. Povazay B, Bizheva K, Unterhuber A, Hermann B, Sattmann H, Fercher AF, et al. Submicrometer axial resolution optical coherence tomography. Opt. Lett. (2002) 27:1800–02. doi: 10.1364/OL.27.001800
15. Povazay B, Hermann B, Unterhuber A, Hofer B, Sattmann H, Zeiler F, et al. Three-dimensional optical coherence tomography at 1050 nm versus 800 nm in retinal pathologies: enhanced performance and choroidal penetration in cataract patients. J Biomed Opt. (2007) 12:041211. doi: 10.1117/1.2773728
16. Yamanaka M, Teranishi T, Kawagoe H, Nishizawa N. Optical coherence microscopy in 1700 nm spectral band for high-resolution label-free deep-tissue imaging. Sci Rep. (2016) 6:31715. doi: 10.1038/srep31715
17. Chong SP, Merkle CW, Cooke DF, Zhang T, Radhakrishnan H, Krubitzer L, et al. Noninvasive, in vivo imaging of subcortical mouse brain regions with 1.7 μm optical coherence tomography. Opt Lett. (2015) 40:4911–4. doi: 10.1364/OL.40.004911
18. Leitgeb R, Hitzenberger CK, Fercher AF. Performance of Fourier domain vs. time domain optical coherence tomography. Opt Expr. (2003) 11:889–94. doi: 10.1364/OE.11.000889
19. de Boer JF, Cense B, Park BH, Pierce MC, Tearney GJ, Bouma BE. Improved signal-to-noise ratio in spectral-domain compared with time-domain optical coherence tomography. Opt Lett. (2003) 28:2067–69. doi: 10.1364/OL.28.002067
20. Choma MA, Sarunic MV, Yang C, Izatt JA. Sensitivity advantage of swept source and Fourier domain optical coherence tomography. Opt Exp. (2003) 11:2183–9. doi: 10.1364/OE.11.002183
21. Klein T, Huber R. High-speed OCT light sources and systems [Invited], Biomed Opt Expr. (2017) 8:828–59. doi: 10.1364/BOE.8.000828
22. Carrasco-Zevallos OM, Viehland C, Keller B, Draelos M, Kuo AN, Toth CA, et al. Review of intraoperative optical coherence tomography: technology and applications [Invited]. Biomed Opt Expr. (2017) 8:1607–37. doi: 10.1364/BOE.8.001607
23. Ehlers JP. Intraoperative optical coherence tomography: past, present, and future. Eye (London. England) (2016) 30:193–201. doi: 10.1038/eye.2015.255
24. Leitgeb RA, Werkmeister RM, Blatter C, Schmetterer L. Doppler optical coherence tomography. Prog Retinal Eye Res. (2014) 41:26–43. doi: 10.1016/j.preteyeres.2014.03.004
25. Chen Z, Milner TE, Dave D, Nelson JS. Optical Doppler tomographic imaging of fluid flow velocity in highly scattering media. Opt. Lett. (1997) 22:64–6. doi: 10.1364/OL.22.000064
26. Izatt JA, Kulkarni MD, Yazdanfar S, Barton JK, Welch AJ. In vivo bidirectional color Doppler flow imaging of picoliter blood volumes using optical coherence tomography. Opt. Lett. (1997) 22:1439–41. doi: 10.1364/OL.22.001439
27. Zhao Y, Chen Z, Saxer C, Xiang S, de Boer JF, Nelson JS. Phase-resolved optical coherence tomography and optical Doppler tomography for imaging blood flow in human skin with fast scanning speed and high velocity sensitivity. Opt Lett. (2000) 25:114–6. doi: 10.1364/OL.25.000114
28. Schmoll T, Kolbitsch C, Leitgeb RA. Ultra-high-speed volumetric tomography of human retinal blood flow. Opt. Expr. (2009) 17:4166–76. doi: 10.1364/OE.17.004166
29. Leitgeb R, Schmetterer L, Wojtkowski M, Hitzenberger CK, Sticker M, Fercher AF. Flow velocity measurements by frequency domain short coherence interferometry. In: Proceedings of SPIE - The International Society for Optical Engineering San Jose, CA: International Symposium on Biomedical Optics (2002), pp. 16–21. doi: 10.1117/12.470477
30. Werkmeister RM, Dragostinoff N, Pircher M, Götzinger E, Hitzenberger CK, Leitgeb RA, et al. Bidirectional doppler fourier-domain optical coherence tomography for measurement of absolute flow velocities in human retinal vessels. Opt. Lett. (2008) 33:2967–69. doi: 10.1364/OL.33.002967
31. Baumann B, Potsaid B, Kraus MF, Liu JJ, Huang D, Hornegger J, et al. Total retinal blood flow measurement with ultrahigh speed swept source/Fourier domain OCT. Biomed Opt Exp. (2011) 2:1539–52. doi: 10.1364/BOE.2.001539
32. Schmoll T, Leitgeb RA. Heart-beat-phase-coherent doppler optical coherence tomography for measuring pulsatile ocular blood flow. J Biophoto. (2013) 6:275–82. doi: 10.1002/jbio.201200029
33. Haindl R, Trasischker W, Baumann B, Pircher M, Hitzenberger CK. Three-beam Doppler optical coherence tomography using a facet prism telescope and MEMS mirror for improved transversal resolution. J Modern Opt. (2015) 62:1781–8. doi: 10.1080/09500340.2014.983569
34. Werkmeister RM, Schmidl D, Aschinger G, Doblhoff-Dier V, Palkovits S, Wirth M, et al. Retinal oxygen extraction in humans. Sci Rep. (2015) 5:15763. doi: 10.1038/srep15763
35. Chen S, Shu X, Nesper PL, Liu W, Fawzi AA, Zhang HF. Retinal oximetry in humans using visible-light optical coherence tomography [Invited], Biomed Opt Exp. (2017) 8:1415–29. doi: 10.1364/BOE.8.001415
36. Lichtenegger A, Harper DJ, Augustin M, Eugui P, Muck M, Gesperger J, et al. Spectroscopic imaging with spectral domain visible light optical coherence microscopy in Alzheimer's disease brain samples. Biomed Opt Exp. (2017) 8:4007–25. doi: 10.1364/BOE.8.004007
37. Marchand PJ, Bouwens A, Szlag D, Nguyen D, Descloux A, Sison M, et al. Visible spectrum extended-focus optical coherence microscopy for label-free sub-cellular tomography. Biomed Opt Expr. (2017) 8:3343–59. doi: 10.1364/BOE.8.003343
38. Makita S, Hong Y, Yamanari M, Yatagai T, Yasuno Y. Optical coherence angiography. Opt. Exp. (2006) 14:7821–40. doi: 10.1364/OE.14.007821
39. Zhao Y, Chen Z, Saxer C, Shen Q, Xiang S, de Boer JF, et al. Doppler standard deviation imaging for clinical monitoring of in vivo human skin blood flow. Opt Lett. (2000) 25:1358–60 doi: 10.1364/OL.25.001358
40. Grulkowski I, Gorczynska I, Szkulmowski M, Szlag D, Szkulmowska A, Leitgeb RA, et al. Scanning protocols dedicated to smart velocity ranging in Spectral OCT. Opt Exp. (2009) 17:23736–54. doi: 10.1364/OE.17.023736
41. An L, Qin J, Wang RK. Ultrahigh sensitive optical microangiography for in vivo imaging of microcirculations within human skin tissue beds. Opt Expr. (2010) 18:8220–8. doi: 10.1364/OE.18.008220
42. Blatter C, Klein T, Grajciar B, Schmoll T, Wieser W, Andre R, et al. Ultrahigh-speed non-invasive widefield angiography. J Biomed Opt. (2012) 17:070505. doi: 10.1117/1.JBO.17.7.070505
43. Blatter C, Weingast J, Alex A, Grajciar B, Wieser W, Drexler W, et al. In situ structural and microangiographic assessment of human skin lesions with high-speed OCT. Biomed Opt Expr. (2012) 3:2636–46. doi: 10.1364/BOE.3.002636
44. Yu L, Chen Z. Doppler variance imaging for three-dimensional retina and choroid angiography. J Biomed Opt. (2010) 15:016029–9. doi: 10.1117/1.3302806
45. Schmoll T, Ivascu IR, Singh ASG, Blatter C, Leitgeb RA. Intra-and inter-frame differential doppler optical coherence tomography. Sovremennye Tehnologii v Med. (2015) 7:34–42. doi: 10.17691/stm2015.7.1.05
46. Baumann B, Götzinger E, Pircher M, Sattmann H, Schütze C, Schlanitz F, et al. Segmentation and quantification of retinal lesions in age-related macular degeneration using polarization-sensitive optical coherence tomography. J Biomed Opt. (2010) 15:061704. doi: 10.1117/1.3499420
47. Baumann B, Woehrer A, Mitter C, Ricken G, Augustin M, Muck M, et al. “Polarization-sensitive optical coherence microscopy of human brain samples,” in Optics in the Life Sciences Congress, OSA Technical Digest. San Diego, CA: Optical Society of America (2017) BrW4B.3.
48. van Blokland GJ. Ellipsometry of the human retina in vivo: Preservation of polarization. J Opt Soc Am A. (1985) 2:72–5. doi: 10.1364/JOSAA.2.000072
49. Brink HB K, Van Blokland GJ. Birefringence of the human foveal area assessed in vivo with Mueller-matrix ellipsometry. J Opt Soc Am A. (1988) 5:49–57. doi: 10.1364/JOSAA.5.000049
50. Todorović M, Jiao S, Wang LV, Stoica G. Determination of local polarization properties of biological samples in the presence of diattenuation by use of Mueller optical coherence tomography. Opt Lett. (2004) 29:2402–4. doi: 10.1364/OL.29.002402
51. Hyle Park B, Pierce MC, Cense B, de Boer JF. Jones matrix analysis for a polarization-sensitive optical coherence tomography system using fiber-optic components. Opt. Lett. (2004) 29:2512–4. doi: 10.1364/OL.29.002512
52. Kemp NJ, Zaatari HN, Park J, Rylander HG III Milner TE. Form-biattenuance in fibrous tissues measured with polarization-sensitive optical coherence tomography (PS-OCT). Opt Expr. (2005) 13:4611–28. doi: 10.1364/OPEX.13.004611
53. Oldenburg AL, Chhetri RK, Cooper JM, Wu WC, Troester MA, Tracy JB. Motility-, autocorrelation-, and polarization-sensitive optical coherence tomography discriminates cells and gold nanorods within 3D tissue cultures. Opt Lett. (2013) 38:2923–6. doi: 10.1364/OL.38.002923
54. Baumann B, Baumann SO, Konegger T, Pircher M, Götzinger E, Schlanitz F, et al. Polarization sensitive optical coherence tomography of melanin provides intrinsic contrast based on depolarization. Biomed Opt Expr. (2012) 3:1670–83. doi: 10.1364/BOE.3.001670
55. Jiao S, Yao G, Wang LV. Depth-resolved two-dimensional Stokes vectors of backscattered light and Mueller matrices of biological tissue measured with optical coherence tomography. Appl Opt. (2000) 39:6318–24. doi: 10.1364/AO.39.006318
56. Jones RC. A new calculus for the treatment of optical systems. Description I, and discussion of the calculus. J. Opt. Soc. Am. (1941) 31:488–93. doi: 10.1364/JOSA.31.000488
57. Bickel WS, Bailey WM. Stokes vectors. mueller matrices, and polarized scattered light. Am J Phys. (1985) 53:468–78. doi: 10.1119/1.14202
58. De Boer JF, Milner TE, Van Gemert MJ, Nelson JS. Two-dimensional birefringence imaging in biological tissue by polarization-sensitive optical coherence tomography. Opt Lett. (1997) 22:934–6. doi: 10.1364/OL.22.000934
59. Hee MR, Huang D, Swanson EA, Fujimoto JG. Polarization-sensitive low-coherence reflectometer for birefringence characterization and ranging. J Opt Soc Am B. (1992) 9:903–8. doi: 10.1364/JOSAB.9.000903
60. Hitzenberger CK, Götzinger E, Sticker M, Pircher M, Percher AF. Measurement and imaging of birefringence and optic axis orientation by phase resolved polarization sensitive optical coherence tomography. Opt Expr. (2001) 9:780–90. doi: 10.1364/OE.9.000780
61. Park BH, Pierce MC, Cense B, De Boer JF. Optic axis determination accuracy for fiber-based polarization-sensitive optical coherence tomography. Opt Lett. (2005) 30:2587–9. doi: 10.1364/OL.30.002587
62. Makita S, Yamanari M, Yasuno Y. Generalized Jones matrix optical coherence tomography: Performance and local birefringence imaging. Opt Expr. (2010) 18:854–76. doi: 10.1364/OE.18.000854
63. Götzinger E, Pircher M, Geitzenauer W, Ahlers C, Baumann B, Michels S, et al. Retinal pigment epithelium segmentation by polarization sensitive optical coherence tomography. Opt Exp. (2008) 16:16410–22. doi: 10.1364/OE.16.016410
64. Adie SG, Hillman TR, Sampson DD. Detection of multiple scattering in optical coherence tomography using the spatial distribution of Stokes vectors. Opt Exp. (2007) 15:18033–49. doi: 10.1364/OE.15.018033
65. Götzinger E, Pircher M, Baumann B, Schmoll T, Sattmann H, Leitgeb RA, et al. Speckle noise reduction in high speed polarization sensitive spectral domain optical coherence tomography. Opt Exp. (2011) 19:14568–84. doi: 10.1364/OE.19.014568
66. Götzinger E, Baumann B, Pircher M, Hitzenberger CK. Polarization maintaining fiber based ultra-high resolution spectral domain polarization sensitive optical coherence tomography. Opt Exp. (2009) 17:22704–17. doi: 10.1364/OE.17.022704
67. Bonesi M, Sattmann H, Torzicky T, Zotter S, Baumann B, Pircher M, et al. High-speed polarization sensitive optical coherence tomography scan engine based on Fourier domain mode locked laser. Biomed Opt Exp. (2012) 3:2987–3000. doi: 10.1364/BOE.3.002987
68. Lippok N, Villiger M, Bouma BE. Degree of polarization (uniformity) and depolarization index: Unambiguous depolarization contrast for optical coherence tomography. Opt Lett. (2015) 40:3954–57. doi: 10.1364/OL.40.003954
69. Ortega-Quijano N, Marvdashti T, Bowden AKE. Enhanced depolarization contrast in polarizationsensitive optical coherence tomography. Opt Lett. (2016) 41:2350–3. doi: 10.1364/OL.41.002350
70. Baumann B. Polarization sensitive optical coherence tomography: a review of technology and applications. Appl Sci. (2017) 7:474–508. doi: 10.3390/app7050474
71. Hitzenberger CK, Pircher M. MUW approach of PS OCT, in Optical Coherence Tomography: Technology and Applications. 2nd ed. (2015).
72. Pircher M, Goetzinger E, Leitgeb R, Hitzenberger CK. Transversal phase resolved polarization sensitive optical coherence tomography. Phys Med Biol. (2004) 49:1257–63. doi: 10.1088/0031-9155/49/7/013
73. Fan C, Yao G. Mapping local optical axis in birefringent samples using polarization-sensitive optical coherence tomography. J Biomed Opt. (2012) 17:110501. doi: 10.1117/1.JBO.17.11.110501
74. Fan C, Yao G. Mapping local retardance in birefringent samples using polarization sensitive optical coherence tomography. Opt Lett. (2012) 37:1415–7. doi: 10.1364/OL.37.001415
75. Braaf B, Vermeer KA, de Groot M, Vienola KV, de Boer JF. Fiber-based polarization-sensitive OCT of the human retina with correction of system polarization distortions. Biomed Opt Exp. (2014) 5:2736–58. doi: 10.1364/BOE.5.002736
76. Jiao S, Wang LV. Two-dimensional depth-resolved Mueller matrix of biological tissue measured with double-beam polarization-sensitive optical coherence tomography. Opt Lett. (2002) 27:101–3. doi: 10.1364/OL.27.000101
77. Jiao S, Yu W, Stoica G, Wang LV. Contrast mechanisms in polarization-sensitive Mueller-matrix optical coherence tomography and application in burn imaging. Appl Opt. (2003) 42:5191–7. doi: 10.1364/AO.42.005191
78. Villiger M, Bouma BE. Practical decomposition for physically admissible differential Mueller matrices. Opt Lett. (2014) 39:1779–82. doi: 10.1364/OL.39.001779
79. De Boer JF, Milner TE, Stuart Nelson J. Determination of the depth-resolved Stokes parameters of light backscattered from turbid media by use of polarization-sensitive optical coherence tomography. Opt Lett. (1999) 24:300–2. doi: 10.1364/OL.24.000300
80. Jiao S, Wang LV. Jones-matrix imaging of biological tissues with quadruple-channel optical coherence tomography. J Biomed. Opt. (2002) 7:350–8. doi: 10.1117/1.1483878
81. Yasuno Y, Makita S, Endo T, Itoh M, Yatagai T, Takahashi M, et al. Polarization-sensitive complex fourier domain optical coherence tomography for jones matrix imaging of biological samples. Appl Phys Lett. (2004) 85:3023–5. doi: 10.1063/1.1804233
82. Makita S, Yasuno Y, Endo T, Itoh M, Yatagai T. Jones matrix imaging of biological samples using parallel-detecting polarization-sensitive fourier domain optical coherence tomography. Opt Rev. (2005) 12:146–8. doi: 10.1007/s10043-004-0146-8
83. Park J, Kemp NJ, Zaatari HN, Rylander HG III Milner TE. Differential geometry of normalized Stokes vector trajectories in anisotropic media. J Opt Soc Am A. (2006) 23:679–90. doi: 10.1364/JOSAA.23.000679
84. Makita S, Yasuno Y, Endo T, Itoh M, Yatagai T. Polarization contrast imaging of biological tissues by polarization- sensitive fourier-domain optical coherence tomography. Appl Opt. (2006) 45:1142–7. doi: 10.1364/AO.45.001142
85. Wang Y, Yao G. Optical tractography of the mouse heart using polarization-sensitive optical coherence tomography. Biomed Opt Exp. (2013) 4:2540–5. doi: 10.1364/BOE.4.002540
86. Azinfar L, Ravanfar M, Wang Y, Zhang K, Duan D, Yao G. High resolution imaging of the fibrous microstructure in bovine common carotid artery using optical polarization tractography. J Biophoto. (2017) 10:231–41. doi: 10.1002/jbio.201500229
87. Yasuno Y, Yamanari M, Kawana K, Oshika T, Miura M. Investigation of post-glaucoma-surgery structures by three-dimensional and polarization sensitive anterior eye segment optical coherence tomography. Opt Exp. (2009) 17:3980–96. doi: 10.1364/OE.17.003980
88. Yasuno Y, Yamanari M, Kawana K, Miura M, Fukuda S, Makita S, et al. Visibility of trabecular meshwork by standard and polarization-sensitive optical coherence tomography. J Biomed Opt. (2010) 15:061705. doi: 10.1117/1.3499421
89. Götzinger E, Pircher M, Dejaco-Ruhswurm I, Kaminski S, Skorpik C, Hitzenberger CK. Imaging of birefringent properties of keratoconus corneas hy polarization-sensitive optical coherence tomography. Invest Ophthalmol Vis Sci. (2007) 48:3551–8. doi: 10.1167/iovs.06-0727
90. Fukuda S, Yamanari M, Lim Y, Hoshi S, Beheregaray S, Oshika T, et al. Keratoconus diagnosis using anterior segment polarization-sensitive optical coherence tomography. Invest Ophthalmol Vis Sci. (2013) 54:1384–91. doi: 10.1167/iovs.12-10979
91. Fukuda S, Kishino G, Hoshi S, Beheregaray S, Ueno Y, Fukuda M, et al. Repeatability of corneal phase retardation measurements by polarization-sensitive optical coherence tomography. Invest Ophthalmol Vis Sci. (2015) 56:3196–201. doi: 10.1167/iovs.14-16327
92. Pircher M, Hitzenberger CK, Schmidt-Erfurth U. Polarization sensitive optical coherence tomography in the human eye. Prog Retinal Eye Res. (2011) 30:431–51. doi: 10.1016/j.preteyeres.2011.06.003
93. Zotter S, Pircher M, Torzicky T, Baumann B, Yoshida H, Hirose F, et al. Large-field high-speed polarization sensitive spectral domain OCT and its applications in ophthalmology. Biomed Opt Exp. (2012) 3:2720–32. doi: 10.1364/BOE.3.002720
94. Cense B, Wang Q, Lee S, Zhao L, Elsner AE, Hitzenberger CK, et al. Henle fiber layer phase retardation measured with polarization-sensitive optical coherence tomography. Biomed Opt Exp. (2013) 4:2296–306. doi: 10.1364/BOE.4.002296
95. Fortune B, Burgoyne CF, Cull G, Reynaud J, Wang L. Onset and progression of peripapillary retinal nerve fiber layer (RNFL) retardance changes occur earlier than RNFL thickness changes in experimental glaucoma. Invest Ophthalmol Vis Sci. (2013) 54:5653–60. doi: 10.1167/iovs.13-12219
96. Schütze C, Bolz M, Sayegh R, Baumann B, Pircher M, Götzinger E, et al. Lesion size detection in geographic atrophy by polarization-sensitive optical coherence tomography and correlation to conventional imaging techniques. Invest Ophthalmol Vis Sci. (2013) 54:739–745. doi: 10.1167/iovs.11-7877
97. Schlanitz FG, Baumann B, Spalek T, Schütze C, Ahlers C, Pircher M, et al. Performance of automated drusen detection by polarization-sensitive optical coherence tomography. Invest Ophthalmol Vis Sci. (2011) 52:4571–9. doi: 10.1167/iovs.10-6846
98. Ju MJ, Hong YJ, Makita S, Lim Y, Kurokawa K, Duan L, et al. Advanced multi-contrast Jones matrix optical coherence tomography for Doppler and polarization sensitive imaging. Opt Exp. (2013) 21:19412–36. doi: 10.1364/OE.21.019412
99. Hong YJ, Miura M, Ju MJ, Makita S, Iwasaki T, Yasuno Y. Simultaneous investigation of vascular and retinal pigment epithelial pathologies of exudative macular diseases by multifunctional optical coherence tomography. Invest Ophthalmol Vis Sci. (2014) 55:5016–31. doi: 10.1167/iovs.14-14005
100. Augustin M, Fialová S, Himmel T, Glösmann M, Lengheimer T, Harper DJ, et al. Multi-functional OCT enables longitudinal study of retinal changes in a VLDLR knockout mouse model. PLoS ONE (2016) 11:0164419. doi: 10.1371/journal.pone.0164419
101. Li J, Feroldi F, De Lange J, Daniels JMA, Grünberg K, De Boer JF. Polarization sensitive optical frequency domain imaging system for endobronchial imaging. Opt Exp. (2015) 23:3390–402. doi: 10.1364/OE.23.003390
102. Nadkarni SK, Pierce MC, Park BH, de Boer JF, Whittaker P, Bouma BE, et al. Measurement of collagen and smooth muscle cell content in atherosclerotic plaques using polarization-sensitive optical coherence tomography. J Am Coll Cardiol. (2007) 49:1474–81. doi: 10.1016/j.jacc.2006.11.040
103. Kuo WC, Chou NK, Chou C, Lai CM, Huang HJ, Wang SS, et al. Polarization-sensitive optical coherence tomography for imaging human atherosclerosis. Appl Opt. (2007) 46:2520–7. doi: 10.1364/AO.46.002520
104. Nadkarni SK. Optical measurement of arterial mechanical properties: from atherosclerotic plaque initiation to rupture. J Biomed Opt. (2013) 18:121507. doi: 10.1117/1.JBO.18.12.121507
105. Van Der Sijde JN, Karanasos A, Villiger M, Bouma BE, Regar E. First-in-man assessment of plaque rupture by polarization-sensitive optical frequency domain imaging in vivo. Eur Heart J. (2016) 37:1932. doi: 10.1093/eurheartj/ehw179
106. Fu X, Wang Z, Wang H, Wang YT, Jenkins MW, Rollins AM. Fiber-optic catheter-based polarization-sensitive oct for radio-frequency ablation monitoring. Opt Lett. (2014) 39:5066–9. doi: 10.1364/OL.39.005066
107. Saxer CE, De Boer JF, Park BH, Zhao Y, Chen Z, Nelson JS. High-speed fiber-based polarization-sensitive optical coherence tomography of in vivo human skin. Opt Lett. (2000) 25:1355–7. doi: 10.1364/OL.25.001355
108. Pierce MC, Sheridan RL, Hyle Park B, Cense B, De Boer JF. Collagen denaturation can be quantified in burned human skin using polarization-sensitive optical coherence tomography. Burns (2004) 30:511–7. doi: 10.1016/j.burns.2004.02.004
109. Gong P, Chin L, Es'Haghian S, Liew YM, Wood FM, Sampson DD, et al. Imaging of skin birefringence for human scar assessment using polarization-sensitive optical coherence tomography aided by vascular masking. J Biomed Opt. (2014) 19:126014. doi: 10.1117/1.JBO.19.12.126014
110. Strasswimmer J, Pierce MC, Park BH, Neel V, De Boer JF. Polarization-sensitive optical coherence tomography of invasive basal cell carcinoma. J Biomed Opt. (2004) 9:292–8. doi: 10.1117/1.1644118
111. Burns JA, Kim KH, DeBoer JF, Anderson RR, Zeitels SM. Polarization-sensitive optical coherence tomography imaging of benign and malignant laryngeal lesions: an in vivo study. Otolaryngology (2011) 145:91–9. doi: 10.1177/0194599811403078
112. Mogensen M, Joergensen TM, NÜrnberg BM, Morsy HA, Thomsen JB, Thrane L, et al. Assessment of optical coherence tomography imaging in the diagnosis of non-melanoma skin cancer and benign lesions versus normal skin: observer-blinded evaluation by dermatologists and pathologists. Dermatol Surg. (2009) 35:965–72. doi: 10.1111/j.1524-4725.2009.01164.x
113. Patel R, Khan A, Quinlan R, Yaroslavsky AN. Polarization-sensitive multimodal imaging for detecting breast cancer. Cancer Res. (2014) 74:4685–93. doi: 10.1158/0008-5472.CAN-13-2411
114. Villiger M, Lorenser D, McLaughlin RA, Quirk BC, Kirk RW, Bouma BE, et al. Deep tissue volume imaging of birefringence through fibre-optic needle probes for the delineation of breast tumour. Scientific Rep. (2016) 6:28771. doi: 10.1038/srep28771
115. Gladkova N, Streltsova O, Zagaynova E, Kiseleva E, Gelikonov V, Gelikonov G, et al. Cross-polarization optical coherence tomography for early bladder-cancer detection: statistical study. J Biophoton. (2011) 4:519–32. doi: 10.1002/jbio.201000088
116. Kiseleva E, Kirillin M, Feldchtein F, Vitkin A, Sergeeva E, Zagaynova E, et al. Differential diagnosis of human bladder mucosa pathologies in vivo with cross-polarization optical coherence tomography. Biomed Opt Exp. (2015) 6:1464–76. doi: 10.1364/BOE.6.001464
117. Parker KJ, Doyley MM, Rubens DJ. Imaging the elastic properties of tissue: the 20 year perspective. Phys Med Biol. (2011) 56:R1–29. doi: 10.1088/0031-9155/56/1/R01
118. Jaffer OS, Lung PF C, Bosanac D, Shah A, Sidhu PS. Is ultrasound elastography of the liver ready to replace biopsy? a critical review of the current techniques. Ultrasound (2012) 20:24–32. doi: 10.1258/ult.2011.011043
119. Wojcinski S, Farrokh A, Weber S, Thomas A, Fischer T, Slowinski T, et al. Multicenter study of ultrasound real-time tissue elastography in 779 cases forthe assessment of breast lesions: Improved diagnostic performance by combining the BI-RADS®-US classification system with sonoelastography. Ultraschall Med. (2010) 31:484–91. doi: 10.1055/s-0029-1245282
120. Schmitt JM. OCT elastography: imaging microscopic deformation and strain of tissue. Opt Exp. (1998) 3:199–211. doi: 10.1364/OE.3.000199
121. Larin KV, Sampson DD. Optical coherence elastography - OCT at network in tissue biomechanics invited. Biomed Opt Exp. (2017) 8:1172–202. doi: 10.1364/BOE.8.001172
122. Kennedy BF, Kennedy KM, Sampson DD. A review of optical coherence elastography: fundamentals. Techniques and prospects. IEEE J Selected Topics Quant Electron. (2014) 20:272–88. doi: 10.1109/JSTQE.2013.2291445
123. O'Hara KE, Schmoll T, Vass C, Leitgeb RA. Measuring pulse-induced natural relative motions within human ocular tissue in vivo using phase-sensitive optical coherence tomography. J Biomed Opt. (2013) 18:121506. doi: 10.1117/1.JBO.18.12.121506
124. Allen WM, Chin L, Wijesinghe P, Kirk RW, Latham B, Sampson DD, et al. Wide-field optical coherence micro-elastography for intraoperative assessment of human breast cancer margins. Biomed Opt Exp. (2016) 7:4139–53. doi: 10.1364/BOE.7.004139
125. Li C, Guan G, Ling Y, Hsu YT, Song S, Huang JTJ, et al. Detection and characterisation of biopsy tissue using quantitative optical coherence elastography (OCE) in men with suspected prostate cancer. Cancer Lett. (2015) 357:121–8. doi: 10.1016/j.canlet.2014.11.021
126. Akca BI, Chang EW, Kling S, Ramier A, Scarcelli G, Marcos S, et al. Observation of sound-induced corneal vibrational modes by optical coherence tomography. Biomed Opt Exp. (2015) 6:3313–9. doi: 10.1364/BOE.6.003313
127. Qi W, Chen R, Chou L, Liu G, Zhang J, Zhou Q, et al. Phase-resolved acoustic radiation force optical coherence elastography. J Biomed Opt. (2012) 17:110505. doi: 10.1117/1.JBO.17.11.110505
128. Adie SG, Liang X, Kennedy BF, John R, Sampson DD, Boppart SA. Spectroscopic optical coherence elastography. Opt Exp. (2010) 18:25519–34. doi: 10.1364/OE.18.025519
129. Li C, Guan G, Cheng X, Huang Z, Wang RK. Quantitative elastography provided by surface acoustic waves measured by phase-sensitive optical coherence tomography. Opt Lett. (2012) 37:722–4. doi: 10.1364/OL.37.000722
130. Morgner U, Drexler W, Kärtner FX, XD Li, Pitris C, Ippen EP, et al. Spectroscopic optical coherence tomography. Opt Lett. (2000) 25:111–3. doi: 10.1364/OL.25.000111
131. Leitgeb R, Wojtkowski M, Kowalczyk A, Hitzenberger CK, Sticker M, Fercher AF. Spectral measurement of absorption by spectroscopic frequency-domain optical coherence tomography. Opt Lett. (2000) 25:820–2. doi: 10.1364/OL.25.000820
132. Schmitt JM, Xiang SH, Yung KM. Differential absorption imaging with optical coherence tomography. J Opt Soc Am. (1998) 15:2288–96. doi: 10.1364/JOSAA.15.002288
133. Pircher M, Gotzinger E, Leitgeb R, Fercher AF, Hitzenberger CK. Measurement and imaging of water concentration in human cornea with differential absorption optical coherence tomography. Opt Exp. (2003) 11:2190–7. doi: 10.1364/OE.11.002190
134. Yang C, McGuckin L, Simon JD, Choma MA, Applegate B, Izatt JA. Spectral triangulation molecular contrast optical coherence tomographywith indocyanine green as the contrast agent. Opt Lett. (2004) 29:2016–8. doi: 10.1364/OL.29.002016
135. Chong SP, Bernucci M, Radhakrishnan H, Srinivasan VJ. Structural and functional human retinal imaging with a fiber-based visible light OCT ophthalmoscope. Biomed Opt Exp. (2017) 8:323–37. doi: 10.1364/BOE.8.000323
136. Van Der Meer FJ, Faber DJ, Sassoon DMB, Aalders MC, Pasterkamp G, Van Leeuwen TG. Localized measurement of optical attenuation coefficients of atherosclerotic plaque constituents by quantitative optical coherence tomography. IEEE Trans Med Imaging (2005) 24:1369–76. doi: 10.1109/TMI.2005.854297
137. Van Soest G, Goderie T, Regar E, Koljenović S, Van Leenders GLJH, Gonzalo N, et al. Atherosclerotic tissue characterization in vivo by optical coherence tomography attenuation imaging. J Biomed Opt. (2010) 15:011105. doi: 10.1117/1.3280271
138. Schmitt JM, Knuttel A, Yadlowsky M, Eckhaus MA. Optical-coherence tomography of a dense tissue: statistics of attenuation and backscattering. Phys Med Biol. (1994) 39:1705–20. doi: 10.1088/0031-9155/39/10/013
139. Xu C, Schmitt JM, Carlier SG, Virmani R. Characterization of atherosclerosis plaques by measuring both backscattering and attenuation coefficients in optical coherence tomography. J Biomed Opt. (2008) 13:034003. doi: 10.1117/1.2927464
140. Thrane L, Frosz MH, Jørgensen TM, Tycho A, Yura HT, Andersen PE. Extraction of optical scattering parameters and attenuation compensation in optical coherence tomography images of multilayered tissue structures. Opt Lett. (2004) 29:1641–3. doi: 10.1364/OL.29.001641
141. Vermeer KA, Mo J, Weda JJA, Lemij HG, De Boer JF. Depth-resolved model-based reconstruction of attenuation coefficients in optical coherence tomography. Biomed Opt Exp. (2014) 5:322–37. doi: 10.1364/BOE.5.000322
142. Yuan W, Kut C, Liang W, Li X. Robust and fast characterization of OCT-based optical attenuation using a novel frequency-domain algorithm for brain cancer detection. Sci Rep. (2017) 7:44909. doi: 10.1038/srep44909
143. Bell AG. On the production and reproduction of sound by light. Am J Sci. (1880) 20:305–24. doi: 10.2475/ajs.s3-20.118.305
144. Billeh YN, Liu M, Buma T. Spectroscopic photoacoustic microscopy using a photonic crystal fiber supercontinuum source. Opt Exp. (2010) 18:18519–524. doi: 10.1364/OE.18.018519
145. Zhang C, Maslov K, Hu S, Chen R, Zhou Q, Shung KK, et al. Reflection-mode submicron-resolution in vivo photoacoustic microscopy. J Biomed Opt. (2012) 17:020501. doi: 10.1117/1.JBO.17.2.020501
146. Wang LV. Multiscale photoacoustic microscopy and computed tomography. Nat Photon. (2009) 3:503–9. doi: 10.1038/nphoton.2009.157
147. Zhang EZ, Povazay B, Laufer J, Alex A, Hofer B, Pedley B, et al. Multimodal photoacoustic and optical coherence tomography scanner using an all optical detection scheme for 3D morphological skin imaging. Biomed Opt Exp. (2011) 2:2202–15. doi: 10.1364/BOE.2.002202
148. Li L, Maslov K, Ku G, Wang LV. Three-dimensional combined photoacoustic and optical coherence microscopy for in vivo microcirculation studies. Opt Exp. (2009) 17:16450–5. doi: 10.1364/OE.17.016450
149. Liu M, Chen Z, Zabihian B, Sinz C, Zhang E, Beard PC, et al. Combined multi-modal photoacoustic tomography, optical coherence tomography (OCT) and OCT angiography system with an articulated probe for in vivo human skin structure and vasculature imaging. Biomed Opt Exp. (2016) 7:3390–402. doi: 10.1364/BOE.7.003390
150. Zabihian B, Chen Z, Rank E, Sinz C, Bonesi M, Sattmann H, et al. Comprehensive vascular imaging using optical coherence tomography-based angiography and photoacoustic tomography. J Biomed Opt. (2016) 21:096011. doi: 10.1117/1.JBO.21.9.096011
151. Chen Z, Rank E, Meiburger KM, Sinz C, Hodul A, Zhang E, et al. Non-invasive multimodal optical coherence and photoacoustic tomography for human skin imaging. Sci Rep. (2017) 7:17975. doi: 10.1038/s41598-017-18331-9
152. Hu S, Maslov K, Wang LV. Second-generation optical-resolution photoacoustic microscopy with improved sensitivity and speed. Opt Lett. (2011) 36:1134–6. doi: 10.1364/OL.36.001134
153. Liu M. A study of spectral domain optical coherence tomography and photoacoustic microscopy for biometric and biomedical applications. Master Thesis at University of Delaware, Department of Electrical and Computer Engineering (2011). Available online at: http://udspace.udel.edu/handle/19716/10135
154. Liu M, Schmitner N, Sandrian MG, Zabihian B, Hermann B, Salvenmoser W, et al. In vivo three dimensional dual wavelength photoacoustic tomography imaging of the far red fluorescent protein E2-Crimson expressed in adult zebrafish. Biomed Opt Exp. (2013) 4:1846–55. doi: 10.1364/BOE.4.001846
155. Liu T, Wei Q, Wang J, Jiao S, Zhang HF. Combined photoacoustic microscopy and optical coherence tomography can measure metabolic rate of oxygen. Biomed Opt Exp. (2011) 2:1359–65. doi: 10.1364/BOE.2.001359
156. Yang JM, Maslov K, Yang HC, Zhou Q, Shung KK, Wang LV. Photoacoustic endoscopy. Opt Lett. (2009) 34:1591–3. doi: 10.1364/OL.34.001591
157. Yang JM, Chen R, Favazza C, Yao J, Li C, Hu Z, et al. A 2.5-mm diameter probe for photoacoustic and ultrasonic endoscopy. Opt Exp. (2012) 20:23944–53. doi: 10.1364/OE.20.023944
158. Yang Y, Li X, Wang T, Kumavor PD, Aguirre A, Shung KK, et al. Integrated optical coherence tomography, ultrasound and photoacoustic imaging for ovarian tissue characterization. Biomed Opt Exp. (2011) 2:2551–61. doi: 10.1364/BOE.2.002551
159. Boppart SA, Oldenburg AL, Xu C, Marks DL. Optical probes and techniques for molecular contrast enhancement in coherence imaging. J Biomed Opt. (2005) 10:41208. doi: 10.1117/1.2008974
160. Hanahan D, Weinberg RA. Hallmarks of cancer: the next generation. Cell (2011) 144:646–74. doi: 10.1016/j.cell.2011.02.013
161. Ying W. NAD+/NADH and NADP+/NADPH in cellular functions and cell death: regulation and biological consequences. Antioxid Redox Signal. (2008) 10:179–206. doi: 10.1089/ars.2007.1672
162. Zipfel WR, Williams RM, Christiet R, Nikitin AY, Hyman BT, Webb WW. Live tissue intrinsic emission microscopy using multiphoton-excited native fluorescence and second harmonic generation. Proc Natl Acad Sci USA. (2003) 100:7075–80. doi: 10.1073/pnas.0832308100
163. Pan YT, Xie TQ, Du CW, Bastacky S, Meyers S, Zeidel ML. Enhancing early bladder cancer detection with fluorescence-guided endoscopic optical coherence tomography. Opt Lett. (2003) 28:2485–7. doi: 10.1364/OL.28.002485
164. Wang Z, Lee CSD, Waltzer WC, Liu J, Xie H, Yuan Z, et al. In vivo bladder imaging with microelectromechanicalsystems-based endoscopic spectral domain optical coherence tomography. J Biomed Opt. (2007) 12:034009. doi: 10.1117/1.2749744
165. Beaurepaire E, Moreaux L, Amblard F, Mertz J. Combined scanning optical coherence and two-photon-excited fluorescence microscopy. Opt Lett. (1999) 24:969–71. doi: 10.1364/OL.24.000969
166. Pavone FS, Campagnola PJ. Editors. Second Harmonic Generation Imaging Boca Raton, FL: CRC Press. (2013).
168. Said G, Guilbert M, Millerot-Serrurot E, Van Gulick L, Terryn C, Garnotel R, et al. Impact of carbamylation and glycation of collagen type I on migration of HT1080 human fibrosarcoma cells. Int J Oncol. (2012) 40:1797–804. doi: 10.3892/ijo.2012.1393
169. Jiang Y, Tomov I, Wang Y, Chen Z. Second-harmonic optical coherence tomography. Opt Lett. (2004) 29:1090–2. doi: 10.1364/OL.29.001090
170. Vinegoni C, Bredfeldt JS, Marks DL, Boppart SA. Nonlinear optical contrast enhancement for optical coherence tomography. Opt Exp. (2004) 12:331–41. doi: 10.1364/OPEX.12.000331
171. Applegate BE, Yang C, Rollins AM, Izatt JA. Polarization-resolved second-harmonic-generation optical coherence tomography in collagen. Opt Lett.(2004) 29:2252–4. doi: 10.1364/OL.29.002252
172. Vinegoni C, Ralston T, Tan W, Luo W, Marks DL, Boppart SA. Integrated structural and functional optical imaging combining spectral-domain optical coherence and multiphoton microscopy. Appl Phys Lett. (2006) 88:1–3. doi: 10.1063/1.2171477
173. Wu Q, Applegate BE, Yeh AT. Cornea microstructure and mechanical responses measured with nonlinear optical and optical coherence microscopy using sub-10-fs pulses. Biomed Opt Exp. (2011) 2:1135–46. doi: 10.1364/BOE.2.001135
174. Yazdanfar S, Yen YC, So PT C, Laiho LH. Multifunctional imaging of endogenous contrast by simultaneous nonlinear and optical coherence microscopy of thick tissues. Microsc Res Tech. (2007) 70:628–33. doi: 10.1002/jemt.20447
175. Alex A, Weingast J, Weinigel M, Kellner-Höfer M, Nemecek R, Binder M, et al. Three-dimensional multiphoton/optical coherence tomography for diagnostic applications in dermatology. J Biophoton. (2013) 6:352–62. doi: 10.1002/jbio.201200085
176. Wu C, Le H, Ran S, Singh M, Larina IV, Mayerich D, et al. Comparison and combination of rotational imaging optical coherence tomography and selective plane illumination microscopy for embryonic study. Biomed Opt Exp. (2017) 8:4629–39. doi: 10.1364/BOE.8.004629
177. König K, Speicher M, Bückle R, Reckfort J, McKenzie G, Welzel J, et al. Clinical optical coherence tomography combined with multiphoton tomography of patients with skin diseases. J Biophoton. (2009) 2:389–97. doi: 10.1002/jbio.200910013
178. König K. Hybrid multiphoton multimodal tomography of in vivo human skin. IntraVital (2012) 1:11–26. doi: 10.4161/intv.21938
179. Yuan S, Roney CA, Wierwille J, Chen CW, Xu B, Griffiths G, et al. Co-registered optical coherence tomography and fluorescence molecular imaging for simultaneous morphological and molecular imaging. Phys Med Biol. (2010) 55:191–206. doi: 10.1088/0031-9155/55/1/011
180. Xi J, Chen Y, Zhang Y, Murari K, Li MJ, Li X. Integrated multimodal endomicroscopy platform for simultaneous en face optical coherence and two-photon fluorescence imaging. Opt Lett. (2012) 37:362–4. doi: 10.1364/OL.37.000362
181. Raman CV, Krishnan KS. A new type of secondary radiation [11]. Nature (1928) 121:501–2. doi: 10.1038/121501c0
182. Ko AC, Choo-Smith LP, Hewko M, Leonardi L, Sowa MG, Dong CC, et al. Ex vivo detection and characterization of early dental caries by optical coherence tomography and Raman spectroscopy. J biomed Opt. (2005) 10:031118. doi: 10.1117/1.1915488
183. Patil CA, Bosschaart N, Keller MD, Van Leeuwen TG, Mahadevan-Jansen A. Combined Raman spectroscopy and optical coherence tomography device for tissue characterization. Opt Lett. (2008) 33:1135–7. doi: 10.1364/OL.33.001135
184. Patil CA, Kirshnamoorthi H, Ellis DL, Van Leeuwen TG, Mahadevan-Jansen A. A clinical instrument for combined Raman spectroscopy-optical coherence tomography of skin cancers. Lasers Surg Med. (2011) 43:143–51. doi: 10.1002/lsm.21041
185. Ashok PC, Praveen BB, Bellini N, Riches A, Dholakia K, Herrington CS. Multi-modal approach using Raman spectroscopy and optical coherence tomography for the discrimination of colonic adenocarcinoma from normal colon. Biomed Opt Exp. (2013) 4:2179–86. doi: 10.1364/BOE.4.002179
186. Khan KM, Krishna H, Majumder SK, Rao KD, Gupta PK. Depth-sensitive Raman spectroscopy combined with optical coherence tomography for layered tissue analysis. J Biophoton. (2014) 7:77–85. doi: 10.1002/jbio.201200208
187. Potma EO, Xie XS. CARS microscopy for biology and medicine. Opt Photon News (2004) 15:40–5. doi: 10.1364/OPN.15.11.000040
188. Marks DL, Boppart SA. Nonlinear interferometric vibrational imaging. Phys Rev lett. (2004) 92:123905. doi: 10.1103/PhysRevLett.92.123905
189. Marks DL, Vinegoni C, Bredfeldt JS, Boppart SA. Interferometric differentiation between resonant coherent anti-Stokes Raman scattering and nonresonant four-wave-mixing processes. Appl Phys Lett. (2004) 85:5787–9. doi: 10.1063/1.1829162
190. International Organization for Standardization. Ophthalmic Instruments – Optical Coherence Tomograph for the Posterior Segment of the Human Eye (2012). ISO 16971:2015.
191. Tearney GJ, Regar E, Akasaka T, Adriaenssens T, Barlis P, Bezerra HG, et al. Consensus standards for acquisition, measurement, and reporting of intravascular optical coherence tomography studies: a report from the International working group for intravascular optical coherence tomography standardization and validation. J Am Coll Cardiol. (2012) 59:1058–72. doi: 10.1016/j.jacc.2011.09.079
Keywords: multimodal imaging, virtual biopsy, optical coherence tomography, Doppler OCT, OCT angiography, polarization sensitive OCT, photo-acoustics, non-linear microscopy
Citation: Leitgeb RA and Baumann B (2018) Multimodal Optical Medical Imaging Concepts Based on Optical Coherence Tomography. Front. Phys. 6:114. doi: 10.3389/fphy.2018.00114
Received: 09 February 2018; Accepted: 18 September 2018;
Published: 12 October 2018.
Edited by:
Zhen Cheng, Stanford University, United StatesReviewed by:
David Mayerich, University of Houston, United StatesCopyright © 2018 Leitgeb and Baumann. This is an open-access article distributed under the terms of the Creative Commons Attribution License (CC BY). The use, distribution or reproduction in other forums is permitted, provided the original author(s) and the copyright owner(s) are credited and that the original publication in this journal is cited, in accordance with accepted academic practice. No use, distribution or reproduction is permitted which does not comply with these terms.
*Correspondence: Rainer A. Leitgeb, cmFpbmVyLmxlaXRnZWJAbWVkdW5pd2llbi5hYy5hdA==
Disclaimer: All claims expressed in this article are solely those of the authors and do not necessarily represent those of their affiliated organizations, or those of the publisher, the editors and the reviewers. Any product that may be evaluated in this article or claim that may be made by its manufacturer is not guaranteed or endorsed by the publisher.
Research integrity at Frontiers
Learn more about the work of our research integrity team to safeguard the quality of each article we publish.