 Daniel Gratz
 Birce Onal1,2
 Thomas J. Hund
- 1The Dorothy M. Davis Heart and Lung Research Institute, The Ohio State University Wexner Medical Center, Columbus, OH, United States
- 2Department of Biomedical Engineering, College of Engineering, The Ohio State University, Columbus, OH, United States
- 3Department of Internal Medicine, The Ohio State University Wexner Medical Center, Columbus, OH, United States
Computational studies using mathematical models of the sinoatrial node (SAN) cardiac action potential (AP) have provided important insight into the fundamental nature of cell excitability, cardiac arrhythmias, and potential therapies. While the impact of ion channel dynamics on SAN pacemaking has been studied, the governing dynamics responsible for regulating spatial and temporal control of SAN synchrony remain elusive. Here, we attempt to develop methods to explore cohesion in a network of coupled spontaneously active SAN cells. We present the updated version of a previously published graphical user interface LongQt: a cross-platform, threaded application for advanced cardiac electrophysiology studies that does not require advanced programming skills. We incorporated additional features to the existing LongQt platform that allows users to (1) specify heterogeneous gap junction conductivity across a multicellular grid, and (2) set heterogeneous ion channel conductance across a multicellular grid. We developed two methods of characterizing the synchrony of SAN tissue based on alignment of activation in time and similarity of voltage peaks among clusters of functionally related cells. In pairs and two-dimensional grids of coupled cells, we observed a range of conductivities (0.00014–0.00033 1/Ω-cm) in which the tissue was more susceptible to developing asynchronous spontaneous pro-arrhythmic behavior (e.g., spiral wave formation). We performed parameter sensitivity analysis to determine the relative impact of ion channel conductances on cycle length (CL), diastolic and peak voltage, and synchrony measurements in isolated and coupled cell pairs. We also defined measurements of evaluating synchrony based on peak AP voltage and the rate of wave propagation. Cell-to-cell coupling had a non-linear effect on the relationship between ion channel conductances, AP properties, and synchrony measurements. Our simulations demonstrate that conductivity plays an important role in regulating synchronous firing of heterogeneous SAN tissue, and demonstrate how to evaluate the role of coupling and ion channel conductance in pairs and grids of SAN cells. We anticipate that the approach outlined here will facilitate identification of key cell- and tissue-level factors responsible for cardiac disease.
Introduction
The sinoatrial node (SAN) generates the electrical impulse that coordinates mechanical contraction of the heart [1, 2]. Proper SAN function is an essential component for normal pacemaking at baseline and heart rate variation in response to external regulators such as exercise or stress [3, 4]. SAN dysfunction is common in a wide variety of cardiac diseases, and is characterized by sinus bradycardia, sinus pause, and/or inappropriate heart rate responses to exercise and stress [5]. Regulation of SAN activity has great therapeutic potential for a rapidly aging population where SAN disease affects 1 in 600 heart patients over the age of 65 [6]. The only effective treatment for patients with chronic symptomatic sinus node dysfunction is pacemaker implantation [7].
SAN cells demonstrate spontaneous action potential (AP) activity and exhibit a wide variety of dynamic phenomena similar to other coupled oscillators, including collective synchronization [8]. One challenge for studying synchronization of cardiac pacemaking activity is the multiscalar and heterogeneous nature of the sinus node. Pacemaking is governed by a delicate source-sink relationship between the SAN and surrounding atria defined by the need for a relatively small structure (SAN) to excite a much larger tissue mass (surrounding atria) [9, 10]. This source-sink relationship is altered in disease due to increased fibrosis and/or cell loss leading to a shift of the primary pacemaker site, emergent behavior of ectopic foci, or otherwise reduced capacity for SAN pacemaking [11–13]. There is a critical need to expand knowledge regarding regulation of membrane ion channels in the SAN, as well as to further develop quantitative tools to assess the sensitivity of the SAN to changes in coupling and ion channel regulation [14].
Mathematical modeling has been used to investigate and advance our understanding of cardiac electrophysiology, arrhythmia mechanisms, and potential therapies [15]. Models have been particularly helpful in elucidating the ionic basis of SAN activity and cardiac pacemaking [16, 17]. For example, SAN cell models have furthered our understanding of the relative importance of coupling between Ca2+ cycling and membrane ion channels in automaticity [18] and the genetic basis of human SAN disease [19]. At the same time, multicellular models of coupled SAN cells have demonstrated dynamic changes in the location of the primary pacemaker site in response to β-adrenergic stimulation [20]. Other studies have coupled heterogeneous cell types in multicellular preparations to examine the influence of inexcitable cells (e.g., fibroblasts) on pacemaking [21, 22].
Although mathematical modeling has undoubtedly advanced our understanding of SAN function, there remain significant barriers to more widespread use of mathematical modeling and simulation in the field. To reduce these barriers a cross-platform user interface called LongQt has been developed for advanced cardiac electrophysiology and arrhythmia simulations [23]. Here, we present an extended user interface for LongQt, which adds support for performing advanced multicellular simulations. With this added utility, the influence of perturbations in SAN cell electrophysiology (ion channel conductance and gap junction conductivity) on synchronization of coupled heterogeneous SAN cells was investigated. Two complimentary measures were defined to quantify the level of synchronization between coupled cells: synchrony factor and peak transmembrane potential (Vm,peak) similarity. Parameter sensitivity analysis was performed in single cells and in coupled cell pairs to determine the impact of ion channel and gap junction properties on cycle length (CL), peak and diastolic Vm, and measures of synchrony. Finally, we performed two-dimensional simulations in a network of 7 × 7 heterogeneous SAN cells to examine the influence of cell properties and gap junction conductivity on pacemaking. These studies generate a number of interesting findings, including: (1) conductivity caused small but potentially important differences in the relative impact of ion channel conductances on AP properties in coupled cells; (2) a specific coupling range promoted emergent asynchronous behavior; and (3) quantitative measurements were defined to evaluate synchrony based on peak AP voltage and the rate of propagation within a group of coupled firing cells. While our findings highlight the difficulty of relating events at the single cell level to an emergent behavior like pacemaking, they also point to more robust methods for understanding the ionic basis of cardiac pacemaking.
Materials and Methods
Ion channel kinetics were simulated using an existing well-validated model of the rabbit SAN cell implemented in LongQt simulation software [23, 24] (Figure 1A). Briefly, the LongQt simulation software has three main user interfaces: the grid editor, the main user interface, and the grapher. The simulations performed for this study were set up using the grid editor, which allows the user to select tissue geometry and gap junction conductivity for a set of simulations. The files generated by the grid editor can be selected to run in the main user interface, which also allows the user to select the cell model and measure properties of the simulation. Simulation results generated at the end of the simulation can be visualized by the grapher interface.
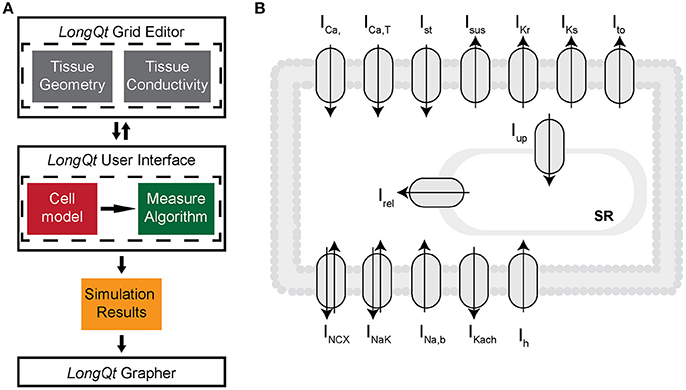
Figure 1. (A) LongQT simulation software uses an object-oriented design where a “Cell” class describes the workings of an individual cell, i.e., Rabbit SAN cell vs. Human Ventricular cell. Cell classes then are used by “Protocol” classes to define what type of simulation is being run on the cell. This could be a simulation with constant stimulus or periodic stimulus. Simulations of fiber and grid tissue require additional objects that go between Protocols and Cells to define properties of the tissue like its geometry and conductivity. Finally there is a ”Measure” class which tracks values such as Peak Voltage or Ca2+ minimum. (B) Schematic diagram of the rabbit SAN cell model, which includes mathematical representations of ion currents important for generating the sinoatrial node cell action potential: L-type and T-type Ca2+ currents (ICaL and ICaT), Rapid and slow components of the delayed rectifier K+ currents (IKr and IKs), 4AP-sensitive transient outward and sustained K+ currents (Ito and ISus), acetylcholine-sensitive K+ current (IKach), Hyperpolarization-activated funny current (Ih), Na+/Ca2+ exchanger (INCX), Na+/K+ pump (INaK), and Ca2+ signaling uptake (jup) into the network sarcoplasmic reticulum (NSR), transfer (jtr) into the junctional SR (JSR), and release (jrel) into the subspace.
Multicellular Simulations
Multicellular simulations were performed in either a cell pair or 7 × 7 grid. The two-dimensional cable equation was solved using the Peaceman-Rachford alternating direction implicit method. The level of conductivity between cells was perturbed about a default value of 0.33 1/Ω-cm. A heterogeneous population of SAN APs were created by varying eight ion channel conductances (ICa,L, ICatt, Ih, IKr, IKs, INCX, INaK, Ito) lognormally, with a mean of 1 and a standard deviation of 0.2. Spontaneous APs were simulated for 50–100 s until steady state was reached. AP properties such as CL, Vm,peak, and maximum diastolic potential (MDP) were measured using LongQt. All other analysis was performed with scripts written in Python version 3, which are available on Github.
Synchrony Measurements
In order to develop measurements of synchrony in multicellular simulations, we organized APs from individual cells in the grid into “activation clusters,” which represent a group of neighboring cells whose activation could be considered related both in time and space. To organize cells into clusters, we ordered them sequentially according to their respective activation times. The sequence was then processed in order and a cell was added to a cluster if its position was within three cells of any cell already in the cluster. For higher gap junction conductivities, we increased the spatial window to five cells to account for increased communication between cells. If an activated cell was not spatially close enough to any existing group of firing cells, then it was marked as the focus of a separate and distinct cluster. Any cluster would be considered complete when one of its constituent cells fired again. This allowed for characterization of multiple clusters simultaneously within the same grid (common in lower conductivity grids).
For example, given an ordered sequence of cell activation times (Cell1,1, Cell1,2, Cell5,5, Cell1,1, Cell1,3), where Celli, j is located in the ith row and jth column of a two-dimensional grid, the clustering algorithm would select Cell1,1 as the beginning of a new cluster, C1, as there are no other existing clusters. The second cell in the sequence, Cell1,2, would then be added to C1 as it is within three cells of Cell1,1. Cell5,5, however, is too far away from C1 and so would be marked as the beginning of a new cluster, C2. Since Cell1,1 is already assigned to C1, its appearance a second time in the sequence causes the algorithm to initialize a new cluster C3. Finally, the last element in the sequence, Cell1,3, would be added to C3.
Vm,peak similarity is calculated as the inverse of the standard deviation of Vm,peak in each cluster. The synchrony factor is calculated as the inverse of the slowest propagation time between the closest cells in a cluster. These two measurements are then weighted by the size of the cluster in order to account for the number of oscillators in the network.
Software and Hardware
LongQt simulation software utilizes the Qt application framework (version 5.6 or later found at https://www.qt.io) and may be compiled to run on Mac (OS X 10.10 or later), Windows (version 7 or later) or Linux systems. Python bindings for LongQt are available for more extensive simulation use. Compiled versions of LongQt are available as downloadable executable files under the “Research” section of the Hund lab website1, and are accessible through Github2. LongQt incorporates C++ code for the Kurata SAN cell model (Figure 1B). Differential equations for the simulated model are solved in LongQt using the forward Euler approach, with a maximum timestep of 0.05 ms and a minimum timestep of 0.005 ms. A subset of simulations were run using Ohio Supercomputer Center resources [25]. Data supporting conclusions of this manuscript are available upon request to the corresponding author.
Results
Effect of Coupling on Parameter Sensitivity in Coupled Pairs of Sinoatrial Node Cells
Parameter sensitivity analysis has been performed mostly on models of the single cell to elucidate mechanisms underlying cardiac AP generation [26–30]. Using the extended LongQt platform, we sought to address the extent to which coupling influences the dynamics of synchronous firing in a network of SAN oscillators with heterogeneous ion channel activity. We first coupled a simulated wild-type (WT) to a variant SAN cell (scaling factors defined as follows: ICa,L = 3.19472, ICatt = 2.59237, Ih = 2.64054, IKr = 2.3018, IKs = 2.93799, INCX = 2.79239, INKA = 2.45686, Ito = 2.06311) and observed spontaneous AP properties for coupled and uncoupled pairs (Figures 2, 3). As expected, despite very different AP properties of the individual cells, a normal degree of coupling eliminated differences between the two cells. Interestingly, the steady-state CL, DDR, and MDP values of the coupled cells were closer to that of the single cell with the shortest CL (in this case, the variant cell). This phenomenon is consistent with observations of shifts of the SAN pacemaker site in cardiac disease from the original area of excitation to areas with the earliest depolarization [31].
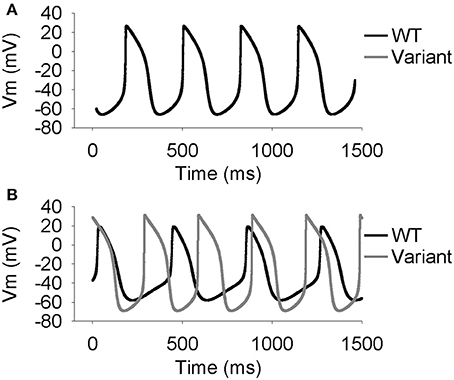
Figure 2. Simulated spontaneous SAN action potentials in one WT cell and one cell with lognormally perturbed ion channel factors. Simulations were run to steady state (50 s). (A) At a conductivity of 0.33 (1/Ω-cm), which is the normal conductivity between two WT cells, the cells synchronize both the voltages and the times at which they fire. (B) At a conductivity of 0 (1/Ω-cm) the cells are uncoupled and act the same as if they were run independently.
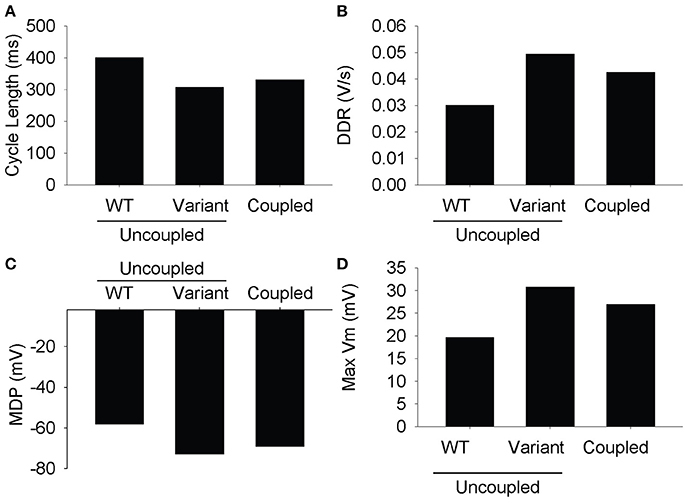
Figure 3. Measured steady state values from the last action potential in the simulation. The differences between the two cells are resolved at full conductivity to a value somewhere between the two cells. (A) Cycle length, (B) diastolic depolarization rate, (C) max diastolic potential, (D) max voltage.
To provide insight into the influence of coupling on spontaneous AP dynamics, we performed parameter sensitivity analysis on the single cell by generating 616 AP variants and performing linear regression on the dataset. We compared these results to a separate regression analysis on a dataset where the variant was coupled to a WT cell (Figure 4). For the most part, regression coefficients relating ion channel conductances to AP properties were similar for single and coupled cells. For example, perturbations in maximal conductances of the L-type Ca2+ current (ICa,L) and the transport rate of the Na+/K+ ATPase (INaK) have a large positive influence on Vm,peak in both single and coupled simulations, while perturbations in conductances of the T-type Ca2+ current (ICatt), rapid delayed rectifier K+ current (IKr), and transient outward K+ current (Ito) are inversely related, i.e., an increase in ICatt, IKr, or Ito decrease peak Vm. Despite the overall agreement, there are small but interesting differences between sensitivity of the single vs. coupled cell. First, while ICa,L has a positive effect on CL and Vm,peak in both single and coupled cells, its influence is diminished in the coupled cell. Likewise, coupling reduces the influence of ICa,L on DDR and MDP. In contrast, our simulations predict that coupling increases the effect of IKr, at least with respect to DDR and CL.
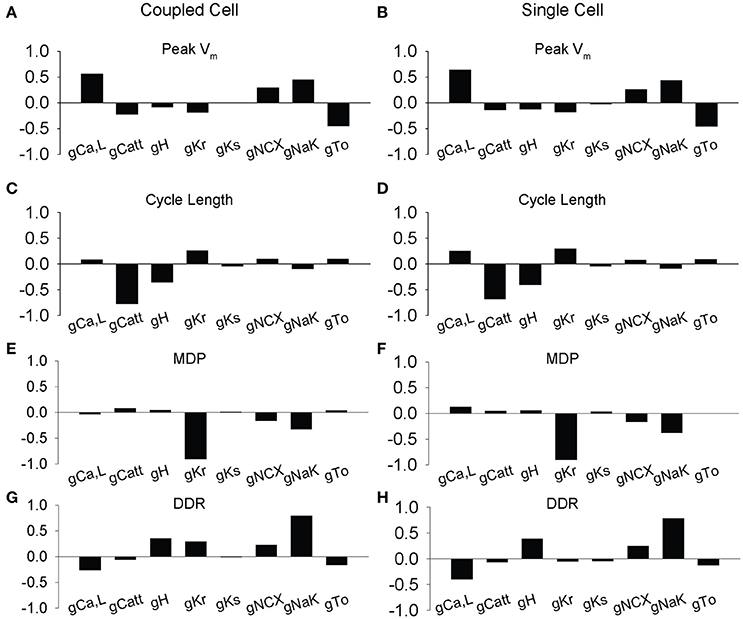
Figure 4. Partial least-squares regression analysis of ionic gating variables in the rabbit sinus node model. Regression coefficients showing how changes in model parameters affect membrane dynamics in two coupled simulated SAN cells. 616 simulations were performed at a normal coupling strength (0.33) between one WT and one variant cell with random ion channel factors (L-type Ca2+ current ICa,L, T-Type Ca2+ current ICa,T, hyperpolarization-activated current IH, rapidly activating delayed rectifying K+ current IKr, slowly activating delayed rectifying K+ current IKs, Na+/Ca2+ exchanger INCX, Na+/K+ ATP-ase INaK, transient outward K+ current Ito) perturbed over a lognormal distribution, with a mean of 1.0 and a standard deviation of 0.2. Parameter sensitivities of ion channel conductance parameters affect (A–B) peak membrane voltage, (C–D) cycle length, (E–F) max diastolic potential (MDP), and (G–H) diastolic depolarization rate (DDR). The impact of ICa,L, ICatt, Ito, IKr, and INaK contributed highly to membrane voltage dynamics including peak (ICa,L, INaK, Ito), cycle length (ICatt), diastolic membrane voltage (IKr, INaK), and diastolic depolarization rate (INaK).
To provide additional insight into the influence of coupling strength on sensitivity analysis, we performed 6160 simulations (10 conductivities, 616 simulations of a WT cell coupled to a variant cell) over a range of conductivities (Figure 5). In many instances, the regression coefficients mapping ion channel conductances to AP properties were found to be independent of coupling strength, especially for Vm,peak and MDP. However, interesting exceptions to this behavior were observed for CL and DDR, where regression coefficients for specific ion channels were highly dependent on coupling strength (e.g., ICa,L, ICa,tt, Ih for CL and Ih and IKr for DDR) This series of simulations suggests that the relative importance of specific ion channels for cardiac pacemaking changes in subtle but important ways across a range of coupling values.
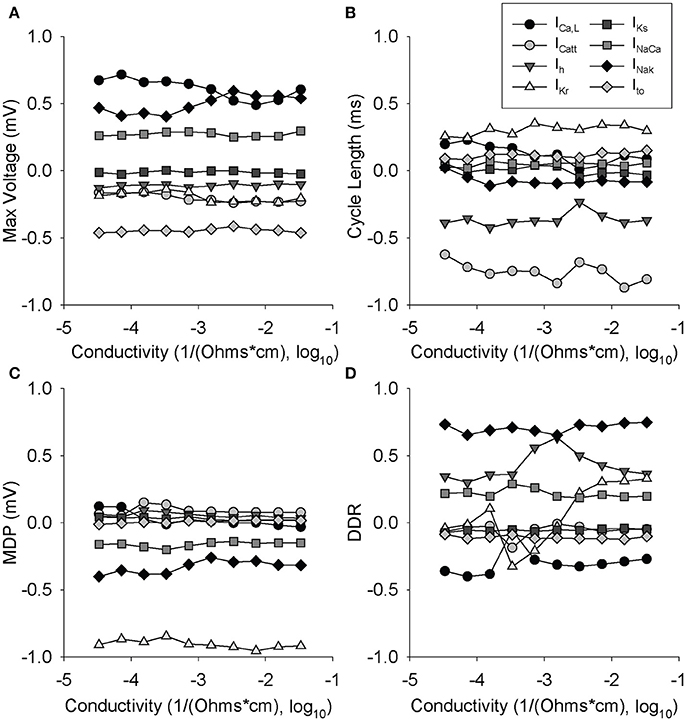
Figure 5. Partial least-squares regression analysis of ionic gating variables vs. cell conductivity. Two cells were paired where one was lognormally perturbed with a mean of 1 and a standard deviation of 0.2, while the other cell was WT. 616 simulations were run at each conductivity for the least-squares regression at each of 10 different conductivities. Regression coefficients are shown over a range of gap junction conductivities for: (A) Max voltage, (B) cycle length, (C) max diastolic potential, (D) diastolic depolarization rate.
We sought to explore coupling effects over a range of 25 different coupling strengths with a WT cell coupled to 20 different variants (totaling 500 different simulations of two coupled cells). We plotted the average steady-state values of the MDP, Vm,peak, and CL for both the coupled WT and variant cells at each coupling value. As expected, values for MDP, Vm,peak, and CL converge in the WT and variant cell as gap junction conductivity increases (Figure 6). Interestingly, CL appears to synchronize at lower conductivity values compared to other AP properties. Furthermore, a small window of interesting dynamics characterized by increased standard deviation values for AP properties was observed around 10−3.8 1/Ω-cm.
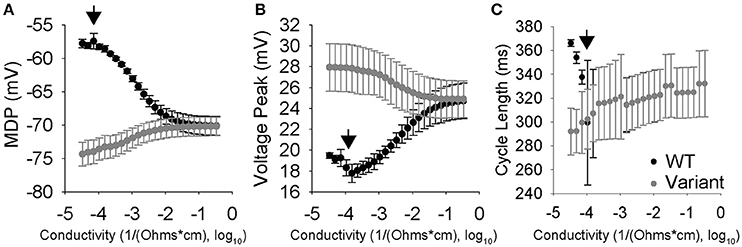
Figure 6. Conductivity vs. cell properties for two coupled SAN cells where one cell was perturbed lognormally, while the other cell is a WT. Data points are the average of 20 simulations with the error bars corresponding to one standard deviation. (A) Max diastolic potential vs. Conductivity. Max diastolic potential synchronizes at higher conductivities and the means become equal around 10−1.6 1/Ω-cm. Larger standard deviations are observed around 10−4 1/Ω-cm. (B) Peak voltage vs. conductivity. Peak voltage equalizes at higher conductivities and the means become equal around 10−1 1/Ω-cm. Larger standard deviations are observed in the 10−4 and 10−3 1/Ω-cm range. (C) Cycle Length vs. Conductivity. Cycle length synchronization happens at much lower conductivities than the others, with the means equalizing between 10−4 and 10−3 1/Ω-cm. It is in this range that the cells are highly interactive but not fully able to synchronize, which is indicated by large standard deviations.
Effect of Coupling in Two-Dimensional Simulations of Heterogeneous SAN Cells
We hypothesized that the range of conductivities identified in Figure 6 with large standard deviations would promote asynchronous activity in two-dimensional simulations of heterogeneous SAN cells. We simulated 7 × 7 grids of variant SAN cells with homogeneous cell-to-cell coupling, for 25 different conductivities. At low coupling values most SAN cells oscillate without interacting with each other (Supplementary Videos 1, 2). The range of values indicated by arrows in Figure 6 was also the range in which spiral wave activity was sustained in the two-dimensional grid simulation (Supplementary Videos 3, 4). For higher degrees of cell-to-cell coupling, cells across the grid were fully synchronized (Supplementary Videos 5, 6). This set of simulations suggests that coupling can promote an arrhythmogenic substrate, even in a small group of pacemaker cells.
Quantifying Synchrony in Two-Dimensional Simulations of Heterogeneous SAN Cells
We sought to quantify the level of synchrony in a two-dimensional grid in order to quantitatively distinguish between spiral wave formation (Supplementary Videos 3, 4), completely asynchronous activity (Supplementary Videos 1, 2) and synchronous firing (Supplementary Videos 5, 6). Plotting beat-to-beat CL for all 49 cells in a 7 × 7 grid for three different gap junction conductivities demonstrates a wide range of steady-state CLs when the propagating wave is random (Figure 7A), large deviations when spiral waves are formed (Figure 7B, <20 s), and a uniform CL across the grid when the tissue is oscillating synchronously (Figure 7B, >20 s and Figure 7C). Plotting beat-to-beat CL at normal conductivities shows uniform CL across all cells in the simulation (Figure 7C).
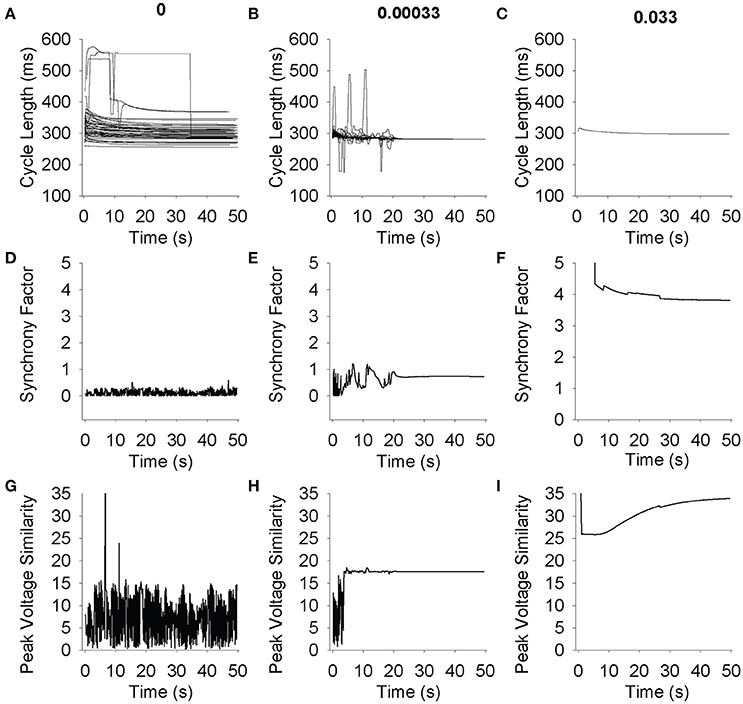
Figure 7. Simulations were run on a 7 × 7 grid for 50 s. Each cell was randomly perturbed using a lognormal distribution with a mean of 1 and a standard deviation of 0.2. (A–C) Cycle length for 49 cells is shown over time. At low conductivities (A) cells do not synchronize, and as conductivity increases the cells begin to interact and find a common cycle length (B) and eventually fire at a common cycle length immediately (C). (D–F) Synchrony factor vs. Time. The synchrony factor measurement is the longest amount of time it takes the peak of the action potential to propagate from any cell to its neighbor. Low values indicate random and low synchrony factor waves (D). The larger peaks and valleys that appear in higher conductivities (E) correlate with spiral wave formation and multiple wave fronts in the grid. When cells interact and fire in cohesive synchronization (F), synchrony factor becomes higher and stabilizes. (G–I) Peak voltage similarity vs. Time. The peak voltage similarity measurement is the inverse of the standard deviation of the voltage values across the grid. Low conductivities indicate random noisy peak voltage similarity waves (G). As conductivity increases, peak voltage similarity increases and stabilizes initial noisy values (H). At higher conductivities, peak voltage similarity display no errant behavior (I).
The synchrony factor, which represents the inverse of the longest conduction time between two cells in the same cluster, approaches zero and demonstrates noise (0.5 amplitude trace) for chaotic asynchronous simulations where the cells are not interacting with each other (Figure 7D). When coupling is in a range that sustains spiral wave activation, the spiral waves can be visualized in the peaks and valleys of synchrony factor over time (Figure 7E, <20 s). As coupling increases to normal consistent propagation across the entire grid, the synchrony factor increases and maintains a steady value (Figure 7E, >20 s and Figure 7F). Synchrony factor values above 1 consistently represented fully synchronized grids, and below 0.5 consistently represented asynchronous random poorly coupled oscillations.
Vm,peak similarity, which represents the inverse of the standard deviation of peak voltages in one beat, approaches zero with high-amplitude fluctuations for chaotic asynchronous simulations (Figure 7G). As a simulation transitions from asynchronous (Figure 7H, <5 s) to an organized, complex activation (spiral wave, Figure 7H, >5 and <20 s) Vm,peak similarity rapidly reaches a single steady-state value after a brief period of low amplitude fluctuation. Synchronized activation produces a large steady-state value for Vm,peak similarity with a brief latency (Figure 7I). These results demonstrate the utility of quantifying synchrony measures to distinguish between random, spiral, and synchronous propagating waves sustained by coupling differences in heterogeneous SAN tissue. Vm,peak similarity values above 15 consistently represented fully synchronized grids, and below 10 consistently represented asynchronous random poorly coupled oscillations.
We performed parameter sensitivity analysis on coupled cells to determine the relative ion channel contributions to the synchrony factor and peak voltage similarity measurement (same 616 simulations as Figures 4A–D). At normal gap junction conductivity, synchrony factor is not dominated by any single ion channel conductance (relatively small regression coefficients for all conductances) with surprisingly little contribution from Ih (Figure 8A). However, ICa,L and INaK both had a large negative contribution and Ito a large positive contribution to Vm,peak similarity (Figure 8B). The relationships observed in Figure 8B also seemed to be an inverse of the contributions to peak voltage in previous simulations (Figure 4A). When we performed parameter sensitivity analysis over a range of conductivities, we observed that the relationship between each individual ion channel's contribution and synchrony factor was non-linear with respect to conductivity (Figure 4C). Interestingly, any shifts from a positive to negative contribution occurred in the range of 10−4 1/Ω-cm which is the same range that we observed sustained spiral wave activity (Supplementary Videos 3, 4) and large standard deviations in CL (Figure 6C).
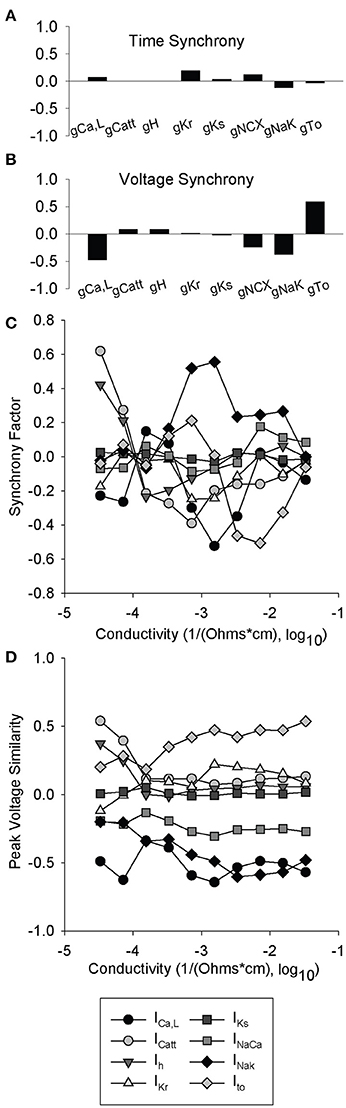
Figure 8. Partial least-squares regression analysis of synchrony factor and peak voltage similarity metrics. 616 simulations were run with two paired cells where one was lognormally perturbed with a mean of 1 and a standard deviation of 0.2, while the other cell was a WT. Ion channel coefficients did not have a significant impact on (A) synchrony factor. In contrast, parameter sensitivity analysis indicates that the impact of ICa,L, INaK, and Ito greatly impact the (B) peak voltage similarity metric. (C,D) Partial least-squares regression analysis of ionic gating variables vs. cell conductivity. At each conductivity simulations were run as in (A) and (B) and a total of 10 different conductivities were examined. (C) Synchrony factor is very non-linear with a range between 10−4 and 10−3 1/Ω-cm in which all the ion channel coefficients are very close to 0. (D) Peak voltage similarity is mostly linear with an exception between 10−4 and 10−3 1/Ω-cm where most of the ion channel coefficients pinch toward 0.
Discussion
In this study, we use mathematical modeling to explore the role of coupling on spontaneous AP dynamics and synchronization of pacemaking. Our simulations led to a number of important findings, including: (1) While parameter sensitivity analysis reveals a similar relationship between ion channel conductances and AP properties in single and coupled cells, our simulations predict small but potentially important differences, including complicated effects of coupling on the influence of ICa,L and IKr; (2) a specific coupling range in simulations promoted complex emergent behavior (including spiral wave activation) and at values higher than this coupling range cells fired together synchronously; (3) We define an approach for first defining groups of related cells (activation clusters) and then characterizing their synchrony (synchrony factor and peak voltage similarity), which facilitates quantification and visualization of synchronous behavior in a two-dimensional heterogeneous grid of SAN cells. Our studies are distinct from previous studies investigating coupling between spontaneously activating oscillators in that we employ an AP model that describes detailed ion channel kinetics. Another novel aspect of this set of studies is the introduction of updated LongQt simulation software to explore the impact of heterogeneous ion channel expression and gap junction conductivity in multicellular simulations. LongQt is cross-platform and available for download at hundlab.org, and may be useful in future exploration of conductivity in two-dimensional simulated tissue.
Previous studies have explored coupling inhomogeneity between simulated SAN cells and observed trends of synchronous firing and heterogeneous tissue becoming homogeneous through a democratic entrainment process at sufficient coupling values [20, 32, 33]. Our studies also support the theory of a democratic entrainment process both at the level of two coupled cells (Figure 6) where both cells adjusted their transmembrane dynamics to adjust to a new value that was distinct from firing alone. All grid simulations with uniform wave propagation began activation from a cluster of cells firing together rather than a single cellular driver (Supplementary Videos 1–6). This cluster size was different for different coupling values, indicating that the multicellular simulations demonstrated mutual entrainment of SAN cells.
The SAN is a small structure that is insulated from the rest of the right atrium, and employs a limited number of conduction pathways in order to activate the surrounding tissue [34, 35]. In the SAN, cells form groups with high degrees of coupling between cells in a group and much lower amounts of coupling at the border of groups [36, 37]. Conduction barriers due to fibrosis or structural remodeling may inhibit healthy SAN activation, and initiate SAN microreentrant waves [38]. Previous simulation studies have observed that microreentrant conduction was not sustained by AP changes, and required a large center of fibrotic tissue to produce microreentry [22]. We identified a specific range of low coupling that sustained emergent spiral wave behavior in a heterogeneous grid of SAN APs, indicating that increased coupling is a crucial component to synchronization of pacemaker cells and sufficient coupling may override differences in cell-to-cell transmembrane dynamics. Notably, our simulations did not require implementing a “track” of fibrotic tissue around which the AP wave could propagate, but still resulted in emergent behavior. The synchrony factor measurement, which best represents how closely together cells are firing within a beat, demonstrated a non-linear relationship with respect to coupling (Figure 8A). This further supports the idea that coupling non-linearly alters the ability of SAN cells to fire synchronously.
In previous work, Michaels et al. examined the effects of cell-to-cell coupling strength on entrainment [20, 33]. They tested both paired cells as well as small grids. In paired cells they observed that the cells tended to synchronize to a CL closer to the faster cell. In a grid they found that the apparent wave front slowed as coupling strength decreased, however they did not see spiral waves or other conduction issues. They also tested a grid with a partial wall of inexcitable tissue and found that the cells on the other side were still trained, although slightly delayed.
Shifts in the location and size of the SAN pacemaker may occur as a compensatory mechanism in response to sinus node dysfunction, vagal nerve stimulation, or pharmacological block of the Na+ current or L-type Ca2+ current [31]. Our simulations show that a heterogeneous SAN with low coupling will sustain pro-arrhythmic behavior, but increasing coupling may help synchronize the entire grid. A shift in size and location of the pacemaker may be beneficial due to coupling changes; this shift transforms the pacemaker into a larger group of highly coupled cells, which our simulations show can synchronize through a democratic entrainment process regardless of ion channel heterogeneity. These studies also suggest that altering gap junction coupling in the SAN may promote healthy pacemaking activity.
The studies presented here perform a variety of parameter sensitivity analyses in order to deconstruct the relationship between ion channel conductance, conductivity, SAN transmembrane properties (DDR, MDP, peak voltage, and CL), and the proposed measurements of synchrony (synchrony factor and peak voltage similarity). Both ICa,L and IKr demonstrated a high contribution to transmembrane dynamics and non-linear behavior with respect to transmembrane properties and synchrony metrics. This is further supported by experimental evidence of sinus node impairment or dysfunction related to modulation of L-type Ca2+ current [39, 40] or hERG channel function [41, 42]. The parameter sensitivity analysis also demonstrates that the relationship between specific ion channel conductances may vary depending on cell-to-cell coupling values (Figures 5, 8). This suggests that it is not necessarily sufficient to extrapolate effects of single cell perturbation to emergent behavior at the tissue level.
The emergent behavior of coupled oscillators has been widely explored in both computational and experimental studies of multiple areas of biology such as mitochondrial, circadian rhythms, synaptic firing, and broader ecological studies. Synchronization and its quantification has been widely discussed in networks of coupled oscillators [43–46]. Our hope is that these set of studies contributes to an already diverse set of work and adds to understanding of the impact of ion channel behaviors as well as coupling in the SAN pacemaker. We also believe that the synchrony metrics presented here would be useful for quantifying dynamics in larger tissue experiments such as optical mapping experiments. Future studies quantifying synchronization of coupled SAN oscillators in tissue or determining the impact of ion channel changes on generation of microreentrant arrhythmias may help support the findings in the simulations shown here.
Limitations
While these mathematical modeling studies are based on a well-validated single cell model of the rabbit SAN AP, the two-dimensional simulations have important limitations based on experimental data. For the sake of simplicity, SAN cells were coupled in a uniform rectangular grid with homogeneous coupling strengths, but this does not match the detailed physiology of the three-dimensional atrium. Similarly, heterogeneity of the SAN is modeled as either a gradient with AP differences between the central and periphery of the node, or a mosaic with a variable mix of SAN and atrial cells from periphery to the center. The gradient model is supported by a wide range of experimental data and simulations showing a change in the transmembrane properties of the SAN between the periphery and the center, a change in the density of ion channels responsible for INa and If, and a lack of atrial cells in the center of the SAN [47, 48]. The studies presented here more closely represent the mosaic model, but are distinct in that only SAN cells are implemented (no randomly placed atrial cells are simulated in the grid simulations). It is also important to note that the grid used in our studies contains a relatively small number of cells compared to the actual SAN. However, based on previous work [36, 37], it is possible to consider each cell in the grid as representative of a group of cells so that the behavior observed in our grid should scale to larger dimensions. Finally, these simulations did not implement parasympathetic stimulation of tissue, or patch of atrial tissue surrounding the SAN to further explore activation of atrial tissue by the SAN complex. This is especially important to note in two-dimensional simulations using a rabbit SAN model, since the architecture of the rabbit sinus node and its subsequent conduction pathways is distinct from human [31]. Conductivities between cells in these simulations were fixed, so the tubular shape of cells was ignored. In addition, we observed emergent behavior at the edges of large grid simulations, which may be an artifact of the simulation setup. While outside the scope of the current study, going forward it would be interesting to design experiments to test model predictions in in ex vivo preparations.
Author Contributions
DG, BO, AD, and TH participated in design of study; DG, AD, and BO performed simulations, analyzed data, and wrote the manuscript; DG, BO, and TH revised the manuscript.
Funding
This work was supported by NIH (grant numbers HL114893, HL134824, HL135096 to TH; HL129766 to BO); James S. McDonnell Foundation (to TH); Saving tiny Hearts Society (to TH); and a TriFit Challenge grant from Ross Heart Hospital and Davis Heart and Lung Research Institute.
Conflict of Interest Statement
The authors declare that the research was conducted in the absence of any commercial or financial relationships that could be construed as a potential conflict of interest.
Supplementary Material
The Supplementary Material for this article can be found online at: https://www.frontiersin.org/articles/10.3389/fphy.2018.00063/full#supplementary-material
Supplementary Videos 1–6. Movies of cell voltages in 7 × 7 grids depicting asynchronous activity (Video 1), spiral waves (Video 3), and synchronous activity (Video 5) from Figure 7. As propagation across the grid happens very quickly, the movies are slowed by a factor of 2X. The end of the spiral wave from Figure 7B thus happens at t = 40 s in the video as opposed to t = 20 s in the simulation. Additional movies depicting clusters in the same 7 × 7 grids from Figure 7 are labeled Videos 2, 4, 6 for asynchronous, spiral waves, and synchronous activity, respectively. These movies show clusters of cell action potentials forming and then being removed. Colors for the clusters repeat regularly and are not for any purpose besides distinguishing the clusters. As the time for a cluster to propagate is very fast, these movies are slowed by a factor of 4X. All movies were created at a constant 40 fps using python plotting library (matplotlib).
Footnotes
References
1. Dobrzynski H, Boyett MR, Anderson RH. New insights into pacemaker activity: promoting understanding of sick sinus syndrome. Circulation (2007) 115:1921–32. doi: 10.1161/CIRCULATIONAHA.106.616011
2. Mangoni ME, Nargeot J. Genesis and regulation of the heart automaticity. Physiol Rev. (2008) 88:919–82. doi: 10.1152/physrev.00018.2007
3. Quinn TA, Kohl P. Mechano-sensitivity of cardiac pacemaker function: pathophysiological relevance, experimental implications, and conceptual integration with other mechanisms of rhythmicity. Prog Biophys Mol Biol. (2012) 110:257–68. doi: 10.1016/j.pbiomolbio.2012.08.008
4. Dobrzynski H, Anderson RH, Atkinson A, Borbas Z, D'Souza A, Fraser JF, et al. Structure, function and clinical relevance of the cardiac conduction system, including the atrioventricular ring and outflow tract tissues. Pharmacol Ther. (2013) 139:260–88. doi: 10.1016/j.pharmthera.2013.04.010
7. Vardas PE, Simantirakis EN, Kanoupakis EM. New developments in cardiac pacemakers. Circulation (2013) 127:2343–50. doi: 10.1161/CIRCULATIONAHA.112.000086
9. Unudurthi SD, Wolf RM, Hund TJ. Role of sinoatrial node architecture in maintaining a balanced source-sink relationship and synchronous cardiac pacemaking. Front Physiol. (2014) 5:446. doi: 10.3389/fphys.2014.00446
10. Wolf RM, Glynn P, Hashemi S, Zarei K, Mitchell CC, Anderson ME, et al. Atrial fibrillation and sinus node dysfunction in human ankyrin-B syndrome: a computational analysis. Am J Physiol Heart Circ Physiol. (2013) 304:H1253–66. doi: 10.1152/ajpheart.00734.2012
11. Sanders P, Kistler PM, Morton JB, Spence SJ, Kalman JM. Remodeling of sinus node function in patients with congestive heart failure: reduction in sinus node reserve. Circulation (2004) 110:897–903. doi: 10.1161/01.CIR.0000139336.69955.AB
12. Lou Q, Hansen BJ, Fedorenko O, Csepe TA, Kalyanasundaram A, Li N, et al. Upregulation of adenosine A1 receptors facilitates sinoatrial node dysfunction in chronic canine heart failure by exacerbating nodal conduction abnormalities revealed by novel dual-sided intramural optical mapping. (2014) Circulation 130:315–24. doi: 10.1161/CIRCULATIONAHA.113.007086
13. Fedorov VV, Glukhov AV, Chang R. Conduction barriers and pathways of the sinoatrial pacemaker complex: their role in normal rhythm and atrial arrhythmias. Am J Physiol Heart Circ Physiol. (2012) 302:H1773–83. doi: 10.1152/ajpheart.00892.2011
14. Glynn P, Onal B, Hund TJ. Cycle length restitution in sinoatrial node cells: a theory for understanding spontaneous action potential dynamics. PloS ONE (2014) 9:e89049. doi: 10.1371/journal.pone.0089049
15. Glynn P, Unudurthi SD, Hund TJ. Mathematical modeling of physiological systems: an essential tool for discovery. Life Sci. (2014) 111:1–5. doi: 10.1016/j.lfs.2014.07.005
16. Wilders R. 25 Years of SA nodal cell modeling. In: Annual International Conference of the IEEE Engineering in Medicine and Biology – Proceedings. Lyon (2007), p. 152–5. doi: 10.1109/IEMBS.2007.4352245
17. Maltsev VA, Yaniv Y, Maltsev AV, Stern MD, Lakatta EG. Modern perspectives on numerical modeling of cardiac pacemaker cell. J Pharmacol Sci. (2014) 125:6–38. doi: 10.1254/jphs.13R04CR
18. Maltsev AV, Maltsev VA, Stern MD. Stabilization of diastolic calcium signal via calcium pump regulation of complex local calcium releases and transient decay in a computational model of cardiac pacemaker cell with individual release channels. PLoS Comput Biol. (2017) 13:e1005675. doi: 10.1371/journal.pcbi.1005675
19. Fabbri A, Fantini M, Wilders R, Severi S. Computational analysis of the human sinus node action potential: model development and effects of mutations. J Physiol. (2017), 595:2365–96. doi: 10.1113/JP273259
20. Michaels DC, Matyas EP, Jalife J. Mechanisms of sinoartrial pacemaker synchronization: a new hypothesis. Circ Res. (1987) 61:704–14. doi: 10.1161/01.RES.61.5.704
21. Greisas A, Zlochiver S. Modulation of cardiac pacemaker inter beat intervals by sinoatrial fibroblasts - a numerical study. Conf. Proc. IEEE Eng. Med. Biol. Soc. (2016) 2016:165–8. doi: 10.1109/EMBC.2016.7590666
22. Kharche SR, Vigmond E, Efimov IR, Dobrzynski H. Computational assessment of the functional role of sinoatrial node exit pathways in the human heart. PloS ONE (2017) 12:e0183727. doi: 10.1371/journal.pone.0183727
23. Onal B, Gratz D, Hund T. LongQt: a cardiac electrophysiology simulation platform. MethodsX (2016) 3:589–99. doi: 10.1016/j.mex.2016.11.002
24. Kurata Y, Hisatome I, Imanishi S, Shibamoto T. Dynamical description of sinoatrial node pacemaking: improved mathematical model for primary pacemaker cell. Am J Physiol Heart Circ Physiol. (2002) 283:H2074–101. doi: 10.1152/ajpheart.00900.2001
26. Sobie EA. parameter sensitivity analysis in electrophysiological models using multivariable regression. Biophys J. (2009) 96:1264–74. doi: 10.1016/j.bpj.2008.10.056
27. Onal B, Gratz D, Hund TJ. Ca2+/calmodulin kinase II-dependent regulation of atrial myocyte late Na+ current, Ca2+ cycling and excitability: a mathematical modeling study. Am J Physiol Heart Circ Physiol. (2017) 313:H1227–39. doi: 10.1152/ajpheart.00185.2017
28. Unudurthi SD, Wu X, Qian L, Amari F, Onal B, Li N, et al. Two-pore K+ channel TREK-1 regulates sinoatrial node membrane excitability. J Am Heart Assoc. (2016) 5:e002865. doi: 10.1161/JAHA.115.002865
29. Sobie EA, Sarkar AX. Regression methods for parameter sensitivity analysis: applications to cardiac arrhythmia mechanisms. 2011 Annual International Conference of the IEEE Engineering in Medicine and Biology Society, IEEE (2011), p. 4657–60. doi: 10.1109/IEMBS.2011.6091153
30. Sarkar AX, Christini DJ, Sobie EA. Exploiting mathematical models to illuminate electrophysiological variability between individuals. J Physiol. (2012), 590:2555–67. doi: 10.1113/jphysiol.2011.223313
31. Boyett MR, Honjo H, Kodama I. The sinoatrial node, a heterogeneous pacemaker structure. Cardiovasc Res. (2000) 47:658–87. doi: 10.1016/S0008-6363(00)00135-8
32. Abramovich-Sivan S, Akselrod S. Phase response curve based model of the SA node: simulation by two-dimensional array of pacemaker cells with randomly distributed cycle lengths. Med Biol Eng Comput. (1999) 37:482–91. doi: 10.1007/BF02513334
33. Michaels DC, Matyas EP, Jalife J. Dynamic interactions and mutual synchronization of sinoatrial node pacemaker cells: a mathematical model. Circ Res. (1986) 58:706–20. doi: 10.1161/01.RES.58.5.706
34. Fedorov VV, Glukhov AV, Chang R, Kostecki G, Aferol H, Hucker WJ, et al. Optical mapping of the isolated coronary-perfused human sinus node. J Am Coll Cardiol. (2010) 56:1386–94. doi: 10.1016/j.jacc.2010.03.098
35. Monfredi O, Dobrzynski H, Mondal T, Boyett MR, Morris GM. The anatomy and physiology of the sinoatrial node-a contemporary review. Pacing Clin Electrophysiol. (2010) 33:1392–406. doi: 10.1111/j.1540-8159.2010.02838.x
37. Archiv P, Joumal E. Membrane currents in the rabbit sinoatrial node cell as studied by the double microelectrode method. Pflfigers Arch. (1976) 364:45–52. doi: 10.1007/BF01062910
38. Glukhov AV, Fedorov VV, Anderson ME, Mohler PJ, Efimov IR. Functional anatomy of the murine sinus node: high-resolution optical mapping of ankyrin-B heterozygous mice. Am J Physiol Heart Circ Physiol. (2010) 299:H482-91. doi: 10.1152/ajpheart.00756.2009
39. Yada H, Murata M, Shimoda K, Yuasa S, Kawaguchi H, Ieda M, et al. Dominant negative suppression of rad leads to QT prolongation and causes ventricular arrhythmias via modulation of L-type Ca2+ channels in the heart. Circ Res. (2007) 101:69–77. doi: 10.1161/CIRCRESAHA.106.146399
40. Zhang H, Sun AY, Kim JJ, Graham V, Finch EA, Nepliouev I, et al. STIM1–Ca 2+ signaling modulates automaticity of the mouse sinoatrial node. Proc Natl Acad Sci USA. (2015) 112:E5618–27. doi: 10.1073/pnas.1503847112
41. Swan H, Viitasalo M, Piippo K, Laitinen P, Kontula K, Toivonen L. Sinus node function and ventricular repolarization during exercise stress test in long QT syndrome patients with KvLQT1 and HERG potassium channel defects. J Am Coll Cardiol. (1999) 34:823–9.
42. Nawathe PA, Kryukova Y, Oren RV, Milanesi R, Clancy CE, Lu JT, et al. An LQTS6 MiRP1 mutation suppresses pacemaker current and is associated with sinus bradycardia. J Cardiovasc Electrophysiol. (2013) 24:1021–7. doi: 10.1111/jce.12163
44. Osipov GV, Kurths J, Zhou C. Synchronization in Oscillatory Networks. Berlin, Heidelberg: Springer Berlin Heidelberg (2007).
45. Berridge MJ, Rapp PE. A comparative survey of the function, mechanism and control of cellular oscillators. J Exp Biol. (1979) 81:217–79.
46. Kawamura Y. Phase synchronization between collective rhythms of fully locked oscillator groups. Sci Rep. (2015) 4:4832. doi: 10.1038/srep04832
47. Zhang H, Holden AV, Boyett MR. Gradient model versus mosaic model of the sinoatrial node. Circulation (2001) 103:584–8. doi: 10.1161/01.CIR.103.4.584
Keywords: sinoatrial node, synchrony, computational modeling, coupling, ion channel
Citation: Gratz D, Onal B, Dalic A and Hund TJ (2018) Synchronization of Pacemaking in the Sinoatrial Node: A Mathematical Modeling Study. Front. Phys. 6:63. doi: 10.3389/fphy.2018.00063
Received: 15 December 2017; Accepted: 04 June 2018;
Published: 22 June 2018.
Edited by:
Flavio H. Fenton, Cornell University, United StatesReviewed by:
Fei Geng, McMaster University, CanadaYanyan Ji, Georgia Institute of Technology, United States
Copyright © 2018 Gratz, Onal, Dalic and Hund. This is an open-access article distributed under the terms of the Creative Commons Attribution License (CC BY). The use, distribution or reproduction in other forums is permitted, provided the original author(s) and the copyright owner are credited and that the original publication in this journal is cited, in accordance with accepted academic practice. No use, distribution or reproduction is permitted which does not comply with these terms.
*Correspondence: Thomas J. Hund, dGhvbWFzLmh1bmRAb3N1bWMuZWR1