 Nayoung Park
 Esmeralda J. Umanzor
 Jacinta C. Conrad
94% of researchers rate our articles as excellent or good
Learn more about the work of our research integrity team to safeguard the quality of each article we publish.
Find out more
ORIGINAL RESEARCH article
Front. Phys., 14 May 2018
Sec. Interdisciplinary Physics
Volume 6 - 2018 | https://doi.org/10.3389/fphy.2018.00042
This article is part of the Research TopicWomen in ScienceView all 9 articles
We developed a model depletion system with colloidal particles that were refractive index- and density-matched to 80 (w/w)% glycerol in water, and characterized the effect of interparticle interactions on the structure and dynamics of non-equilibrium phases. 2,2,2-trifluoroethyl methacrylate-co-tert-butyl methacrylate copolymer particles were synthesized following [1]. Particles were dispersed in glycerol/water solutions to generate colloidal suspensions with good control over electrostatic interactions and a moderately high background viscosity of 55 mPa·s. To probe the effects of charge screening and depletion attractions on the suspension phase behavior, we added NaCl and polyacrylamide (Mw = 186 kDa) at various concentrations to particle suspensions formulated at volume fractions of ϕ = 0.05 and 0.3 and imaged the suspensions using confocal microscopy. The particles were nearly hard spheres at a NaCl concentration of 20 mM, but aggregated when the concentration of NaCl was further increased. Changes in the particle structure and dynamics with increasing concentration of the depletant polyacrylamide followed the trends expected from earlier experiments on depletion-driven gelation. Additionally, we measured the viscosity and corrected first normal stress difference of suspensions formulated at ϕ = 0.4 with and without added polymer. The solvent viscosity was suitable for rheology measurements without the onset of instabilities such as secondary flows or edge fracture. These results validate this system as an alternative to one common model system, suspensions of poly(methyl methacrylate) particles and polystyrene depletants in organic solvents, for investigating phase behavior and flow properties in attractive colloidal suspensions.
Colloidal suspensions are useful model systems in which to explore equilibrium and non-equilibrium phase behavior. Micron-sized colloidal particles can be directly visualized in 2-D with light microscopy and in 3-D with confocal microscopy [2], and tracked over long times [3–5]. Suspensions of particles with nearly hard-sphere interactions exhibit equilibrium fluid and crystal phases, in agreement with the behavior expected for hard spheres, and form a non-equilibrium glass when rapidly concentrated [6]. Microscopic imaging experiments on hard-sphere colloidal suspensions have therefore been used to explore processes involved in transitions to or from crystals [7–12], and to test theoretical predictions for the glass transition [13–18]. Inducing an attraction between particles, for example by adding a non-adsorbing depletant [19], shifts the equilibrium phase boundaries [20]. Depletion interactions can also generate other kinds of non-equilibrium solids such as attractive glasses [21] and colloidal gels [22, 23], whose mechanical properties depend upon the strength and nature of the interparticle attractions. Imaging experiments, in this context, allow the microscopic particle structure to be linked to the macroscopic mechanical properties [24, 25].
While many fundamental studies of colloidal phase behavior are carried out in quiescent conditions, practical and technological applications of colloidal suspensions often involve flow. Microscopy is an essential tool for identifying processes at the particle scale that control the bulk flow properties. Confocal imaging studies, for example, reveal that sheared hard-sphere colloidal crystals may change their local structure [26] or melt entirely [27], with the dynamics of crystallization and melting distinct from those under quiescent conditions [28]. Hard-sphere colloidal glasses in shear flow exhibit strongly localized yielding [29], leading to shear-banding [30, 31], or jamming and self-filtration [32]. Finally, colloidal gels deform non-linearly [33] and yield under shear flow [34, 25]. Single-particle imaging also aids in elucidating the contribution of hydrodynamic forces vs. short-range repulsions [35] and of normal stress differences to particle migration [36] in sheared or flowing hard-sphere colloids. The design of practical suspensions, however, often requires the interactions between particles to be tailored to control microstructure as well as rheological properties [37], such as viscoelasticity or normal stress differences. Connecting the changes in 3-D microstructure to the resulting macroscopic flow properties is thus facilitated by model systems compatible with 3-D confocal imaging and demanding rheological tests.
The most common model system used for 3-D confocal imaging is a suspension of poly(methyl methacrylate) (PMMA) particles [38], sterically stabilized with short poly(12-hydroxystearic acid) (PHSA) polymers, in organic solutions of similar density and index of refraction. Index- and-density-matching solutions used for these PMMA particles include a binary mixture of decahydronaphthalene (decalin) and either bromocyclohexane or bromocycloheptane [13, 22, 39, 40], or a ternary mixture of cis-decalin, tetrahydronaphthalene (tetralin), and carbon tetrachloride [41]. Polystyrene (PS) is soluble in these mixtures and does not adsorb on the PMMA particles [42], leading to adjustable depletion attractions in an index- and density-matching solvent [22]. Many variations of this system have been developed, including crosslinked PMMA particles [43], PS-core/PMMA-shell particles [44], and PMMA stabilized by poly(dimethylsiloxane) [45] or copolymer (diphenyl-dimethyl) siloxanes [46]. Although the PMMA system provides convenient tunability, the particles may become highly charged in the organic solvents used to match their refractive index and density [39]. While certain salts are soluble at low concentrations in the organic solvents and hence in principle could be used to screen repulsions [47], their limited solubility makes it difficult to fully screen the electrostatic charge and thus control the total interparticle interaction. In addition, the low viscosities of most index-matching solvent mixtures (e.g., 2.3 mPa·s at 20 °C for bromocyclohexane/decalin mixtures) make it very challenging to measure shear-stress-sensitive parameters and phenomena, such as normal stress differences and shear thickening, at intermediate particle fractions [48, 46]. An alternative approach is to synthesize particles that can be index-matched in aqueous or polar solvents, in which electrostatic repulsions can be screened by adding salt. Silica particles, for example, [49, 50] can be index-matched in aqueous mixtures of glycerol or dimethyl sulfoxide [51–53], but unfortunately cannot be density matched to avoid gravitational sedimentation. Very recently, Kodger, Guerra, and Sprakel prepared copolymer particles [trifluoroethyl methacrylate-co-tert-butyl methacrylate (TFEMA-co-tBMA)] that could be index- and density-matched in a mixture of polar sulfolane and formamide and imaged with confocal microscopy [1]. These copolymer particles, compatible with polar solvents, represent a promising route toward the development of a tunable aqueous model system for confocal microscopy.
Here, we characterize an aqueous particle system with controlled depletion attractions that is well suited for confocal microscopy and rheological measurements of normal stress differences. Core-shell TFEMA-co-tBMA particles of diameter 1.47 μm (dispersity Ð = 0.06) and fluorescent core diameter 0.95 μm (dispersity Ð = 0.03) were synthesized following the synthetic protocol reported in Kodger et al. [1]. The composition of the particles was selected so that the particles could be refractive index- and density-matched in 80 (w/w)% glycerol in water. We probed the effect of charge screening and depletion attractions on the suspension phase behavior by adding NaCl and polyacrylamide (PAM, Mw = 186 kDa) at various concentrations to particle suspensions (Figure 1). The particles behaved approximately as hard spheres when [NaCl] = 20 mM, but became unstable and aggregated when the concentration of NaCl was further increased. At a fixed salt concentration of 20 mM, changes in the particle structure and dynamics with increasing depletant (PAM) concentration observed at two particle volume fractions (ϕ = 0.05 and 0.3) followed the trends reported in earlier experiments on depletion-driven gelation of nearly hard spheres [22, 23]. To demonstrate the suitability of this system for rheology, we measured the viscosity and first normal stress difference N1 of two suspensions at ϕ = 0.4 with and without added polymer. The moderate solvent viscosity (55 mPa·s at 20 °C) facilitated measurements of N1 and eliminated the onset of instabilities such as secondary flows or edge fracture, and addition of polymer slightly increased N1. This system hence represents an alternative to the common PMMA/PS model system for investigating phase behavior and flow properties in attractive colloidal suspensions.
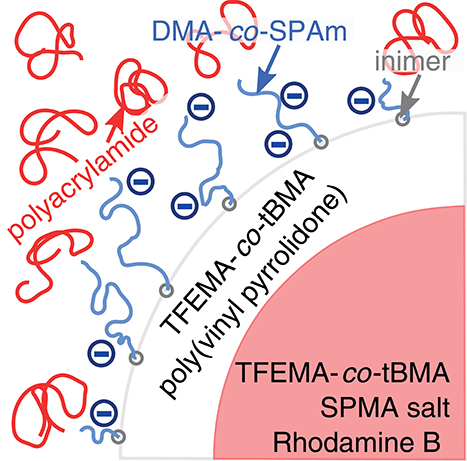
Figure 1. Illustration of the depletion model system. Copolymer core-shell particles were stabilized in aqueous solvents by short charged polymer chains. Addition of polyacrylamide to the solution induced a depletion attraction between the particles. DMA, N,N-dimethylacrylamide; SPAm, 2-acrylamido-2-methyl-1-propanesulfonic acid; inimer, 2-(2-bromoisobutyryloxy) ethyl acrylate; SPMA salt, 3-sulfopropyl methacrylate potassium salt.
To synthesize poly(2,2,2-trifluoroethyl methacrylate-co-tert-butyl methacrylate) core-shell particles, we followed the protocol described in Kodger et al. [1]. Briefly, this protocol included: (1) synthesis of fluorescent particle cores; (2) growth of non-fluorescent shells on the particles; (3) growth of charged stabilizer polymers on the surface. Unless stated otherwise, all chemicals were purchased from Sigma Aldrich.
First, fluorescent, cross-linked core particles were synthesized with a volumetric ratio of 2,2,2-trifluoroethyl methacrylate (TFEMA; Synquest Laboratories) to tert-butyl methacrylate (tBMA) of 45:55, chosen to refractive index- and density-match 80 (w/w)% glycerol in water. Fluorescence was incorporated by co-reacting rhodamine-B-methacrylate, which was synthesized from rhodamine B and glycidyl methacrylate according to Kodger et al. [1]. Ethylene glycol dimethacrylate was co-reacted with the monomers to cross-link the core. The solvents were methanol and water. Volumes and/or masses of each component used in the reaction are summarized in Table 1. An initiator-monomer (inimer), 2-(2-bromoisobutyryloxy) ethyl acrylate, was synthesized according to Kodger et al. [1]. This molecule was incorporated into the core and shell of the particles as a monomer, so that it could be used as an initiator for the growth of charged surface polymers in the last stage of particle synthesis [1, 54]. All components (TFEMA, tBMA, ethylene glycol dimethacrylate, inimer, 2,2′-azobis(2-methylpropionitrile), 3-sulfopropyl methacrylate potassium salt, fluorescent monomer, methanol, and water, Table 1) were loaded into a 500 mL single-neck round-bottom flask and refluxed with a condenser in an 80 °C oil bath for 5 h while stirring with a stir bar. Subsequently, the particles were washed and centrifuged 5 times with a 1:1 by volume mixture of methanol and water and stored as a ϕ = 0.2 suspension in 1:1 methanol:water to be used in the core-shell synthesis.
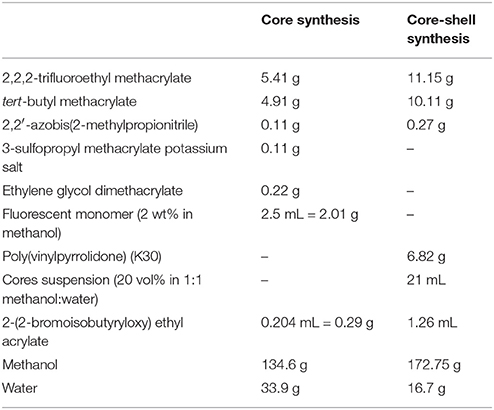
Table 1. Mass/volume of each component added to the synthesis of the core particles and core-shell particles.
Non-fluorescent shells, also with a TFEMA:tBMA ratio of 45:55, were synthesized onto the core particles with a core:monomer ratio of 1:5 by volume. Poly(vinylpyrrolidone) was added as a steric stabilizer in the shell. Table 1 provides the volume and/or mass of each component, all loaded into a 1 L round-bottom flask. The flask was plugged with a rubber septum and nitrogen gas was bubbled through the solution for at least 20 min using two needles. The flask was placed in an oil bath, and the bath temperature was raised to 55°C while nitrogen was bubbled through. The needles were removed after the bath temperature reached 55°C to prevent the rubber septum from popping off due to pressure build up. The flask was held at this temperature for 16 h while the contents were stirred with a stir bar. After the reaction, the particles were washed and centrifuged five times in a 1:1 mixture of methanol and water and stored as a ϕ = 0.25 suspension in the methanol-water mixture.
Finally, controlled-charge co-polymers of 2-acrylamido-2-methyl-1-propanesulfonic acid and dimethylacrylamide were grown on the particle surface using Atom Transfer Radical Polymerization (ATRP) [1, 55]. A 1:1 molar ratio of the two monomers was used to generate a negatively charged particle surface. Volumes and/or masses of each component used in this step of the synthesis are summarized in Table 2. A sacrificial initiator used to control the size of the polymer stabilizers [1, 56, 57], PEGini, was synthesized following Kodger et al. [1]. Copper (I) chloride and small volumes of water and methanol were added to a small flask, while the rest of the components were added to a 500 mL flask. Both flasks were sealed with rubber septa with a cannula connecting them. An inlet needle and outlet needle were placed in the smaller and larger flasks, respectively. Nitrogen gas was bubbled through both flasks for at least 20 min. Then, nitrogen gas was used to push the Cu(I)Cl suspension into the larger flask, after which the needles and cannula were removed. The larger flask was left to react for 6 h while stirring with a stir bar at room temperature. After the reaction, the particles were collected and washed by repeated centrifugation with de-ionized water at least 5 times. Then, enough glycerol was added to the particle pellet to result in ϕ = 0.45 in 60 (w/w)% glycerol in water, assuming that the pellet was at a random-close-packed volume fraction of ϕ = 0.64. This stock was well-dispersed and then centrifuged, after which the supernatant was replaced with enough glycerol to result in ϕ = 0.48 in 80 (w/w)% glycerol in water. The well-dispersed particle stock was centrifuged at 2,000 g for 2–3 min to cream dispersed bubbles, which were carefully scraped off with a clean spatula. The particle stock was then stored at 2–5°C.
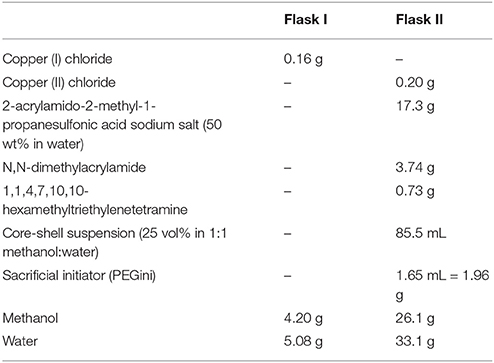
Table 2. Mass/volume of each component added to the synthesis of the charged surface polymers.
The resulting particles were nearly refractive index-matched to 80 (w/w)% glycerol in water, such that suspensions could be imaged at least 65 μm into the sample using a confocal microscope. The particles were density matched to the solvent, such that centrifuging a ϕ≈ 0.05 suspension for 30 min at 5,000 g did not result in any visible changes to the sample.
We measured the zeta potential of the particles using a Nicomp 380 ZLS zeta sizer (Particle Sizing Systems, Port Richey, FL). The particles were diluted in 9.5 mM Tris buffer (pH ≈ 7.5) to ϕ ≈ 0.001.
Stock solutions of solvent, polymer, and salt were mixed with the particle stock suspension to make 0.5 mL of final samples for microscopy of varying concentrations of each component. The solvent was 80 (w/w)% glycerol in deionized water (MilliQ, Millipore). Polyacrylamide (PAM, Polymer Source, Mw = 185.7 kDa, Mw/Mn = 1.40) and sodium chloride (NaCl, Macron Fine Chemicals) were dissolved in the solvent to make stock polymer and salt solutions, respectively. The final concentrations of PAM in the suspensions were calculated in the free volume [20, 58, 59]. The measured overlap concentration of this polymer in 80 (w/w)% glycerol in water with 20 mM NaCl was 9.93 mg mL−1. We targeted PAM concentrations of 1.75, 5, and 12 mg mL−1, which corresponded to normalized concentrations c/c* of approximately 0.2, 0.5, and 1.2. After adding each component to a sample vial, the vial was mixed gently using tumbling and/or rolling mixers. Approximately 100 μL of each sample was sealed in a glass chamber made from coverglass and UV-curable adhesive (Norland Optical). Larger volumes of sample (at least 3 mL) were prepared similarly for rheology. If the mixing procedure entrained bubbles into the sample, the vial was centrifuged at 2,000 g for 2–3 min to cream bubbles for removal.
A VT Eye confocal scanhead (Visitech, Sunderland, U.K.) connected to a Leica DMI 4000 microscope (Leica Microsystems, Buffalo Grove, IL) equipped with a 100X oil-immersion objective (numerical aperture of 1.4) was used to image all samples. For measurements of the 3-D structure, a series of 2-D images was captured at vertical (z) spacings of 0.1 μm per step at heights of 25 μm to 65 μm above the bottom of the sample. At least ten and two such z-stacks were collected for each sample at ϕ = 0.05 and 0.30, respectively. To determine the interaction energy between the particles, 50 z-stacks were collected for two concentrations of NaCl (22 and 51 mM) at ϕ = 0.01 with no added polymer. To calculate the radial distribution function g(r), we used available algorithms in IDL [3] to locate the centers of particles to submicron accuracy.
To measure the dynamics of the particles, 2-D images were collected as a function of time at a single z-plane. At least two sets of images were collected at 1 frame per second and at 5 frames per second for each sample. For ϕ = 0.05 samples without depletant, images were collected at 15 frames per second, except at 0 mM NaCl. One sample, with ϕ = 0.05 and polymer concentration 1.75 mg mL−1, was imaged at 5 and 15 frames per second. We verified that the frame rate did not change the resulting dynamics. To calculate mean-squared displacements, the centers of particles were located and tracked over time using algorithms written in MATLAB [60].
Steady-shear rheology data was collected for two suspensions at ϕ = 0.40 with 20 mM NaCl in 80 (w/w)% glycerol in water, one with no added polymer and one with 4.96 mg mL−1 in the free volume. All rheology measurements were carried out on a DHR-2 hybrid rheometer (TA Instruments, New Castle, DE) equipped with a hard-anodized aluminum 40-mm diameter, 2° cone and matching 40-mm diameter bottom plate. The temperature was maintained at 20 °C via a Peltier temperature controller. After placing the sample on the bottom plate, the cone was lowered slowly at a rate of 5 μm s−1 to the trim gap of 62 μm without exceeding an axial force of FN = 0.5 N [61]. If a drop of the sample was ejected from between the plates during this loading protocol, it was observed that the sample eventually became underloaded during preshear, as indicated by a significantly negative axial force (FN ≤ −0.04 N). Therefore, just enough sample volume was loaded to allow for minimal trimming, if any. Then, the cone was lowered to the truncation gap of 59 μm at a rate of 0.5 μm s−1. We determined, through multiple loadings, that trimming or not trimming the sample did not significantly change the measured rheology beyond sample-to-sample variability. Additionally, if the sample was underloaded, lifting the cone to add more sample volume resulted in erroneous N1 values but did not affect the viscosity.
A consistent preshear protocol was applied to all samples after loading. The shear was increased from 0.5 to 50 s−1 over 30 s, and a constant shear was held at 50 s−1 for 30 s. Then, a weak oscillation (strain amplitude of 0.1% and frequency 1 rad s−1) was applied to the sample for 300 s to monitor the recovery of structure. After the preshear protocol, the axial force was zeroed and the sample was sheared at rates increasing from 0.1 to 800 s−1, with 12 shear rates per decade for the sample without PAM and 6 shear rates per decade for the sample with PAM. At each shear rate up to 100 s−1, the measurement was equilibrated for 30 s and the data were averaged over the next 10 s. Above 100 s−1, the measurement was equilibrated for 5 s and the data were averaged over the next 5 s. The equilibration and averaging times were reduced at high shear rates to avoid significant migration of the particles, which resulted in a transient decrease in the measured viscosity and hysteresis [62, 63]. The shear times were decreased until hysteresis in up and down sweeps in shear rate was effectively eliminated. Hysteresis in N1 was unavoidable for the colloidal gel sample, most likely due to the changing structure of the gel with shear. At least three fresh loadings of the same sample were measured, and the data at each shear rate during the up sweep were averaged.
The raw first normal stress difference data was corrected for the effects of inertia according to Kulicke et al. [64]. It is expected that Newtonian samples, for which N1 = 0, will exhibit negative N1 values at high shear rates due to inertia. Kulicke et al. calculated this inertial N1 to be proportional to the square of the rotational velocity ω and the square of the radius of the cone R via , where ρ is the suspension density. This negative value was subtracted from all measured N1 values, so that the actual N1 was higher than the raw N1 value. Additionally, the N1 at the lowest shear rate measured N1, 0 (0.1 s−1) was subtracted from all inertia-corrected N1 data to correct for baseline values. We confirmed that this inertial correction resulted in a value of N1 = 0 for the Newtonian solvent mixture over this range of shear rates. Measuring the 80 (w/w)% glycerol in water with 20 mM NaCl with 6 shear rates per decade from 1 to 800 s−1 resulted in a corrected N1 ranging from −40 Pa to +5 Pa. Then, ±40 Pa can be considered an estimate of the sensitivity of the measurement, which is larger than the vendor-specified instrument sensitivity of 8 Pa (calculated from the 0.005 N axial force sensitivity).
The zeta potential of the particles, measured in Tris buffer, was −76 ± 2 mV. This zeta potential was close to the value of −66 mV measured for similar synthesis and buffer conditions [1]. We measured the interaction potential for dilute suspensions of TFEMA-co-tBMA particles when the electrostatic interactions were screened. For dilute suspensions, the interaction energy potential u(r) is related to the radial distribution function g(r) via [65, 66]. We first calculated g(r) for a suspension with particle volume fraction ϕ = 0.01 in 80 (w/w)% glycerol in water and a salt concentration of 22 mM NaCl, and then inverted to obtain u(r). For this analysis, 50 independent z-stacks of images, containing particles, were collected as described in section 2.4. The interaction energy, normalized by kT, sharply decreased to near-zero at the average particle diameter and was essentially zero for r > 2a (Figure 2A). Any attractions or repulsions longer-ranged than r/2a = 1 were minimal (< 0.5kT) and thus insignificant. This result indicates that the TFEMA-co-tBMA particles at low volume fractions behaved approximately as hard-spheres in this solvent mixture. A further increase in the salt concentration to 51 mM NaCl, however, generated a slight attraction between the particles with a potential well depth of ≤ 2 kT (Figure 2B).
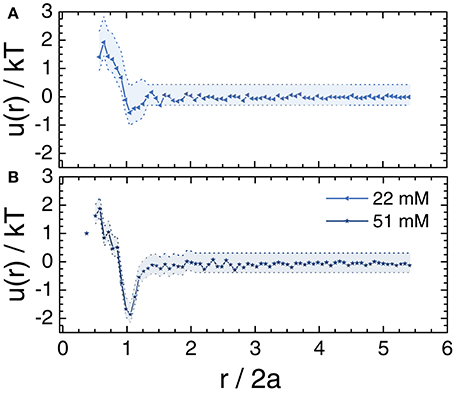
Figure 2. Interaction energy normalized by kT, u(r)/kT, as a function of normalized radial distance r/2a. The u(r) was calculated from the measured radial distribution function at a volume fraction of ϕ≈ 0.01 in 80 (w/w)% glycerol in water with (A) 22 mM and (B) 51 mM NaCl. The shaded areas indicate representative error bars.
Next, we examined the effect of the NaCl concentration on the structure of the particles in suspensions formulated at different volume fractions. For salt concentrations below 21.1 mM, confocal micrographs revealed that the particles in a suspension with ϕ = 0.05 were well-separated (Figure 3), consistent with hard-sphere or repulsive interparticle interactions. When the salt concentration was increased to 34.9 mM, the micrographs revealed the formation of small clusters of particles. Nonetheless, the overall similarity of the micrographs in Figure 3 indicated that most particles in suspensions formulated at ϕ = 0.05 were dispersed such that any cluster formation was localized. The radial distribution function g(r) was consistent with these observations. For salt concentrations of 0 and 21.1 mM, g(r) increased steeply at the particle diameter (i.e., at r/2a = 1), with the slight positive slope of the 0 mM sample indicative of electrostatic repulsion. For salt concentrations of 34.9 and 50.2 mM, g(r) exhibited a modest local maximum at r/2a = 1, indicative of some particle aggregation. The mean-square displacement (MSD) of all samples, however, increased approximately linearly with the lag time τ and collapsed onto the prediction from the Stokes-Einstein diffusivity DSE of the particles in the glycerol/water solvent (Figure 3C). This result suggests that most particles remained dispersed, even at the highest salt concentration.
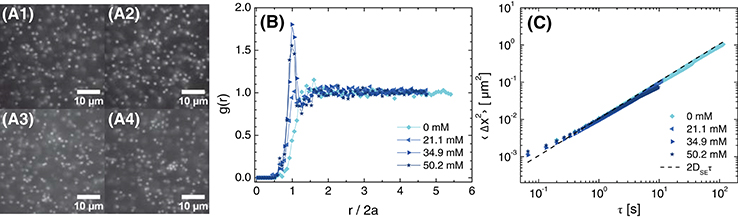
Figure 3. (A) Confocal micrographs at z = 30 μm (brightness/contrast adjusted), (B) radial distribution function as a function of normalized distance from the particle center, and (C) 1-dimensional mean-squared displacement as a function of delay time for ϕ = 0.05 suspensions in 80 (w/w)% glycerol in water with various concentrations of NaCl. The NaCl concentrations are (A1) 0 mM, (A2) 21.1 mM, (A3) 34.9 mM, and (A4) 50.2 mM. The dashed line in (C) is the calculated MSD for Stokes-Einstein diffusion in 80 (w/w)% glycerol in water with 20 mM NaCl.
Upon increasing the particle volume fraction to ϕ = 0.30, particles were sufficiently close to interact. Confocal micrographs revealed dispersed particles at all salt concentrations, suggesting that any change in structure with increasing salt concentration was insignificant (Figure 4A). The radial distribution function for all samples exhibited a local maximum near r/2a≈1, reflecting density correlations that emerged due to the formation of a nearest-neighbor shell (Figure 4B). The position of this maximum shifted slightly to lower separations as the salt concentration was increased from 0 to 50 mM but was always slightly greater than the average particle diameter, indicating that electrostatic repulsions were not fully screened at ϕ = 0.30. The increased particle concentration was expected to affect the particle dynamics. Indeed, the MSD no longer followed the Stokes-Einstein predictions, as particle diffusion was hindered by the presence of other particles (Figure 4C). At a fixed lag time, the MSD decreased as the salt concentration was increased above 20.1 mM. This decrease was slightly larger than expected from the modest increase in solution viscosity with salt concentration, 49.8 mPa·s for 20.0 mM NaCl to 50.9 mPa·s for 50.1 mM NaCl at 24°C. The decrease in MSD was consistent with destabilization of the particles as electrostatic repulsions were screened and was further supported by the pronounced aggregation observed for particles synthesized with lower surface charge, due to their hydrophobicity. We therefore concluded that the particles behaved as nearly-hard-spheres for NaCl concentrations near 20 mM—without any added salt, the electrostatic repulsions were not screened, whereas at high added salt concentrations the particles were not stable.
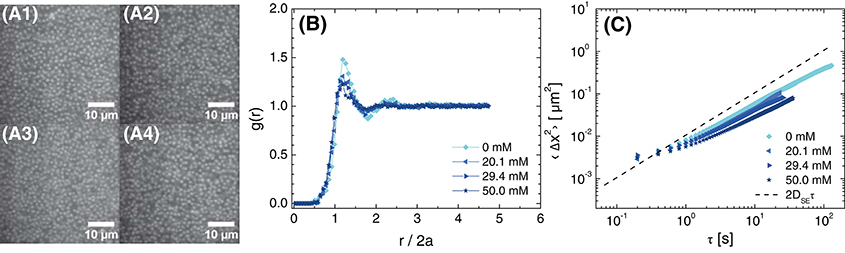
Figure 4. (A) Confocal micrographs at z = 30 μm, (B) radial distribution function as a function of normalized distance from the particle center, and (C) 1-dimensional mean-squared displacement as a function of delay time for ϕ = 0.30 suspensions in 80 (w/w)% glycerol in water and various concentrations of NaCl. The concentrations of NaCl are (A1) 0 mM, (A2) 20.1 mM, (A3) 29.4 mM, and (A4) 50.0 mM. The dashed line in (C) is the MSD calculated for Stokes-Einstein diffusion in 80 (w/w)% glycerol in water with 20 mM NaCl.
We fixed the NaCl concentration at approximately 21 mM, and next examined the effect of adding polyacrylamide (PAM) depletant on the structure and dynamics of suspensions. In the absence of depletant, particles in a suspension formulated at ϕ = 0.05 were well-dispersed. Adding PAM at concentrations of 1.76 mg mL−1 and 4.59 mg mL−1 induced the formation of small, compact clusters of particles (Figure 5A), with the lower concentration of depletant resulting in only localized clusters. Further increasing the polymer concentration to 11.7 mg mL−1 led to a change in the morphology of the clusters from compact to ramified. The radial distribution function confirmed the pronounced changes in particle structure with increasing polymer concentration (Figure 5B): g(r) for polymer concentrations of 1.76 and 4.59 mg mL−1 exhibited a small and very sharp maximum, respectively, at the particle diameter (i.e., at r/2a = 1), consistent with strong nearest-neighbor correlations. The 4.59 mg mL−1 depletant sample also exhibited a second local maximum at r/2a ≲ 2. The height of the first maximum for the 4.59 mg mL−1 sample, ranging from 6 to 10, was much greater than that observed in suspensions formulated at ϕ = 0.05 with varying salt concentration (Figure 3B), further confirming the relatively strong attractions induced by the addition of polymer. The envelope enclosing the maxima in g(r) decayed to 1 for r/2a ≥ 3, consistent with the fractal scaling of the particle density reported for PMMA/PS depletion gels [22]. The g(r) determined for a higher polymer concentration of 11.7 mg mL−1 was similar in shape but the height of the first maximum was lower, consistent with the tenuous clusters (in which particles had fewer nearest neighbors) observed in the confocal micrographs for this sample.
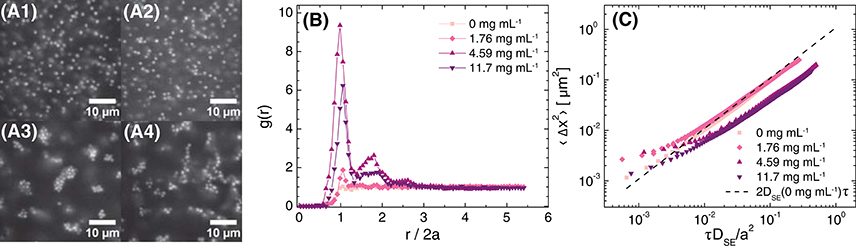
Figure 5. (A) Confocal micrographs at z = 30 μm (brightness/contrast adjusted), (B) radial distribution function as a function of normalized distance from the particle center, and (C) 1-dimensional mean-squared displacement as a function of non-dimensionalized delay time for ϕ = 0.05 suspensions in 80 (w/w)% glycerol in water, 21 ± 2 mM NaCl, and various concentrations of polyacrylamide in the free volume. The polyacrylamide concentrations in the free volume are (A1) 0 mg mL−1, (A2) 1.76 mg mL−1, (A3) 4.59 mg mL−1, and (A4) 11.7 mg mL−1. The dashed line in (C) is the MSD calculated for Stokes-Einstein diffusion in 80 (w/w)% glycerol in water with 20 mM NaCl.
The MSD also exhibited pronounced changes with polymer concentration. In the absence of polymer, the MSD was diffusive and conformed with the Stokes-Einstein prediction for the particles in the glycerol/water solvent (Figure 5C). Upon adding polymer, the MSD approached a plateau on short lag times τ, consistent with particle arrest on those time scales; the plateau height decreased as the polymer concentration was increased, consistent with strong bonds between particles. On longer time scales, the MSD increased approximately linearly as the clusters diffused. The MSDs for the two samples containing polymers at concentrations ≥ 4.59 mg mL−1 collapsed as a function of a normalized time scale , where DSE is the Stokes-Einstein diffusivity for a particle in the background solution calculated using viscosities of 1.75, 5, and 12 mg mL−1 PAM solutions with 20 mM NaCl at 20°C; this normalization corrects for the background viscosity experienced by the particles. The good collapse indicates that the clusters had similar diffusivities on long time scales.
At a higher particle concentration, ϕ = 0.30, adding polymer led to the formation of arrested colloidal gels. Confocal micrographs revealed that the particles formed small mobile clusters at low concentrations of polymer, but aggregated to form space-spanning networks when the polymer concentration was increased to 5.36 mg mL−1 (Figure 6A). Consistent with the structural change observed in the micrographs, the location of the first maximum in g(r) shifted to a slightly lower value of r/2a upon addition of a sufficiently high concentration of polymer; additionally, a second local maximum developed at r/2a≈ 1.8 (Figure 6B). The MSD of the suspension without polymer was lower than that predicted from the Stokes-Einstein diffusivity of the particles in the background solvent and scaled as a power-law with lag time with an exponent slightly lower than 1, indicating that the high particle concentration slightly hindered the diffusive transport of particles (Figure 6C). Upon addition of polymer at concentrations greater than or equal to 5.36 mg mL−1, the particles became dynamically arrested. These measurements confirm that the TFEMA-co-tBMA/PAM depletion system exhibits the dynamic arrest observed for colloidal gels in earlier microscopic studies of PMMA/PS depletion mixtures [23, 40, 67].
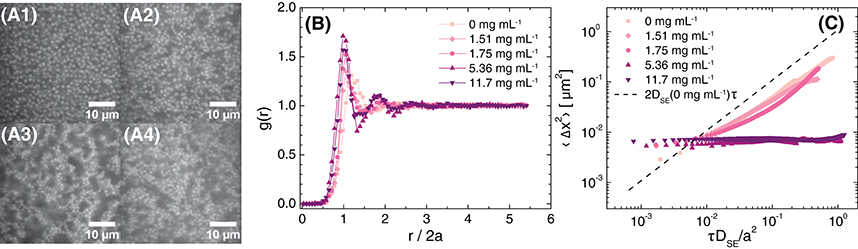
Figure 6. (A) Confocal micrographs at z = 30 μm (brightness/contrast adjusted), (B) radial distribution function as a function of normalized distance from the particle center, and (C) 1-dimensional mean-squared displacement as a function of non-dimensionalized delay time for ϕ≈ 0.30 suspensions in 80 (w/w)% glycerol in water, 20.0 ± 0.6 mM NaCl, and various concentrations of polyacrylamide in the free volume. The polyacrylamide concentrations in the free volume are (A1) 0 mg mL−1, (micrograph not shown) 1.51 mg mL−1, (A2) 1.75 mg mL−1, (A3) 5.36 mg mL−1, and (A4) 11.7 mg mL−1. The dashed line in (C) is the MSD calculated for Stokes-Einstein diffusion in 80 (w/w)% glycerol in water with 20 mM NaCl. The actual volume fraction of the sample with 5.36 mg mL−1 polyacrylamide was ϕ = 0.29.
The microscopic measurements reveal that this system undergoes a transition from a fluid to a gel as the concentration of polymer (and hence the strength of the depletion attractions) is increased, qualitatively consistent with the behavior observed in earlier studies. To confirm that this system is also well suited for measurements of normal stress differences, one challenging rheological test, we formulated two suspensions with a slightly higher particle volume fraction ϕ = 0.40 and NaCl concentration of 20.1 ± 0.1 mM. The sample with ϕ = 0.40 without polymer was a dense colloidal fluid, and the location (r/2a≈ 1.1) and height (g(r)≈ 1.7) of its first local maximum in g(r) were close to those of the slightly less concentrated (ϕ = 0.30) sample shown in Figure 4. The sample with ϕ = 0.40 and PAM concentration of 4.96 mg mL−1 was an arrested colloidal gel.
Using a cone-and-plate geometry, we measured the viscosity and the corrected first normal stress difference N1−N1, 0 as a function of the shear rate for the suspensions at ϕ = 0.40 with and without polymer depletant. In the absence of the PAM polymer, the suspension viscosity ranged from 0.3 and 0.4 Pa·s across a shear rate range of 0.1–800 s−1, decreasing very slightly as the shear rate was increased from 0.1 to 100 s−1 and then increasing slightly as the shear rate was increased from 100 to 800 s−1 (Figure 7A). By comparison, the viscosity of a suspension of PMMA particles at a volume fraction of ϕ = 0.40 in a mixture of bromocycloheptane and decahydronaphthalene (CHB/DHN) without added polymer was 10−2 Pa·s [68]. The first normal stress difference was approximately zero at shear rates of 0.1–10 s−1, and then decreased to −143 ± 9 Pa as the shear rate was further increased, well outside of both the instrument sensitivity (−8 Pa) and the measurement sensitivity (−40 Pa, discussed in section 2.5) (Figure 7B). By contrast, in the less-viscous CHB/DHN solvent used with PMMA nearly-hard-spheres, the normal stresses are not measurably different from zero across the accessible range for similar ϕ [68].
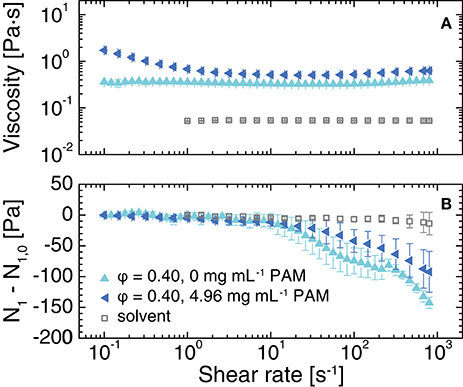
Figure 7. (A) Viscosity and (B) corrected first normal stress difference N1−N1, 0 as a function of shear rate for suspensions with ϕ = 0.40 in 80 (w/w)% glycerol in water, 20.1 ± 0.1 mM NaCl, and the indicated concentration of polymer. The open squares indicate the measured rheological properties of the solvent. Error bars indicate standard deviations over at least 3 measurements.
Upon adding polymer, the viscosity of the suspension became shear-thinning, as previously observed for PMMA/PS depletion gels [69, 70]. The corrected N1 was nearly zero over the same range of shear rates (0.1–10 s−1) as for the suspension with no added polymer, then decreased only to −90 ± 30 Pa as the shear rate was further increased. This result indicates that addition of polymer modifies the development of the first normal stress difference; we will systematically explore this dependence in a future study. These measurements confirm that our aqueous particle/polymer system is well suited for combined confocal and rheological studies aimed at elucidating the microscopic mechanisms driving non-zero normal stress development.
By tuning a newly-developed particle system [1] to be index- and density-matched to glycerol/water mixtures, we developed and characterized a series of aqueous colloid-polymer depletion mixtures. The TFEMA-co-tBMA particles behaved as nearly-hard-spheres at volume fractions of ϕ = 0.05 and 0.3 in solutions of salt (NaCl) concentration of approximately 20 mM. Upon increasing the concentration of a polymer depletant, PAM, the suspensions exhibited the transition from an equilibrium fluid to a non-equilibrium gel. The moderately high background viscosity of the 80 (w/w)% glycerol solution used to index- and density-match the particles provides high shear stresses even at intermediate particle volume fractions, enabling the evolution of normal stress differences to be observed upon addition of polymer. This system enables combined imaging and rheological measurements of normal stress differences, important for understanding phenomena such as rod-climbing, die swell [71], drop formation [72], and particle migration [36] that affect processability of particulate suspensions.
The datasets generated and analyzed for this study can be found in the Open Science Framework (http://osf.io/7etj8).
NP and JC designed the project. NP synthesized the colloids. EU and NP collected and analyzed the microscopy data. NP collected and analyzed the rheology data. NP and JC wrote the first draft of the manuscript. All authors contributed to manuscript revision, read, and approved the submitted version.
This work was supported by the Welch Foundation (E-1869) and the National Science Foundation (CBET-1438204). EU and NP acknowledge the Tier One Scholars program and the Houston Endowment Fund, respectively, for partial support.
The authors declare that the research was conducted in the absence of any commercial or financial relationships that could be construed as a potential conflict of interest.
We thank Rodrigo Guerra and Joris Sprakel for helpful advice on particle synthesis, Megan Robertson for use of the rheometer, and Peter Vekilov for use of the light scattering setup.
1. Kodger TE, Guerra RE, Sprakel J. Precise colloids with tunable interactions for confocal microscopy. Sci Rep. (2015) 5:14635. doi: 10.1038/srep14635
2. Prasad V, Semwogerere D, Weeks ER. Confocal microscopy of colloids. J Phys Condens Matter. (2007) 19:113102. doi: 10.1088/0953-8984/19/11/113102
3. Crocker JC, Grier DG. Methods of digital video microscopy for colloidal studies. J Colloid Interface Sci. (1996) 179:298–310. doi: 10.1006/jcis.1996.0217
4. Parthasarathy R. Rapid, accurate particle tracking by calculation of radial symmetry centers. Nat Methods (2012) 9:724–6. doi: 10.1038/nmeth.2071
5. Bierbaum M, Leahy BD, Alemi AA, Cohen I, Sethna JP. Light microscopy at maximal precision. Phys Rev X (2017) 7:041007. doi: 10.1103/PhysRevX.7.041007
6. Pusey PN, van Megen W. Phase behaviour of concentrated suspensions of nearly hard colloidal spheres. Nature (1986) 320:340–2. doi: 10.1038/320340a0
7. Gasser U, Weeks ER, Schofield A, Pusey PN, Weitz DA. Real-space imaging of nucleation and growth in colloidal crystallization. Science (2001) 292:258–62. doi: 10.1126/science.1058457
8. Savage JR, Blair DW, Levine AJ, Guyer RA, Dinsmore AD. Imaging the sublimation dynamics of colloidal crystallites. Science (2006) 314:795–8. doi: 10.1126/science.1128649
9. Peng Y, Wang Z, Alsayed AM, Yodh AG, Han Y. Melting of colloidal crystal films. Phys Rev Lett. (2010) 104:205703. doi: 10.1103/PhysRevLett.104.205703
10. Skinner TOE, Aarts DGAL, Dullens RPA. Grain-boundary fluctuations in two-dimensional colloidal crystals. Phys Rev Lett. (2010) 105:168301. doi: 10.1103/PhysRevLett.105.168301
11. Nagamanasa KH, Gokhale S, Ganapathy R, Sood AK. Confined glassy dynamics at grain boundaries in colloidal crystals. Proc Natl Acad Sci USA. (2011) 108:11323–6. doi: 10.1073/pnas.1101858108
12. Peng Y, Li W, Wang F, Still T, Yodh AG, Han Y. Diffusive and martensitic nucleation kinetics in solid-solid transitions of colloidal crystals. Nat Commun. (2017) 8:14978. doi: 10.1038/ncomms14978
13. Weeks ER, Crocker JC, Levitt AC, Schofield A, Weitz DA. Three-dimensional direct imaging of structural relaxation near the colloidal glass transition. Science (2000) 287:627–31. doi: 10.1126/science.287.5453.627
14. Conrad JC, Starr FW, Weitz DA. Weak correlations between local density and dynamics near the glass transition. J Phys Chem B (2005) 109:21235–40. doi: 10.1021/jp0514168
15. Royall CP, Williams SR, Ohtsuka T, Tanaka H. Direct observation of a local structural mechanism for dynamic arrest. Nat Mater. (2008) 7:556–61. doi: 10.1038/nmat2219
16. Zhang B, Cheng X. Structures and dynamics of glass-forming colloidal liquids under spherical confinement. Phys Rev Lett. (2016) 116:098302. doi: 10.1103/PhysRevLett.116.098302
17. Pinchaipat R, Campo M, Turci F, Hallett JE, Speck T, Royall CP. Experimental evidence for a structural-dynamical transition in trajectory space. Phys Rev Lett. (2017) 119:028004. doi: 10.1103/PhysRevLett.119.028004
18. Higler R, Krausser J, van der Gucht J, Zaccone A, Sprakel J. Linking slow dynamics and microscopic connectivity in dense suspensions of charged colloids. Soft Matter. (2018) 14:780–8. doi: 10.1039/C7SM01781B
19. Asakura S, Oosawa F. On interaction between two bodies immersed in a solution of macromolecules. J Chem Phys. (1954) 22:1255–6. doi: 10.1063/1.1740347
20. Ilett SM, Orrock A, Poon WCK, Pusey PN. Phase behavior of a model colloid-polymer mixture. Phys Rev E (1995) 51:1344–52. doi: 10.1103/PhysRevE.51.1344
21. Kaufman LJ, Weitz DA. Direct imaging of repulsive and attractive colloidal glasses. J Chem Phys. (2006) 125:074716. doi: 10.1063/1.2227386
22. Dinsmore AD, Weeks ER, Prasad V, Levitt AC, Weitz DA. Three-dimensional confocal microscopy of colloids. Appl Opt. (2001) 40:4152–9. doi: 10.1364/AO.40.004152
23. Dibble CJ, Kogan M, Solomon MJ. Structure and dynamics of colloidal depletion gels: coincidence of transitions and heterogeneity. Phys Rev E (2006) 74:041403. doi: 10.1103/PhysRevE.74.041403
24. Conrad JC, Dhillon PP, Weeks ER, Reichman DR, Weitz DA. Contribution of slow clusters to the bulk elasticity near the colloidal glass transition. Phys Rev Lett. (2006) 97:265701. doi: 10.1103/PhysRevLett.97.265701
25. Hsiao LC, Newman RS, Glotzer SC, Solomon MJ. Role of isostaticity and load-bearing microstructure in the elasticity of yielded colloidal gels. Proc Natl Acad Sci USA. (2012) 109:16029–34. doi: 10.1073/pnas.1206742109
26. Cohen I, Mason TG, Weitz DA. Shear-induced configurations of confined colloidal suspensions. Phys Rev Lett. (2004) 93:046001. doi: 10.1103/PhysRevLett.93.046001
27. Derks D, Wu YL, van Blaaderen A, Imhof A. Dynamics of colloidal crystals in shear flow. Soft Matter (2009) 5:1060–5. doi: 10.1039/b816026k
28. Wu YL, Derks D, van Blaaderen A, Imhof A. Melting and crystallization of colloidal hard-sphere suspensions under shear. Proc Natl Acad Sci USA. (2009) 106:10564–9. doi: 10.1073/pnas.0812519106
29. Schall P, Weitz DA, Spaepen F. Structural rearrangements that govern flow in colloidal glasses. Science (2007) 318:1895–9. doi: 10.1126/science.1149308
30. Besseling R, Isa L, Ballesta P, Petekidis G, Cates ME, Poon WCK. Shear banding and flow-concentration coupling in colloidal glasses. Phys Rev Lett. (2010) 105:268301. doi: 10.1103/PhysRevLett.105.268301
31. Chikkadi V, Miedema DM, Dang MT, Nienhuis B, Schall P. Shear banding of colloidal glasses: observation of a dynamic first-order transition. Phys Rev Lett. (2014) 113:208301. doi: 10.1103/PhysRevLett.113.208301
32. Haw MD. Jamming, two-fluid behavior, and “self-filtration” in concentrated particulate suspensions. Phys Rev Lett. (2004) 92:185506. doi: 10.1103/PhysRevLett.92.185506
33. Rajaram B, Mohraz A. Microstructural response of dilute colloidal gels to nonlinear shear deformation. Soft Matter (2010) 6:2246–59. doi: 10.1039/b926076e
34. Rajaram B, Mohraz A. Dynamics of shear-induced yielding and flow in dilute colloidal gels. Phys Rev E (2011) 84:011405. doi: 10.1103/PhysRevE.84.011405
35. Ramaswamy M, Lin NYC, Leahy BD, Ness C, Fiore AM, Swan JW, et al. How confinement-induced structures alter the contribution of hydrodynamic and short-ranged repulsion forces to the viscosity of colloidal suspensions. Phys Rev X (2017) 7:041005. doi: 10.1103/PhysRevX.7.041005
36. Frank M, Anderson D, Weeks ER, Morris JF. Particle migration in pressure-driven flow of a Brownian suspension. J Fluid Mech. (2003) 493:363–78. doi: 10.1017/S0022112003006001
37. Conrad JC, Ferreira SR, Yoshikawa J, Shepherd RF, Ahn BY, Lewis JA. Designing colloidal suspensions for directed materials assembly. Curr Opin Colloid Interface Sci. (2011) 16:71–9. doi: 10.1016/j.cocis.2010.11.002
38. Antl L, Goodwin JW, Hill RD, Ottewill RH, Owens SM, Papworth S, et al. The preparation of poly(methyl methacrylate) latices in non-aqueous media. Colloid Surf. (1986) 17:67–78. doi: 10.1016/0166-6622(86)80187-1
39. Yethiraj A, van Blaaderen A. A colloidal model system with an interaction tunable from hard sphere to soft and dipolar. Nature (2003) 421:513–7. doi: 10.1038/nature01328
40. Lu PJ, Zaccarelli E, Ciulla F, Schofield AB, Sciortino F, Weitz DA. Gelation of particles with short-range attraction. Nature (2008) 453:499–503. doi: 10.1038/nature06931
41. de Hoog EHA Kegel WK, van Blaaderen A, Lekkerkerker HNW. Direct observation of crystallization and aggregation in a phase-separating colloid-polymer suspension. Phys Rev E (2001) 64:021407. doi: 10.1103/PhysRevE.64.021407
42. Poon WCK, Selfe JS, Robertson MB, Ilett SM, Pirie AD, Pusey PN. An experimental study of a model colloid-polymer mixture. J Phys. (1993) 3:1075–86. doi: 10.1051/jp2:1993184
43. Dullens RPA, Claesson M, Derks D, van Blaaderen A, Kegel WK. Monodisperse core-shell poly(methyl methacrylate) latex colloids. Langmuir (2003) 19:5963–6. doi: 10.1021/la034636q
44. Klein MK, Saenger NR, Schuetter S, Pfleiderer P, Zumbusch A. Shape-tunable core–shell microparticles. Langmuir (2014) 30:12457–64. doi: 10.1021/la500504u
45. Kodger TE, Lu PJ, Wiseman GR, Weitz DA. Stable, fluorescent polymethylmethacrylate particles for the long-term observation of slow colloidal dynamics. Langmuir (2017) 33:6382–9. doi: 10.1021/acs.langmuir.7b00852
46. Kogan M, Dibble CJ, Rogers RE, Solomon MJ. Viscous solvent colloidal system for direct visualization of suspension structure, dynamics and rheology. J Colloid Interface Sci. (2008) 318:252–63. doi: 10.1016/j.jcis.2007.10.064
47. Leunissen ME, Christova CG, Hynninen AP, Royall CP, Campbell AI, Imhof A, et al. Ionic colloidal crystals of oppositely charged particles. Nature (2005) 437:235–40. doi: 10.1038/nature03946
48. Mall-Gleissle SE, Gleissle W, McKinley GH, Buggisch H. The normal stress behaviour of suspensions with viscoelastic matrix fluids. Rheol Acta (2002) 41:61–76. doi: 10.1007/s003970200006
49. van Blaaderen A, Vrij A. Synthesis and characterization of colloidal dispersions of fluorescent, monodisperse silica spheres. Langmuir (1992) 8:2921–31. doi: 10.1021/la00048a013
50. Verhaegh NAM, van Blaaderen A. Dispersions of rhodamine-labeled silica spheres: synthesis, characterization, and fluorescence confocal scanning laser microscopy. Langmuir (1994) 10:1427–38. doi: 10.1021/la00017a019
51. Johnson PM, van Kats CM, van Blaaderen A. Synthesis of colloidal silica dumbbells. Langmuir (2005) 21:11510–7. doi: 10.1021/la0518750
52. Conrad JC, Lewis JA. Structure of colloidal gels during microchannel flow. Langmuir (2008) 24:7628–34. doi: 10.1021/la800919k
53. Lin NYC, Cheng X, Cohen I. Biaxial shear of confined colloidal hard spheres: the structure and rheology of the vorticity-aligned string phase. Soft Matter. (2014) 10:1969–76. doi: 10.1039/c3sm52880d
54. Matyjaszewski K, Gaynor SG, Kulfan A, Podwika M. Preparation of hyperbranched polyacrylates by atom transfer radical polymerization. 1. acrylic AB* monomers in “living” radical polymerizations. Macromolecules (1997) 30:5192–4. doi: 10.1021/ma970359g
55. Perruchot C, Khan MA, Kamitsi A, Armes SP. Synthesis of well-defined, polymer-grafted silica particles by aqueous ATRP. Langmuir (2001) 17:4479–81. doi: 10.1021/la0102758
56. Husseman M, Malmström EE, McNamara M, Mate M, Mecerreyes D, Benoit DG, et al. Controlled synthesis of polymer brushes by “living” free radical polymerization techniques. Macromolecules (1999) 32:1424–31. doi: 10.1021/ma981290v
57. von Werne TA, Germack DS, Hagberg EC, Sheares VV, Hawker CJ, Carter KR. A versatile method for tuning the chemistry and size of nanoscopic features by living free radical polymerization. J Am Chem Soc. (2003) 125:3831–8. doi: 10.1021/ja028866n
58. Lekkerkerker HNW, Poon WCK, Pusey PN, Stroobants A, Warren PB. Phase behaviour of colloid + polymer mixtures. Europhys Lett. (1992) 20:559–64. doi: 10.1209/0295-5075/20/6/015
59. Lekkerkerker HNW, Tuinier R. Colloids and the Depletion Interaction. Dordrecht: Springer (2011).
60. Blair D, Dufresne E. The Matlab Particle Tracking Code Repository (2008). Available online at: http://physics.georgetown.edu/matlab/.
61. Cwalina CD, Wagner NJ. Material properties of the shear-thickened state in concentrated near hard-sphere colloidal dispersions. J Rheol. (2014) 58:949–67. doi: 10.1122/1.4876935
62. Highgate D. Particle migration in cone-plate viscometry of suspensions. Nature (1966) 211:1390–1. doi: 10.1038/2111390b0
63. Highgate DJ, Whorlow RW. Rheological properties of suspensions of spheres in non-Newtonian media. Rheol Acta (1970) 9:569–76. doi: 10.1007/BF01985469
64. Kulicke WM, Kiss G, Porter RS. Inertial normal-force corrections in rotational rheometry. Rheol Acta (1977) 16:568–72. doi: 10.1007/BF01525657
65. Behrens SH, Grier DG. Pair interaction of charged colloidal spheres near a charged wall. Phys Rev E (2001) 64:050401(R). doi: 10.1103/PhysRevE.64.050401
66. Han Y, Grier DG. Confinement-induced colloidal attractions in equilibrium. Phys Rev Lett. (2003) 91:038302. doi: 10.1103/PhysRevLett.91.038302
67. Gao Y, Kilfoil ML. Direct imaging of dynamical heterogeneities near the colloid-gel transition. Phys Rev Lett. (2007) 99:078301. doi: 10.1103/PhysRevLett.99.078301
68. Hsiao LC, Jamali S, Glynos E, Green PF, Larson RG, Solomon MJ. Rheological state diagrams for rough colloids in shear flow. Phys Rev Lett. (2017) 119:158001. doi: 10.1103/PhysRevLett.119.158001
69. Conrad JC, Lewis JA. Structural evolution of colloidal gels during constricted microchannel flow. Langmuir (2010) 26:6102–7. doi: 10.1021/la1000123
70. Ballesta P, Koumakis N, Besseling R, Poon WCK, Petekidis G. Slip of gels in colloid-polymer mixtures under shear. Soft Matter. (2013) 9:3237–45. doi: 10.1039/c3sm27626k
Keywords: colloids, depletion interactions, gelation, non-equilibrium phase transition, rheology, first normal stress difference
Citation: Park N, Umanzor EJ and Conrad JC (2018) Aqueous Colloid + Polymer Depletion System for Confocal Microscopy and Rheology. Front. Phys. 6:42. doi: 10.3389/fphy.2018.00042
Received: 27 February 2018; Accepted: 23 April 2018;
Published: 14 May 2018.
Edited by:
Jennifer Lynn Ross, University of Massachusetts Amherst, United StatesReviewed by:
Rae M. Robertson-Anderson, University of San Diego, United StatesCopyright © 2018 Park, Umanzor and Conrad. This is an open-access article distributed under the terms of the Creative Commons Attribution License (CC BY). The use, distribution or reproduction in other forums is permitted, provided the original author(s) and the copyright owner are credited and that the original publication in this journal is cited, in accordance with accepted academic practice. No use, distribution or reproduction is permitted which does not comply with these terms.
*Correspondence: Jacinta C. Conrad, amNjb25yYWRAdWguZWR1
Disclaimer: All claims expressed in this article are solely those of the authors and do not necessarily represent those of their affiliated organizations, or those of the publisher, the editors and the reviewers. Any product that may be evaluated in this article or claim that may be made by its manufacturer is not guaranteed or endorsed by the publisher.
Research integrity at Frontiers
Learn more about the work of our research integrity team to safeguard the quality of each article we publish.