
94% of researchers rate our articles as excellent or good
Learn more about the work of our research integrity team to safeguard the quality of each article we publish.
Find out more
ORIGINAL RESEARCH article
Front. Phys., 08 September 2015
Sec. Interdisciplinary Physics
Volume 3 - 2015 | https://doi.org/10.3389/fphy.2015.00072
Desert roses are gypsum crystals that consist of intersecting disks. We determine their geometrical structure using computer assisted tomography. By mapping the geometrical structure onto a graph, the topology of the desert rose is analyzed and compared to a model based on diffusion limited aggregation. By comparing the topology, we find that the model gets a number of the features of the real desert rose right, whereas others do not fit so well.
Fracture networks are of great importance in geophysical transport properties. In reservoirs, they provide “highways” for fluid and gas transport. It is therefore surprising to discover that there are no data available on the structure of such networks beyond the most rudimentary.
Hydraulic fracturing, the fracturing of rock—shale—formations due to the injection of fluids at high pressure, is at the heart of a new process to extract petroleum and gas from shales. This process has become so important that it has large impact on the world economy [1, 2]. Fracking, as it is known, is also a highly controversial technique as the shales that are fractured often are close to aquifers. The hydraulic fracturing may as a result of this proximity produce fractures that open up for fluid transport into them. As the chemicals used in the hydraulic fracturing are toxic, this poses a problem together with methane seepage [3, 4].
Surprisingly little is known about the hydraulic fracturing process. As with fracture systems in reservoirs, the geometry and topology of fracture networks that are created is essentially unknown. For example, is it a branched structure where the fractures are like leaves or is it a structure consisting of intersecting fracture planes? One important reason for this lack of knowledge is that no technique exists, acoustic or electromagnetic, that can visualize the fractures in situ.
As fracture networks consist of intersecting fracture sheets, modern graph theory as it has been developed over the last years, [5, 6], is not directly applicable. By transforming the fracture network into an equivalent graph where the fractures are the nodes and their intersections are the links between them as described in Andresen et al. [7] and Hope et al. [8], it is, however, possible to analyze fracture networks within modern graph theory.
Hence, the theoretical tools are in place to analyze fracture networks, but real fracture systems to test these tools on do not exist.
There is a mineral that is formed by a process that has some resemblance to hydraulic fracturing: the desert rose, see Figure 1. Desert roses are formed in wet sand. They are evaporites where the crystal formation has occurred as a result of inflow of water containing dissolved calcium sulfate balanced by an outflow of water due to evaporation [9, 10]. Such minerals are used as indicators of arid climates during the time they were formed.
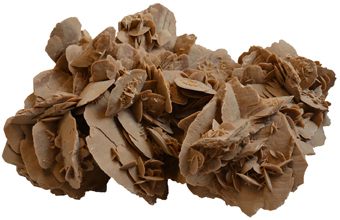
Figure 1. A desert rose is an aggregate of disk shaped gypsum crystals that have grown in water-saturated sand in desert areas. The desert rose in the figure is the one we have analyzed. It measures approximately 76 × 49 × 37 cm.
The gypsum crystals of desert roses contain grains of silica sand [9]. Typically 50–70 % of the weight of a desert rose is gypsum [11]. Analysis reveals a higher concentration of silicon in the core of desert roses, compared to the peripheral parts, suggesting that the disks grow from seeds of silicon [9].
The fact that desert roses are rarely encountered in the holocene deposits [9] indicates a formation time longer than the 10,000 year age of the holocene deposits.
The kinship with hydraulic fracturing comes from the following observations. In hydraulic fracturing the fracture surfaces form equipotential surfaces for the injected fluid pressure. This pressure generates stresses in the rock and as a result, the fractures grow. One may view crystal growth in sand as a fracture process. The sand grains are unconsolidated, but are kept together by capillary forces due to the surrounding fluid [12]. The formation and subsequent growth of a crystal creates surfaces in the sand, and these surfaces are fracture surfaces as they are surfaces created by breaking open contacts between the sand grains. The difference to the hydraulic fracturing process, however, lies in the different boundary conditions at the fracture surfaces; whereas the pressure is given at the fracture surfaces in the hydraulic fracture process, it is the deformation which is given at the fracture surfaces in the desert rose formation process.
The difference in the boundary conditions at the fracture surfaces between the two processes results in the shapes of the fractures being different. However, it is not possible to compare the branching of the fractures in the two processes, i.e., the creation of new fractures different from the old ones. To our knowledge, the details of the branching occurring in hydraulic fracture have not been studied systematically. In computational studies based on a discrete element method [13], branching is caused by local strength variations in the material that is fracturing and proceeds by tip splitting. However, the medium was in this case two-dimensional, and it is not known whether this would be the dominating process in three dimensions. The alternative to tip splitting is that new fractures nucleate on the surface of existing fractures. In the desert rose growth process, nucleation of new crystals on the surface of existing crystals is the dominating mechanism [9].
The geometry and topology of desert roses are interesting in their own right and not only as a proxy for hydraulic fracturing. The complex desert rose shape is not the only way that gypsum crystallizes. Depending on the conditions under which this happens, the kind of crystalline structure which is found will reflect this and, hence, act as an indicator of these conditions at the time the crystals were formed [10]. It is therefore important to understand the precise mechanism that leads to the desert rose shape.
In the present study, we have identified the geometrical structure of a desert rose, see Figure 1, by using medical computer assisted tomographic (CT) scanning. Using the method described in Andresen et al. [7] for two-dimensional fracture networks and in Hope et al. [8] for three-dimensional fracture networks, we have mapped the geometrical structure onto a graph which we then have analyzed using the tools of modern graph (network) theory [5, 6]. We show the graph based on the desert rose of Figure 1 in Figure 2.
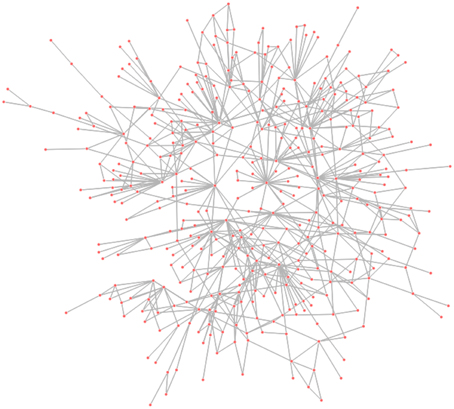
Figure 2. Graph representation of the desert rose in Figure 1.
We have then constructed a stochastic growth model for the evolution of desert roses based on new crystals forming on the existing ones through a nucleation process. By mapping the ensuing computer-generated structure onto the graph as for the scanned desert roses, we are able to compare the model with the real structure quantitatively. We are therefore able to judge how well the model reproduces the real structure.
We note how this program has some similarities with the introduction of fractals in the eighties [14]. This concept made it possible to characterize complex landscapes quantitatively and as a consequence, be able to construct stochastic models that would be of such quality that they could be used by the motion picture industry [15]. We note that whereas the measurement of fractal dimensions requires large structures over many length scales, the measurement of graph properties do not require large structures.
In the next section, we describe our use of a medical CT scanner for recording the structure of the desert rose seen in Figure 1. We then go on to present our stochastic model for the formation and growth of desert roses in Section 3. Section 4 presents the graph theoretical analysis of both the scanned desert rose and of the stochastically generated desert roses from our model and in Section 5 we present the results. We end by presenting our conclusions.
The basis for our analysis is the desert rose from Morocco, shown in Figure 1. It measures approximately 76 × 49 × 37 cm.
Using a medical CT scanner we register cross-sections of the desert rose. For each cross-section the different disks and their connections are identified. By following the different disks through all cross-sections in which they appear, a full mapping of all disks and their connections is obtained. The process of following disks through several cross-sections to determine if they are connected is illustrated in Figure 3.
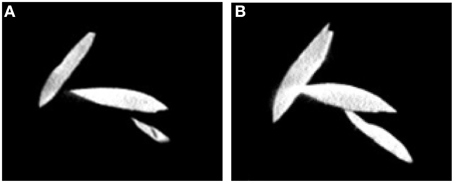
Figure 3. Three distinct disks are shown in (A) while (B) shows how the three disks are found to be connected in a later frame.
The process is done manually and we do not rule out the possibility of errors both in interpreting the images and in the registration process. Especially in the case of the smallest disks which are grouped together on larger disks, as seen on disks in the center of Figure 1, it is likely that not all of these disks have been registered. Larger disks are all registered, but there may be some uncertainties about their connections. This is the case in areas where several disks grow together, which may make it difficult to determine the extent of the different disks.
Once the disks have been identified, the structure is mapped onto a graph [7, 8]. This is done by identifying each disk as a node and placing a link between disks (nodes) that intersect each other. The ensuing nodes-and-links structure is the graph which is analyzed. We identified 402 disks and 679 intersections between different disks, giving rise to the graph shown in Figure 2.
In this section, we describe our model for desert rose growth. From visual inspection of the desert roses, we note that although the disks are compact, the structure as a whole is not and that there is not much variance in the size of the disks it consists of. Roughly, the variance is of the order of a magnitude.
The fact that the disks do not vary much in size wherever they are situated in the structure indicates that the growth of the disks is slow enough so that gradients in the calcium sulfate concentration outside the disks is not important. On the other hand, the number of disks is of the order of a few hundred and they form an open structure. This indicates that disk nucleation is a rare event. One may then think of two possible scenarios: the first scenario would be that the structures on which the disks nucleate are already in place in the sand. The disks would then grow from each nucleus and then merge into the desert rose structure. This scenario does, however, not explain why there is such a great variance in the sizes of the desert roses that are found. The second scenario is that the structures on which the disks nucleate also diffuse, but with a very low concentration. The nucleation of new disks would then be a diffusion-limited aggregation process (DLA) which creates open (even fractal) structures. Hence, we base our model on the DLA model of Witten and Sanders [16].
Particles on which the disks will eventually nucleate execute diffusive motion, i.e., perform random walks, starting from far enough distances from the growing aggregate. Once a particle is within the close proximity of the desert rose, it lands on the growing structure in the form of a two-dimensional circular disk of variable radius R. Each disk is placed such that its center lies on a previously placed disk and its orientation is selected randomly with uniform probability.
In order to model the disks having some variation on their radii, they are drawn from a power law probability distribution p(R) ~ R−1. To implement this procedure, uniformly distributed random numbers xi within −1 < xi < 1 are generated and the radii are assigned. Consequently, the distribution of radii assumes p(R) ~ R−1 form within the range 10−β to 10β.
When β = 0, all radii are equal. With β = 0.8, the ratio between the largest and the smallest disk will be of the order of 40 and with β = 1.2, the ratio is around 250. Hence, we will be able to investigate the influence of the disk size distribution on the ensuing disk structure.
The first disk with radius R1 is placed on the xy-plane with center at the origin. At an arbitrary stage, let there be n disks in the cluster. To add the next (n + 1)th disk, a random walker is released on the surface of an imaginary sphere with its center at the origin, whose radius is sufficiently large to encompass the entire desert rose. It is then allowed to perform a random walk in three-dimensional space. A “sphere of influence” of radius R is imagined to be associated with every disk in the desert rose. When the incoming diffusive particle penetrates such a sphere, it is stopped instantly, and this particular disk is selected. The center of the (n + 1)th disk with radius Rn + 1 is then placed at a randomly selected point on the surface of this disk and is assigned a random orientation in space. The precise value of Rn + 1 is drawn from the probability distribution p(R). Occasionally, it may happen that the random walker enters within the common space of intersection of more than one sphere; in that case we select a disk randomly among them and place the new disk on its surface.
Crystal “growth” is executed in the following way: Once a disk in the growing desert rose is chosen, a random point is selected on that disk with coordinates [] and the center of the (n + 1)th disk is placed at this point. Next, the new disk is given a random orientation by choosing three Euler angles (ϕ, θ, ψ) randomly. The sequence of rotations is the following:
(i) The first rotation is by an angle ϕ in the range [0, 2π] about the z−axis,
(ii) the second rotation is by an angle θ in the range [0, π] about the new x− axis, and
(iii) the third rotation is by an angle ψ in the range [0, 2π] about the new z−axis.
If the three rotation matrices corresponding to the three Euler angles be denoted by D, C, and B, respectively, then the general rotation is given by A = BCD. Therefore, each disk is characterized by its center coordinates (xc, yc, zc), three Euler angles (ϕ, θ, ψ), and the radius (R). We note that the direction cosines (a, b, c) of the normal to the plane of the disk are obtained by the elements of the third column of the rotation matrix A.
From the network a graph is constructed by representing disks as nodes and linking nodes representing connected disks.
There exists a connection between any two disks if they intersect each other. Whether two disks i and j have an intersection or not can be detected by checking the following two conditions:
1. |i − j| ≤ (Ri + Rj), where i and j are the centers of the disk i and j, respectively. This means that the distance between the center of the two disks must be less than or equal to the sum of their individual radii.
2. i ≤ Ri and j ≤ Rj, where i is the perpendicular distance from the line of intersection of the two planes containing the disks to the center of disk i and j is that of disk j.
If both conditions are satisfied simultaneously then there is an intersection between the two disks. If one or both conditions are not met, there is no intersection between the two disks.
The following gives a brief presentation of how the networks are analyzed, based on Hope et al. [8].
By transforming the desert rose structure into a graph representation, they can be analyzed using methods from modern network science. The transform used, was introduced for fracture networks by Andresen et al. [7], and applied to three-dimensional fracture networks by Hope et al. [8]. As shown in Figure 4, each disk is defined as a node and nodes are linked if they represent intersecting disks.
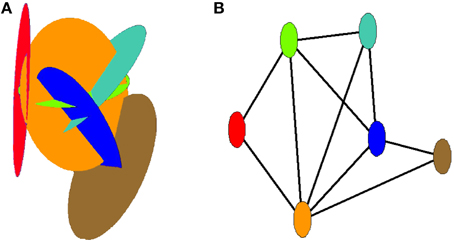
Figure 4. Illustration of how the structure of the desert rose is transformed into a graph by defining each disk as a node and linking nodes which represent intersecting disks. (A) Representation of a small desert rose made up by six disks. (B) Equivalent graph representation where the color of the nodes correspond to the color of the disks they represent.
The properties of a given network are useful to compare against a random version of the same network [6]. For such a comparison, a fully random model [17] with the same number of nodes and links is used.
A measure of the local connectivity of a network is the clustering coefficient. The coefficient Ci gives the ratio between the number of connections between the ki neighbors of node i and the ki(ki − 1)/2 possible ways they could be connected [5, 18]. In the case where ki < 2, Ci = 0 [19].
A global network coefficient, C, is defined as the average of all local clustering coefficients, giving
where N is the number of nodes in the network and Ki is the number of connections between node i's neighbors [5].
A measure of the long range connectivity of the network is the characteristic path length, L. Based on the shortest path, dij, between nodes i and j, i.e., the path with the fewest links traversed, the characteristic path length can be defined as [18, 20]
A measure of the degree mixing is the assortativity coefficient r [21]. The coefficient can be expressed as follows
where k1i and k2i are the degrees of the nodes linked by the ith link and M is the number of links [21]. Assortative mixing is indicated by r > 0, while r < 0 indicate dissasortative mixing.
The variance of the assortative coefficient for a single sample can be found by the jackknife estimate
where ri is the assortative coefficient calculated while excluding the ith link [19, 22].
The graph properties of the desert rose are shown in Table 1. The clustering coefficient is an order of magnitude larger for the desert rose than for the random graph, while the characteristic path length is similar to that of the random graph, indicating a small-world network [18].

Table 1. Average values of the number of nodes, links, maximum degree kmax, average degree 〈k〉, clustering coefficient C, clustering coefficient for random networks CRA, characteristic path length L, characteristic path length for random networks LRA, assortativity coefficient r with its standard deviation σr for the desert rose and the desert rose model with four values of the parameter β.
The desert rose has an assortativity coefficient of −0.29. As such the graph shows dissasortative degree mixing, which is typical of both technological and biological networks [19].
In the case of desert rose model, the assortativity coefficient is positive when all the disks have unit radii. This is in contrast to the network behavior of the real desert rose. When the width of the distribution of radii p(R) is increased, a change is observed in the degree mixing. For β = 0.8, 1.0, and 1.2 the assortativity coefficient is found to be negative as shown in Table 1.
Previous studies of two-dimensional fracture networks have shown a strong connection between fracture size and the degree of the corresponding node [8, 23]. This follows from the chance of connecting with other fractures increases with the size of the fractures. We see the same effect here in Figure 5. Here we plot the average degree 〈k〉 as a function of disk radius, R. Asymptotically, the data are consistent with 〈k〉 ~ exp(0.2R) for β = 1.0. The reason for this behavior is the following: our model is based on the DLA process and it is assumed that each disk in the cluster has a “sphere of influence” of the same radius as the disk itself. When the incoming diffusive particle penetrates such a sphere, it selects that disk as nucleation site. This creates a new node in the graph with a link to the disk that was chosen as a nucleation site. As the probability of a particle to enter the “sphere of influence” of a given disk increases with the radius of the disk, so does the probability that a link is formed to the node that represents that particular disk in the graph. We observe visually that the same holds true for the disks in the desert rose model—the larger they are, the more likely they are to connect with other disks. Using a single size for all disks is likely to result in many disks connecting to the same number of other disks. For such a network, it is not surprising that nodes tend to link to other nodes with similar degree.
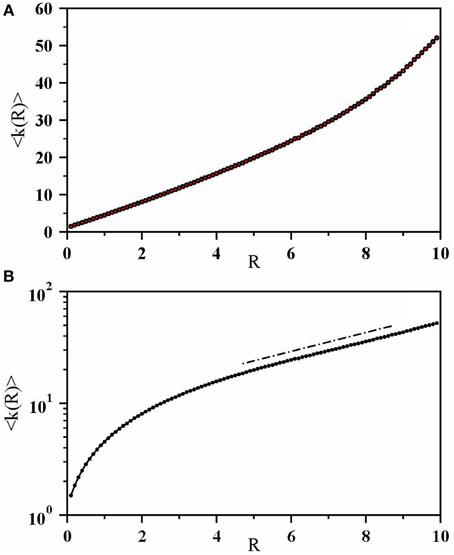
Figure 5. (A) Average degree 〈k〉 as a function of disk radius, R for β = 1.0. (B) The same plot in log-linear scale. The straight line is exp(0.2R).
The assortativity coefficient of the model changes sign from positive to negative for β as β is increased. We show this in Figure 6. The data points follow closely the fit r(β) = 0.305 − 0.537β leading to r(β) = 0 for β = 0.57. We expect the assortativity coefficient to decrease with increasing β for the following reason. With increasing β, the largest disks become even larger. At the same time, the number of small disks is much larger than the number of large disks due to the character of the radius distribution that we use. We have just argued that the larger the disk, the higher the coordination mumber is for its equivalent node in the graph. This means that these disks must connect to disks of smaller radius and hence smaller coordination number. This drives the assortativity coefficient down.
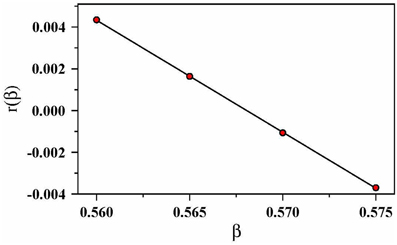
Figure 6. Assortativity coefficient as function of β. The straight line is 0.305 − 0.537β, leading to r(β) = 0 for β = 0.57.
A noteworthy simplification in the desert rose model is that the disks are free to grow through other disks. Studies of models generating two-dimensional fracture network models have shown that whether or not fractures act as barriers for other fractures play an important part in whether the resulting graphs show assortative or disassortative degree mixing [8, 23]. Similarly for models generating three-dimensional fracture networks, the ability of fractures to limit the growth of other fractures has been found to have an impact on the degree mixing. However, in this case the models are found to be disassortative, but the strength of the disassortative mixing is weaker if the fractures are free to cross each other [8]. In the case of the desert rose model, the degree mixing is controlled by the range of the size distribution, and for a sufficient range the model results in disassortative mixing with strength similar to that of the real sample.
The desert rose networks reconstructed from the CT scans also exhibit a broad degree distribution as shown in Figure 7. Whether it follows a power law or not cannot, however, be concluded from the data. We studied it for different values of β from 0 to 1.2 by increments of 0.1 in our model. The degree distribution is observed to be broad for β = 0.8 and larger. In Figure 8 the degree distribution is shown in log–log scale for four different sizes with β = 1.0. Since the growth model is based on the DLA process, the disks experience a screening effect and thus the disks deep interior to the desert rose are not selected any more as the nucleation site. This results in their degree to remain constant after placing certain number of disks in the system and therefore data collapse is not observed.
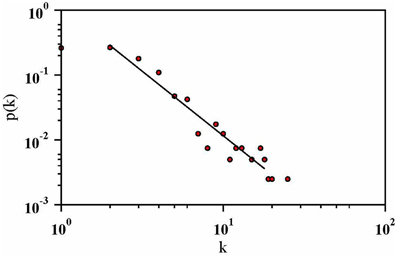
Figure 7. Log–log plot of the degree distribution for the real desert rose sample. A power law p(k) ~ k−α with α = 2.0 has been added as a guide to the eye.
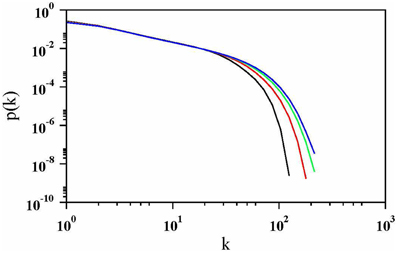
Figure 8. Log–log plot of degree distribution when the radii of the disks are power law distributed with β = 1.0 for four values of number of disks N = 128, 256, 512, and 1024 with N increasing from left to right. The initial slope, in all four cases, is compatible with a power law, p(k) ~ k−α, where α ≃ 1.22.
With respect to the relationship between characteristic path length and system size, Figure 9 shows how L scales linearly when plotted against the ratio ln(N)/ln(〈k〉(N)). This is characteristic of the small-world effect [6].
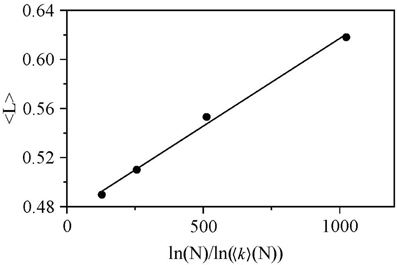
Figure 9. Average path length plotted against ln(N)/ln(〈k〉(N)) with best linear fit illustrated for β = 1.0. This indicates the presence of the small-world effect.
The nature of the graph from the model is in correspondence with the real desert rose graph in terms of the degree distribution and degree mixing within a particular range of β. The value of the clustering coefficient is much higher and characteristic path length obtained from the model is lower than that of real desert rose indicating a much denser and highly connected graph. This is probably because the disks are allowed to penetrate through other disks, which is not seen in case of the real desert rose.
The topology of the desert rose is studied by first scanning it using a CT scanner. By representing the disks as nodes and their intersections as links, we have constructed a graph representation of the crystal.
Based on what is known about the geological processes that lead to the formation of desert roses, we have constructed a DLA-type model where new disks are grown from nucleation sites on existing disks when reached by a random walker.
By comparing the topology, we find that the model gets some features of the real desert rose right, whereas others do not fit so well. In particular, it is found that when all disks are of the same size, the model shows assortative degree mixing whereas the desert rose shows disassortative degree mixing. When the variation of the disk radii is increased, the graphs from the model change character and shows dissasortative degree mixing, as in the real system. The degree distribution shows a broad distribution in the desert rose, whereas it is only broad for wider distributions of disk radii. The desert rose shows a rather narrow distribution of disk sizes; typically over an order or magnitude or so. Both the real system and the model show a small-world structure.
We alluded in the introduction to using the desert rose system as a proxy for fracture networks produced through hydraulic fracturing. Hydraulic fracturing is of increasing importance, and it is becoming urgent that the resulting fracture networks are fully understood. This paper shows that relatively small systems yield precise topological information making it possible to judge quantitatively the quality of different models.
SH analyzed the real desert rose. SK and CR implemented the desert rose model. SH, SK, and CR preformed the network analysis. All authors took part in developing the desert rose model, discussing the results and writing the paper.
The authors declare that the research was conducted in the absence of any commercial or financial relationships that could be construed as a potential conflict of interest.
L. I. Nesje at St. Olavs Hospital in Trondheim, Norway is gratefully acknowledged for CT scan of the desert rose. The authors thank M. B. E. Mørk for valuable discussions. We thank Norges Forskningsråd for funding through the RENERGI program (grant no. 217413/E20). SH and AH thank Norges Forskningsråd for funding through the CLIMIT program (grant no. 199970).
1. Conti JJ. et al. Annual Energy Outlook 2013 - With Projections to 2040. Washington, DC: U.S. Energy Information Administration (2013).
3. Mooney C. The truth about fracking. Sci Am. (2011). 305:80–5. doi: 10.1038/scientificamerican1111-80
4. Rahm D. Regulating hydraulic fracturing in shale gas plays: the case of Texas. Energy Policy. (2011) 39:2974–81. doi: 10.1016/j.enpol.2011.03.009
5. Albert R, Barabási AL. Statistical mechanics of complex networks. Rev Modern Phys. (2002) 74:47–97. doi: 10.1103/RevModPhys.74.47
6. Newman MEJ. Networks: An Introduction. Oxford: Oxford University Press (2010). doi: 10.1093/acprof:oso/9780199206650.001.0001
7. Andresen CA, Le Goc R, Davy P, Hansen A, Hope SM. Topology of fracture networks. Front Phys. (2013) 1:7. doi: 10.3389/fphy.2013.00007
8. Hope SM, Davy P, Maillot J, Le Goc R, Hansen A. Topological impact of constrained fracture growth. Front Phys. (2015). 3:75. doi: 10.3389/fphy.2015.00075
9. Al-Kofahi MM, Hallak AB, Al-Juwair HA, Saafin AK. Analysis of desert rose using PIXE and RBS techniques. X-Ray Spectrom. (1993) 22:23–27. doi: 10.1002/xrs.1300220107
10. Samy Y, Metwally HI. Gypsum crystal habitats as evidence for aridity and stagnation, Northeast of the Nile river delta, Egypt. Aust J Basic Appl Sci. (2012) 6:442–50.
11. Watson A. Structure, chemistry and origins of gypsum crusts in southern Tunisia and the central Namib Desert. Sedimentology (1985) 32:855–75. doi: 10.1111/j.1365-3091.1985.tb00737.x
12. Hornbaker DJ, Albert I, Barabási AL, Schiffer P. Why sandcastles stand: an experimental study of wet granular media. Nature (1997) 387:765. doi: 10.1038/42831
13. Skjetne B, Hansen A. Stochastic modeling of crack avalanches in hydraulic fracture. South African Inst Mining Metallur Symp Ser. (2012) S71:81.
15. Briggs J. Fractals: The Patterns of Chaos: A New Aesthetic of Art, Science and Nature. New York, NY: Touchstone (1992).
16. Witten TA Jr, Sander LM. Diffusion-limited aggregation, a kinetic critical phenomenon. Phys Rev Lett. (1981). 47:1400–03. doi: 10.1103/PhysRevLett.47.1400
18. Watts DJ, Strogatz SH. Collective dynamics of 'small-world' networks. Nature (1998) 393:440–2. doi: 10.1038/30918
19. Newman MEJ. Mixing patterns in networks. Phys Rev E (2003) 67:026126. doi: 10.1103/PhysRevE.67.026126
20. Boccaletti S, Latora V, Moreno Y, Chavez M, Hwang DU. Complex networks: structure and dynamics. Phys Rep. (2006) 424:175–308. doi: 10.1016/j.physrep.2005.10.009
21. Newman MEJ. Assortative mixing in networks. Phys Rev Lett. (2002) 89:208701. doi: 10.1103/PhysRevLett.89.208701
22. Efron B. The Jackknife, the Bootstrap and Other Resampling Plans. Philadelphia, PA: Society for Industrial and Applied Mathematics (1982).
Keywords: desert rose, crystal growth, diffusion limited aggregation, diffusion processes, network analysis, topology
Citation: Hope SM, Kundu S, Roy C, Manna SS and Hansen A (2015) Network topology of the desert rose. Front. Phys. 3:72. doi: 10.3389/fphy.2015.00072
Received: 04 March 2015; Accepted: 21 August 2015;
Published: 08 September 2015.
Edited by:
Ferenc Kun, University of Debrecen, HungaryReviewed by:
Nuno A. M. Araújo, Universidade de Lisboa, PortugalCopyright © 2015 Hope, Kundu, Roy, Manna and Hansen. This is an open-access article distributed under the terms of the Creative Commons Attribution License (CC BY). The use, distribution or reproduction in other forums is permitted, provided the original author(s) or licensor are credited and that the original publication in this journal is cited, in accordance with accepted academic practice. No use, distribution or reproduction is permitted which does not comply with these terms.
*Correspondence: Alex Hansen, Department of Physics, Norwegian University of Science and Technology, N–7491 Trondheim, Norway,YWxleC5oYW5zZW5AbnRudS5ubw==
Disclaimer: All claims expressed in this article are solely those of the authors and do not necessarily represent those of their affiliated organizations, or those of the publisher, the editors and the reviewers. Any product that may be evaluated in this article or claim that may be made by its manufacturer is not guaranteed or endorsed by the publisher.
Research integrity at Frontiers

Learn more about the work of our research integrity team to safeguard the quality of each article we publish.