
94% of researchers rate our articles as excellent or good
Learn more about the work of our research integrity team to safeguard the quality of each article we publish.
Find out more
ORIGINAL RESEARCH article
Front. Phys., 17 March 2015
Sec. Medical Physics and Imaging
Volume 3 - 2015 | https://doi.org/10.3389/fphy.2015.00013
This article is part of the Research TopicImaging and Spectroscopy to Guide Photodynamic Therapy OptimizationView all 7 articles
We have applied continuous blood flow dynamics, quantified with diffuse correlation spectroscopy (DCS), in investigating photodynamic therapy (PDT) induced local photoreaction in a head and neck tumor model. Photoclor (0.47 μmol/kg) was intravenously administered 24 h before PDT. Two types of fluence rates were implemented: Low fluence rate (14 mW/cm2) and high fluence rate (75 mW/cm2). The total delivered fluence was 100 J/cm2 for both types. We observed that PDT induced substantial vascular shut down in both types. While the shutdown was persistent in tumors exposed to low fluence rate PDT, the shutdown was transient in tumors exposed to high fluence PDT. Loss of microvascular structures was confirmed by the microscopic analyses of tumor section following immunostaining for CD31. Blood flow dynamics related metrics were also strongly correlated with crosslinking of STAT3, a molecular marker of photoreaction. STAT3 analysis indicated that low fluence rate yields a substantially higher photoreaction, and thus, a more effective PDT. Our results indicate that non-invasive blood flow measurements can monitor the efficacy of PDT in real-time and potentially provide a feedback for its optimization.
Head and neck tumors in the oral cavity are the sixth most common cancer in the world [1]. With its increasing rate of incidence, a significant number of patients are diagnosed with already well-defined tumors that require effective treatments. Conventional treatment options are surgery, chemo, and/or radiation therapies. Surgery can result in functional losses of speech and swallowing. Moreover, relapse following surgery has been reported as high as ~30% [2]. Similarly, chemotherapy showed high relapse rates and toxicities. Radiation therapy has improved success rates, but the risk of acute and long-term injury to normal tissue (e.g., fibrotic complications) can severely decrease quality of life. Any alternative therapy must balance therapeutic effectiveness with treatment toxicity. Such an alternative is provided by photodynamic therapy (PDT), which relies on the optimal application of a tumor-localized photosensitizing drug, oxygen, and light. PDT is a local therapy with superior healing without cumulative side effects, and can be repeated several times [3]. It is particularly well suited for treatment of head and neck cancers with multiple tumor foci or widespread diseases (e.g., leukoplakia or invasive carcinoma in the oral cavity) [4]. However, PDT responses can vary from ~90 to ~45% depending on site, tumor stage and treatment protocols, which has hampered wider clinical use [5–8].
For effective PDT, an optimal amount of photosensitizer (PS), oxygen and light are required. The wavelength of treatment light is chosen based on the absorption spectrum of the PS as well as the necessary penetration depth of the light. The destruction of cancer tissue by PDT can be due to direct killing of tumor cells through generation of reactive oxygen species (ROS) [9], or indirectly by reducing the blood supply through vascular damage [10] or post-PDT activation of an antitumor immune response [11]. The anti-vascular effects of PDT are particularly important in determining the progression of the photoreaction and treatment outcome. Areas with poor vasculature and low blood flow are prone to have low uptake of intravenously administered photosensitizers and low oxygenation than regions with higher blood flow [12]. This can affect PDT response significantly: hypoxic regions have less oxygen available for photoreaction, leading to poor PDT response [13], and high blood volume in some regions can lead to significant attenuation of treatment light, limiting the penetration depth and decreasing the zone of necrosis [14–16], which ultimately can lead to sub-optimal treatment. In addition, during the dynamic process of PDT, oxygen is consumed and, depending on the choice of photosensitizer and light delivery, blood vessels may be destroyed [17, 18]. This prevents supply of nutrients and oxygen to the tumor after treatment, and leads to effective destruction of the tumor [19, 20]. However, if the oxygen supply to the treatment site is impaired too early, the treatment-dependent hypoxia/ischemia will limit the photoreaction, ROS production and cell killing [21]. Thus, premature destruction of blood vessels is counterproductive for optimal photoreaction and PDT response.
A metric for the cumulative photoreaction delivered at the treatment site is the oxidative covalent crosslinking of the latent transcription factor, Signal Transducer and Activator of Transcription 3 (STAT3). The crosslinking of STAT3 is strictly proportional to the delivered light dose and PS dose and thus can be used as a molecular marker for the cumulative photoreaction [22]. Quantification of vascular parameters before and during PDT is desired for monitoring and optimizing the PDT response that is manifested by the level of STAT3 crosslinking at the end of light treatment.
There are several well-established techniques available for quantification of blood flow such as dynamic-enhanced magnetic resonance imaging (DCE-MRI) [23, 24] computed tomography (CT) [25, 26] and positron emission tomography (PET) [27]. However, optical techniques are advantageous in that they allow real-time monitoring without any contrast agent administration. Among them, laser Doppler [10, 28–32] and optical coherence tomography [33] have shown to be useful approaches with some limitations for deep tissue applications. Recent work utilizing diffuse correlation spectroscopy (DCS), which is an extension of the dynamic light scattering technique for diffuse media, has proven that DCS allows deeper penetration depth making it an attractive tool for monitoring PDT at preclinical and clinical settings [17, 34–37].
In this study, we quantified blood flow dynamics with continuous measurements in a head and neck tumor model using DCS. We investigated the relationship of blood flow dynamics as a function of fluence rate and compared several empirical metrics derived from the blood flow dynamics with the crosslinking of STAT3. We also investigated the status of endothelial cells with CD31 staining after PDT. We show that blood flow dynamics assessed by continuous DCS measurements can inform about PDT-induced changes non-invasively, suggesting real-time blood flow monitoring would allow for PDT optimization in clinical settings.
Blood flow was quantified by using previously described and validated DCS technique [38, 39]. DCS measures rapid temporal fluctuations of transmitted light through tissues and then uses the autocorrelation functions associated with these fluctuations to extract information about the motion of tissue scatterers, in our case of red blood cells. Briefly, when photons scatter from moving blood cells, they undergo phase shifts that make the intensity of collected diffuse light fluctuate with time. The normalized electric field, E (r, t), is extracted from the autocorrelation function, g1 (r, τ) = G1 (r, τ)/<I>, where G1 (r, τ) = < E (r, t) E (r, t + τ) > is the electric field autocorrelation function, < I > is the time-averaged diffuse light intensity, r is the source-detector separation and τ is the time delay. The information about the motions in deep tissue can be extracted since the electric field autocorrelation function satisfies a diffusion equation [38, 39]. The analytical solution of this diffusion equation is available for the assumed nature of the particle motions of random and Brownian diffusion model in reflectance measurements. The mean-square displacement (< △r2 (τ) >) of the red-blood cells can be modeled as < △ r2 (τ) > = v2 τ2, for the random ballistic flow, and as < △ r2 (τ) >= 6DBτ, for the case of diffusive motion; where v2 is the second moment of the cell velocity distribution and DB is the effective diffusion coefficient of the tissue scatterers.
Empirically it has been observed in a broad range of studies at preclinical and clinical settings that diffusion model fits the autocorrelation curves better than random flow model and αDB characterizes the blood flow in deep tissue [40–47]. Here α is a factor representing the probability that a scattering event in tissue is from a moving scatterer (α is generally proportional to tissue blood volume fraction). We generally report relative blood flow, rBF, to describe blood flow changes during PDT: rBF is a blood flow parameter measured relative to its pre-treatment value, i.e., rBF = αDB(t)/αDB(baseline).
The experimental aspect of DCS has been described elsewhere [35, 36]. Briefly, it consisted of a high coherence length laser (785 nm, CrystaLaser, Reno, NV), four photon-counting detectors (Perkin Elmer, Waltham, MA) and a custom-built autocorrelator board (Correlator.com). The source was directed to the tissue by a multi-mode source fiber (400 μm core, NA 0.22) and collected with single-mode detector fibers (5 μm core, NA 0.22). The outputs from the photodetectors were sent to the correlator board to determine the intensity autocorrelation function and photon arrival times, which were then saved by the computer.
For continuous measurements of the tumor vascular response during PDT, the optical probe needed to be held off the surface to prevent shading of the treatment light. To accomplish this, a lightweight, non-contact probe (Figures 1A,B) was positioned above the mouse [34, 48, 49]. This probe combined the delivery of the treatment light with the DCS fibers and is shown in Figure 1A. A fiber-coupled collimator (ThorLabs, Newton, NJ) was used to direct the light to the tissue. The detector fibers were held in a custom assembly with a single 4 mm diameter lens, 4 mm focal length (Edmund optics, Barrington, NJ). The non-contact probe had adjustable arms for positioning the source and detector spots on the tumor surface. One source and two detectors were used for the non-contact probe, while the other two detector channels were attached to the contact probe for reading blood flow from the opposite hip for control and global blood flow measurements. The source-detector separations for the non-contact probe were 2.5 and 4 mm, while the source-detector separations for the contact probe were 0.6 and 1.6 mm. If we assumed the average light penetration depth ranges between 1/3 and 1/2 of the source-detector separations [37, 50], then the average penetration depth in tumor would range approximately from 0.83 to 2 mm. The three legs of the tripod were attached to a metal disc with a central hole creating a light treatment field of approximately 1.1 cm in diameter (area = 1 cm2) (Figure 1C).
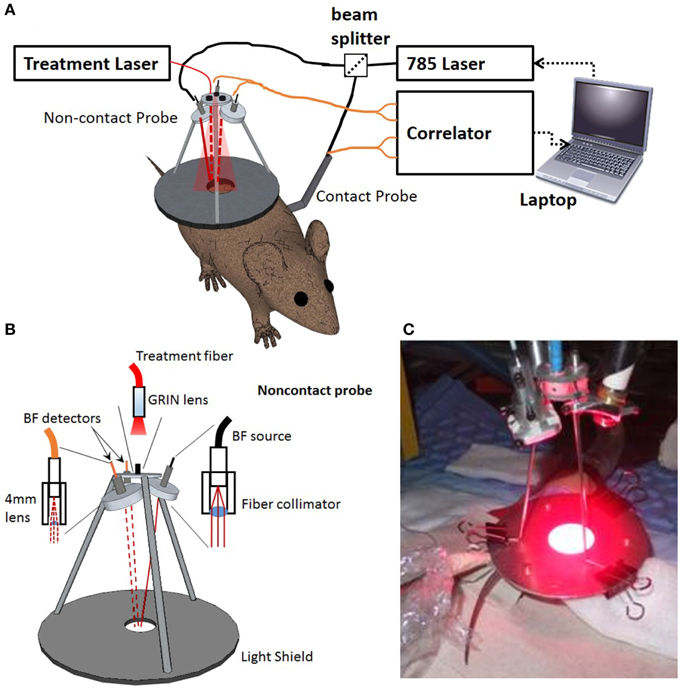
Figure 1. Setup for continuous blood flow measurements during PDT. (A) Schematic showing the basics of the DCS instrument including the laptop, laser, correlator, and beam splitter along with the two probes in relation to the mouse. The contact probe was placed directly on the mouse's hip while the non-contact probe was placed over the tumor. The solid red line shows the DCS illumination light rays and the red dashed lines indicate DCS detected light rays. (B) Schematic diagram and (C) picture of the probe during PDT treatment of a mouse.
All mouse studies were carried out in accordance with the Roswell Park Cancer Institute Institutional Animal Care and Use Committee. Female C3Hf/HeRos mice (n = 13) were acquired from an in house breeding colony. At 12 weeks, mice were shaved and inoculated subcutaneously on the right flank just above the back leg with 3.5 × 10⁵ SCCVII cells (a murine head and neck cell line) suspended in 50 μL phosphate buffered saline (PBS). Three days later the skin over the tumor injection site and corresponding site on the control leg was depilated with Nair and tumor growth was monitored. After approximately 8 days the tumors had reached ~ 7 × 7 mm.
To evaluate the histological effect of PDT in a human-relevant head and neck tumor, a second mouse model was used for tumor sectioning to assess the destruction of microvessels after PDT. Male SCID mice (n = 12) were acquired from an in house-breeding colony and xenografts of a human hypopharyngeal cell line (FaDu) were grown at the same subcutaneous site as described for the SCCVII. After approximately 14 days, the tumors reached ~ 7 × 7 mm.
A summary of the experimental timeline is shown in Figure 2. Twenty-four hours before PDT, mice were injected i.v. with 0.47 μmol/kg of the photosensitizer Photoclor (2-[1-Hexyloxyethyl]-2-devinylpyropheophorbide-a, HPPH). On the day of the experiment, mice were placed on a heating pad to maintain body temperature and anesthetized with isofluorane during the treatment and measurement period. Temperature was monitored every 5 min throughout treatment with a sub dermal needle sensor digital thermometer. After 10 min for stabilization, the non-contact DCS/treatment probe was positioned over the tumor.
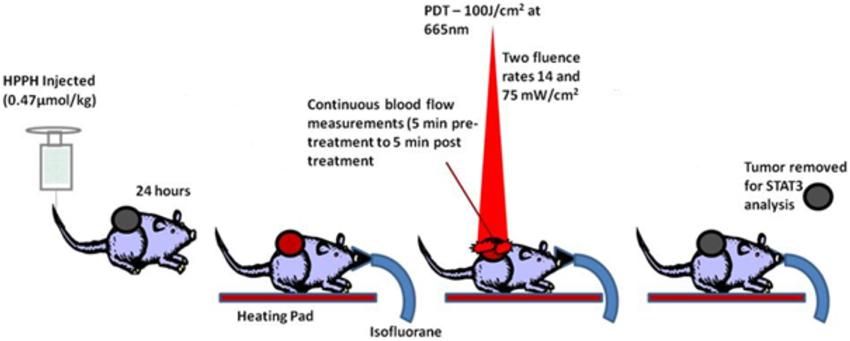
Figure 2. Schematic of preclinical PDT highlighting the optical measurement times in relation to the HPPH injection and light delivery.
The tripod system was centered over the tumor so that only the tumor and a small margin of normal tissue received the treatment light. Marks on the metal disc showed where the source and detector fibers were collimated for accurate probe positioning. The contact probe was contained in saran wrap and placed in contact with the back left leg to measure blood flow changes at a non-treatment site.
The treatment light with a wavelength of 665 nm was generated by an Argon pumped dye laser and was coupled to the tripod with a 400 μM fiber. The light was passed through a variable attenuator to adjust the desired fluence rate. To prevent the treatment light from interfering with the continuous DCS measurements (785 nm), 665 nm light was filtered out by several layers of color filters (bluegrass, GAM color) placed in front of the DCS detector fibers.
There were two treatment groups of mice, each receiving different fluence rates: 14 mW/cm2 (n = 5) and 75 mW/cm2 (n = 5). The total delivered fluence was 100 J/cm2 for both groups. Thus, the low fluence rate group (14 mW/cm2) was treated for approximately 119 min and the high fluence rate group (75 mW/cm2) was treated for approximately 22 min. To obtain pre-PDT and post-PDT time-points, blood flow measurements were acquired for 5 min before treatment started and 5 min after treatment completed. There were three control mice: one mouse received low fluence rate light with no photosensitizer, one mouse received high fluence rate light with no photosensitizer and one mouse received no light and no photosensitizer.
To compare the blood flow dynamics between different mice groups, the changes in relative blood flow (rBF) were plotted as a function of delivered light dose. From the rBF plots, blood flow variables were calculated for each mouse. All blood flow variables are reported in the text as the average of all mice in the treatment group ± standard deviation. Comparison between treatment groups was performed using the Wilcoxon rank sum test and significance was determined as p < 0.05.
Table 1 summarizes the investigated parameters in the blood flow dynamics. The variables rBFmax and rBFmin are the values of rBF at the height of the first PDT induced blood flow increase and the base of that peak respectively. The J-BFmax and J-BFmin are the fluence delivered to the maximum and minimum rBF values of the first PDT induced peak. The J-50 is defined as the energy delivered while the rBF remained above 50% of baseline. This parameter is related to the delivered light when blood flow is close to baseline levels or relatively high enough so that tissue had enough available oxygenation that will effectively contribute to the photoreaction. Similarly, the low blood flow values would indicate oxygen depletion in tissue. The last two variables in Table 1; the Interval Light Dose (ILD) and the Flow Reduction Rate (FRR) are similar to previously reported parameters by Yu et al. [37]: the ILD indicates the light dose between the first maximum blood flow and the first minimum blood flow values, and the FRR indicates the slope between these max and min values. All these variables are further illustrated in representative rBF plots during PDT for a mouse receiving low fluence rate (Figure 3A) and high fluence rate (Figure 3B).
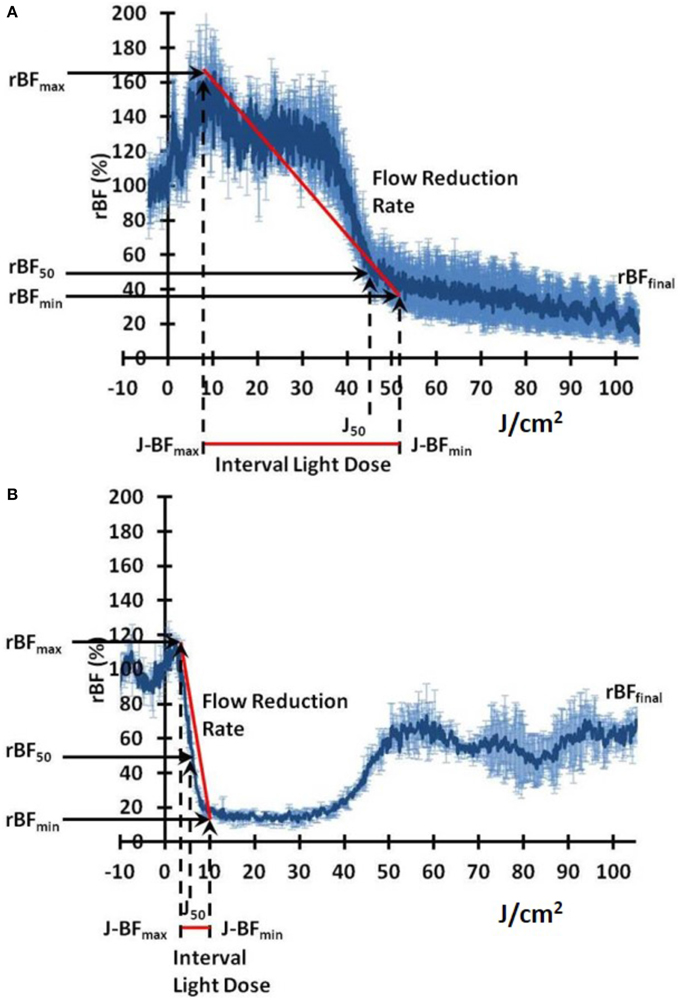
Figure 3. Representative plots of relative blood flow (rBF) dynamics as a function of delivered light fluence rates: (A) low fluence rate, (B) high fluence rate. The blood flow metrics summarized in Table 1 are indicated on the plots.
When cells containing a photosensitizer (HPPH in our case) are treated with therapeutic light, the photoreaction causes the production of singlet oxygen and other ROS which oxidize a broad range of molecules. Figure 4A shows the SCCVII cells surviving 24 h post PDT (3 J/cm2) with no administered photosensitizer (control) while Figures 4B,C show cells treated with 6.25 nM and 12.5 nM HPPH, respectively. One immediate and preferential target of singlet oxygen/ROS is latent STAT3 that is covalently crosslinked to homodimers [51]. Figure 5A (the graphical representation of the Western blots in Figure 5B) shows the STAT3 crosslinking is affected by both HPPH concentration and light dose in SCCVII cells. The level of STAT3 crosslinking in tumor tissue subjected to PDT in situ was determined by excising the tumor immediately following light treatment, mincing tumor tissue and extracting proteins by sonication in RIPA buffer. Aliquots of cleared extracts, containing 20 μg proteins, were separated under denatured condition on 6% SDS polyacrylamide gels and analyzed by immunoblotting for the level of homodimeric STAT3 relative to total STAT3 as reported previously [22, 52].

Figure 4. Cell killing by HPPH PDT. SCCVII cells were treated with 3 J/cm2 and the surviving cells after 24 post-PDT incubation are shown. (A) Shows 0 nM HPPH, (B) 6.25 nM HPPH, and (C) 12.5 nM HPPH photosensitizer.
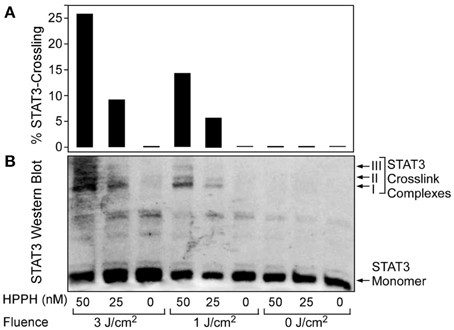
Figure 5. STAT3 crosslinking is affected by both drug and light dose. SCCVII cells were subjected to HPPH PDT under conditions as indicated at the bottom. (A) Graphical representation of the relative level of STAT3 crosslinking as a function of HPPH concentration and delivered light fluence. (B) Western blot images showing the PDT-dependent formation of STAT3 dimer complexes.
To visualize the impact of fluence rate on tumor vasculature, FaDu xenografts were used. SCID mice with subcutaneous human FaDu tumor were given the same PDT treatment regimens as mentioned above for the SCCVII tumors: low fluence rate PDT (n = 5), high fluence rate PDT (n = 5) and no-light controls (n = 2). After PDT, the tumors were removed and embedded in Optimal Cutting Temperature (OCT) compound and 5 μm-thick sections cut in a cryostat. Tumor sections were fixed in 4% paraformaldehyde and processed for immunohistochemical staining of the endothelial cell marker CD31. To calculate microvessel density after PDT, three regions of 1000 × 1000 pixels were selected from each tumor. A custom Matlab program determined the percentage of the image stained for CD31. Treatment groups were compared using the Wilcoxon rank sum test to assess significance (p < 0.05). Microvessel density here is reported as the percentage of the image stained for the vascular marker [53].
Head and neck tumors in mice treated with HPPH-PDT showed several characteristic features of blood flow dynamics during light exposure. Once the treatment light was applied, there was typically an increase in blood flow followed by a decrease. As shown in Figure 6A blood flow in tumors treated with high fluence rate undergo a drastic reduction that progressively recovers over the remaining treatment period, resulting in rBFfinal values close to the pre-treatment values. In contrast, the blood flow in tumors treated with low fluence rate showed a continuous decrease throughout treatment (Figure 6B).
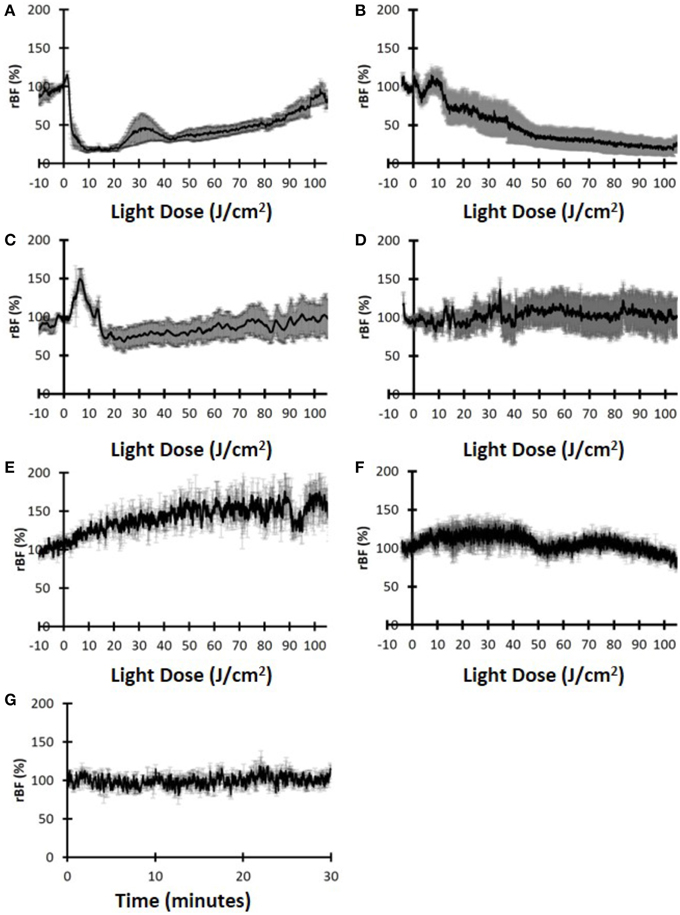
Figure 6. Relative blood flow (rBF) dynamics indicate the differences for the two treatment groups. (A) Tumor rBF for mice treated with high fluence rate and (B) Tumor rBF for mice treated with the low fluence rate. (C) Hip muscle rBF for mice treated with high fluence rate. (D) Hip muscle rBF for mice treated with low fluence rate. (E) Tumor rBF for control mice treated with high fluence rate. (F) Tumor rBF for control mice treated with low fluence rate. (G) Tumor rBF for control mice with no treatment light.
More specifically, the magnitude of the initial increase (rBFmax) was similar for both groups (119.9 ± 30.6% vs. 120.0 ± 8.1% for the low fluence rate and high fluence rate, respectively). For the high fluence rate group, the initial increase occurred very early in the treatment (J-BFmax = 1.5 ± 0.6 J/cm2) and was followed almost immediately by a rapid decrease. For the low fluence rate group, the initial increase in blood flow occurred much later (J-BFmax = 9.2 ± 1.0 J/cm2) and the decrease was not as rapid as the high fluence rate case. The difference in J-BFmax for the two fluence rate groups was significantly different (p = 0.016). The rBFfinal between the two fluence rate groups was also significant (76.5 ± 30.5% for the high-fluence-rate and 16.9 ± 19.3% for the low-fluence-rate group, p = 0.032). A summary of blood flow parameters investigated is shown in Table 2.
These results may imply that that HPPH-PDT with high-fluence-rate induced acute blood flow shutdown early in the treatment with no permanent destruction of vasculature, resulting in a delayed low, but measurable recovery of blood flow accounting for an overall ineffective PDT. Figures 6C,D show the rBF during PDT measured on the contra-lateral hip, away from the treatment light. Neither the high fluence rate treated mice (Figure 6C) nor the low fluence rate treated mice (Figure 6D) showed a PDT induced reduction in blood flow. These results indicate that PDT induced vascular effects mainly in the tumor and these changes were not due to systemic effects.
To further verify that these vascular changes were indeed induced by PDT, control mice with no administered photosensitizer were also measured. Figures 6E–G show the data for the control group that did not receive photosensitizer. Figures 6E,F show the groups that had high fluence rate and low-fluence rate light, respectively, while Figure 6G shows the control group with no administered light. For all three groups there was no measurable decrease of blood flow and in fact the two light-administered control group showed increases in rBF during illumination, probably due to local heating. The control group with no drug or light showed stable rBF over 30 min. Thus, we can infer that the vascular shutdown observed in Figures 6A,B were mainly due to PDT.
As shown in Figure 7, the high fluence rate group (Figure 7A) and control group (Figure 7C) had visible staining for blood vessels (arrows), indicating there were significant number of vessels present after PDT for both groups. On the other hand, the low-fluence-rate group did show less staining of vessels (Figure 7B). The microscopic data confirmed our macroscopic observations of vascular impairment caused by the PDT treatment. The quantitation of the CD31-postive cells indicated that at post-PDT the control and the high-fluence-rate group had an average microvessel density of 3.91 ± 1.60% and 3.97 ± 2.25%, respectively (Figure 7D), and these values were not statistically different (p > 0.05, Wilcoxon rank sum test). In contrast, the low-fluence-rate group had an average of 1.22 ± 1.10% percent staining and was significantly lower than both the high-fluence-rate (p = 1.4e-5) and control (p = 0.0006) groups. These results highlight that compared to high-fluence-rate PDT, low-fluence-rate PDT did result in a more effective destruction of tumor vasculature.
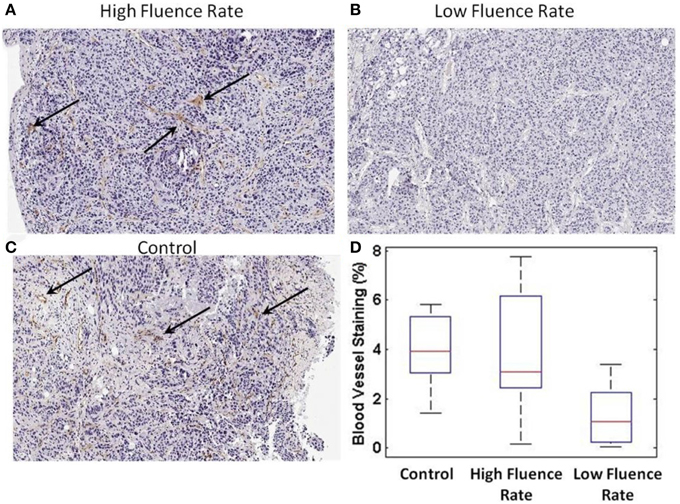
Figure 7. CD31 microvessel staining post-PDT. (A) CD31 staining from a high-fluence-rate treated mouse (B) low-fluence-rate treated mouse (C) control mouse. The black arrows highlight regions of staining. (D) Quantitative bar plot representation of the CD31 microvessel staining for each group.
Next, we compared our non-invasive blood flow measurements with the delivered photoreaction within the tumor as determined by the level of STAT3 dimerization immediately following light treatment. Since STAT3 crosslinking is directly proportional to the photosensitizer-mediated photoreaction, it serves as a molecular marker of deposited PDT dose. As shown in Figure 8, STAT3 crosslinking was 17.8 ± 10.9% (average ± standard deviation) for the low-fluence-rate group and 7.0 ± 6.3% for the high-fluence-rate group.
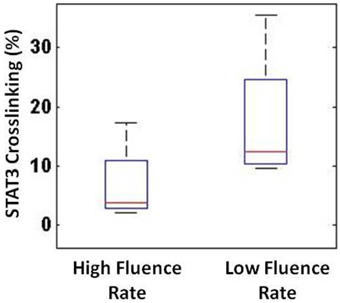
Figure 8. STAT3 crosslinking showed a substantial difference between the high- and low-fluence-rate groups.
Then, the blood flow metrics discussed above were compared to the STAT3 crosslinking to determine whether any of the optical metrics could provide a non-invasive tool to infer about the photoreaction. We observed that, as summarized in Figure 9, blood FRR and ILD metrics correlated reasonably well with the STAT3 crosslinking (r2 = 0.745 and r2 = 0.795, respectively). As Figure 9A indicates, if the blood flow decreases too rapidly, there would be less available oxygen (and drug) in tissue, which would lead to less PDT photoreaction and less STAT3 crosslinking. Additionally, the light-dose interval (Figure 9B) and the joules delivered while the blood flow was above 50% (J-50) (Figure 9C) correlated well with STAT3 crosslinking (r2 = 0.7953 and 0.872). These results indicate that blood flow dynamics, measured with DCS, can non-invasively assess the PDT photoreaction and destruction of microvasculature.
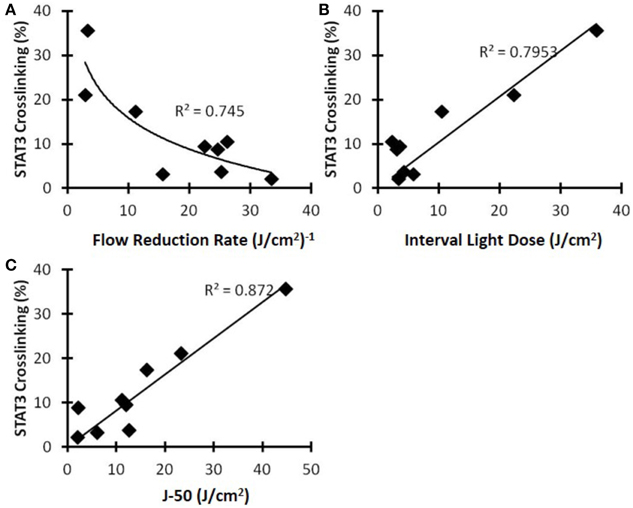
Figure 9. STAT3 crosslinking as a function of various blood flow metrics for the C3H mice with SCCVII tumors. (A) Flow reduction rate, (B) interval light dose, and (C) the new metric J-50.
Blood flow controls the delivery of nutrients and oxygen to tumors. Targeting vasculature is a common mechanism of action for many cancer therapies, including PDT. Therefore, it is important to measure the blood flow of tumors before, during and after PDT. The blood flow dynamics can indicate PDT effects in real-time and possibly predict the response, which for patients is typically assessed 3 months after PDT. Immediate assessment is of particular interest to allow for earlier re-treatment if necessary. Noninvasively measured metrics and STAT3 crosslinking may be biomarkers of the PDT response. In this study, we focused on several metrics related to the blood flow dynamics such as the final value of the blood flow at the completion of the treatment, the blood FRR, the light dose interval when the blood flow reached the highest and lowest values, and the delivered light dose while the blood flow values were effectively high during the treatment. These parameters indicated substantial differences with respect to the administered PDT treatment light fluence rates, which were confirmed with the CD31 staining and STAT3 crosslinking studies [54–57].
Figure 10 proposes the mechanistic basis for the different outcomes of low and high fluence rate PDT. During effective PDT as achieved by low fluence, blood vessels in the tumor remain open early in the treatment. This allows oxygen to be resupplied while it is continuously being consumed during PDT. As the treatment progresses, blood vessels begin to shut down, limiting the amount of available oxygen for PDT. After treatment the majority of blood vessels are expected to stay shutdown, preventing oxygen and nutrients from the tumor (indirect tumor killing). During low-fluence-rate PDT, since both oxygen and PS were available throughout the treatment, sufficient photoreaction occurs to destroy the tumor. During high-fluence-rate PDT, blood vessels are shutdown very early in the treatment, limiting the available oxygen. The blood vessels recover later in the treatment, but there is no longer sufficient PS in the tumor for effective PDT. The treatment ends with little photoreaction occurring due to the rapid deprivation of oxygen early in the treatment.
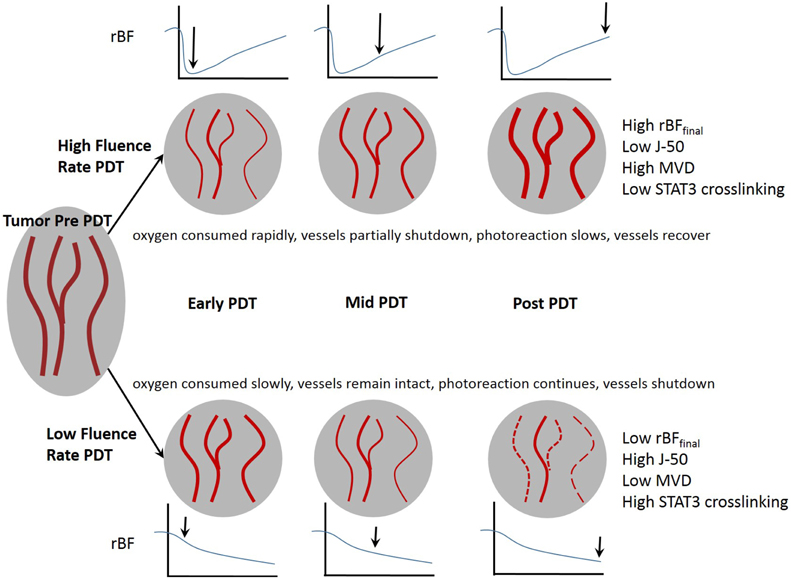
Figure 10. The fluence rate of therapeutic light affects the tumor vasculature and can lead to effective or ineffective PDT.
Our results show that vascular shutdown mainly occurred when both drug and light were administered. The contralateral hip measurements did not indicate any major reduction of blood flow, but did show some fluctuations that may be the consequence of local and systemic effects caused by PDT. The mice treated with only light also did not show vascular shutdown. The high fluence rate treated control mouse showed a steady increase in blood flow during light administration, possibly due to vasodilation caused by heating of the skin.
There was no statistical difference in post-PDT microvessel density between the high-fluence-rate and control groups. Mice treated with low-fluence-rate PDT showed statistically lower post-PDT microvessel density than the control and high fluence rate groups. This indicates that low fluence-rate-PDT led to a more complete vascular shutdown, while high fluence rate PDT led to an early temporary reduction of blood flow followed by a partial or possibly a complete recovery. This has major implications for long-term recovery since vascular shutdown is often a goal of PDT to prevent nutrients and oxygen from reaching the tumor. For technical reasons, the microvessel density could only be determined for post-PDT tumor tissue because removing a portion of the tumor before PDT would cause bleeding, interfering with the blood flow measurements. As previously already demonstrated, an accurate measure for vasculature shutdown is the change in microvessel density [10, 17, 19, 54–62].
Our results indicate that high and low fluence rates induce characteristically different blood flow dynamics. The vascular effects were also visible from the CD31-positive vessel staining of the tumor sections, confirming the dependency on the fluence rate. In addition, the metrics derived from the blood flow dynamics correlated with the STAT3 crosslinking. Higher crosslinking was observed for tumors treated with the low fluence rate than those treated with the high fluence rate indicating an overall greater photoreaction. The primary advantage of opticalce measurements of blood flow dynamics is the assessment of PDT efficacy in near real-time. The parameters could provide feedback to the physician, allowing adjustment of the treatment light in the event of excessively rapid vascular shutdown. Since oxygen and photosensitizer are crucial for PDT, assessing tissue oxygen saturation and photosensitizer content would provide additional indicators about the ongoing PDT photoreaction. Implementing concurrent measurements of blood flow, oxygen, and photosensitizer content would be a next step.
The authors declare that the research was conducted in the absence of any commercial or financial relationships that could be construed as a potential conflict of interest.
This research was supported by NCI grants P01CA55791 and RPCI Support Grant P30CA16056.
1. Amelink A, Sterenborg HJ, Roodenburg JL, Witjes MJ. Non-invasive measurement of the microvascular properties of non-dysplastic and dysplastic oral leukoplakias by use of optical spectroscopy. Oral Oncol. (2011) 47:1165–70. doi: 10.1016/j.oraloncology.2011.08.014
PubMed Abstract | Full Text | CrossRef Full Text | Google Scholar
2. Poh CF, Zhang L, Anderson DW, Durham JS, Williams PM, Priddy RW, et al. Fluorescence visualization detection of field alterations in tumor margins of oral cancer patients. Clin Cancer Res. (2006) 12:6716–22. doi: 10.1158/1078-0432.CCR-06-1317
PubMed Abstract | Full Text | CrossRef Full Text | Google Scholar
3. Wilson BC, Patterson MS. The physics, biophysics and technology of photodynamic therapy. Phys Med Biol. (2008) 53:R61–109. doi: 10.1088/0031-9155/53/9/R01
PubMed Abstract | Full Text | CrossRef Full Text | Google Scholar
4. Grant WE, Hopper C, Speight PM, Macrobert AJ, Bown SG. Photodynamic therapy of malignant and premalignant lesions in patients with ‘field cancerization’ of the oral cavity. J Laryngol Otol. (1993) 107:1140–5.
5. Karakullukcu B, Kanick SC, Aans JB, Sterenborg HJ, Tan IB, Amelink A, et al. Clinical feasibility of monitoring m-THPC mediated photodynamic therapy by means of fluorescence differential path-length spectroscopy. J Biophotonics (2011) 4:740–51. doi: 10.1002/jbio.201100051
PubMed Abstract | Full Text | CrossRef Full Text | Google Scholar
6. Hopper C, Kubler A, Lewis H, Tan IB, Putnam G. mTHPC-mediated photodynamic therapy for early oral squamous cell carcinoma. Int J Cancer. (2004) 111:138–46. doi: 10.1002/ijc.20209
PubMed Abstract | Full Text | CrossRef Full Text | Google Scholar
7. Quon H, Grossman CE, Finlay JC, Zhu TC, Clemmens CS, Malloy KM, et al. Photodynamic therapy in the management of pre-malignant head and neck mucosal dysplasia and microinvasive carcinoma. Photodiagnosis Photodyn Ther. (2011) 8:75–85. doi: 10.1016/j.pdpdt.2011.01.001
PubMed Abstract | Full Text | CrossRef Full Text | Google Scholar
8. Tan IB, Oppelaar H, Ruevekamp MC, Veenhuizen RB, Timmers A, Stewart FA. The importance of in situ light dosimetry for photodynamic therapy of oral cavity tumors. Head Neck. (1999) 21:434–41.
9. Oleinick NL, Morris RL, Belichenko I. The role of apoptosis in response to photodynamic therapy: what, where, why, and how. Photochem Photobiol Sci. (2002) 1:1–21. doi: 10.1039/b108586g
PubMed Abstract | Full Text | CrossRef Full Text | Google Scholar
10. Chen B, Pogue BW, Goodwin IA, O'Hara JA, Wilmot CM, Hutchins JE, et al. Blood flow dynamics after photodynamic therapy with verteporfin in the RIF-1 tumor. Radiat Res. (2003) 160:452–9. doi: 10.1667/RR3059
PubMed Abstract | Full Text | CrossRef Full Text | Google Scholar
11. van Duijnhoven FH, Aalbers RI, Rovers JP, Terpstra OT, Kuppen PJ. The immunological consequences of photodynamic treatment of cancer, a literature review. Immunobiology (2003) 207:105–13. doi: 10.1078/0171-2985-00221
PubMed Abstract | Full Text | CrossRef Full Text | Google Scholar
12. Vaupel P, Kallinowski F, Okunieff P. Blood flow, oxygen and nutrient supply, and metabolic microenvironment of human tumors: a review. Cancer Res. (1989) 49:6449–65.
13. Foster TH, Murant RS, Bryant RG, Knox RS, Gibson SL, Hilf R. Oxygen consumption and diffusion effects in photodynamic therapy. Radiat Res. (1991) 126:296–303. doi: 10.2307/3577919
PubMed Abstract | Full Text | CrossRef Full Text | Google Scholar
14. Bargo PR, Prahl SA, Goodell TT, Sleven RA, Koval G, Blair G, et al. In vivo determination of optical properties of normal and tumor tissue with white light reflectance and an empirical light transport model during endoscopy. J Biomed Opt. (2005) 10:034018. doi: 10.1117/1.1921907
PubMed Abstract | Full Text | CrossRef Full Text | Google Scholar
15. Jacques SL. Laser-tissue interactions. Photochemical, photothermal, and photomechanical. Surg Clin North Am. (1992) 72:531–58.
16. Jacques SL. Light distributions from point, line and plane sources for photochemical reactions and fluorescence in turbid biological tissues. Photochem Photobiol. (1998) 67:23–32. doi: 10.1111/j.1751-1097.1998.tb05161.x
PubMed Abstract | Full Text | CrossRef Full Text | Google Scholar
17. Busch TM, Wang HW, Wileyto EP, Yu G, Bunte RM. Increasing damage to tumor blood vessels during motexafin lutetium-PDT through use of low fluence rate. Radiat Res. (2010) 174:331–40. doi: 10.1667/RR2075.1
PubMed Abstract | Full Text | CrossRef Full Text | Google Scholar
18. Henderson BW, Busch TM, Snyder JW. Fluence rate as a modulator of PDT mechanisms. Lasers Surg Med. (2006) 38:489–93. doi: 10.1002/lsm.20327
PubMed Abstract | Full Text | CrossRef Full Text | Google Scholar
19. Madar-Balakirski N, Tempel-Brami C, Kalchenko V, Brenner O, Varon D, Scherz A, et al. Permanent occlusion of feeding arteries and draining veins in solid mouse tumors by vascular targeted photodynamic therapy (VTP) with Tookad. PLoS ONE (2010) 5:e10282. doi: 10.1371/journal.pone.0010282
PubMed Abstract | Full Text | CrossRef Full Text | Google Scholar
20. Busch TM. Local physiological changes during photodynamic therapy. Lasers Surg Med. (2006) 38:494–9. doi: 10.1002/lsm.20355
PubMed Abstract | Full Text | CrossRef Full Text | Google Scholar
21. Busch TM, Hahn SM, Evans SM, Koch CJ. Depletion of tumor oxygenation during photodynamic therapy: detection by the hypoxia marker EF3 [2-(2-nitroimidazol-1[H]-yl)-N-(3,3,3-trifluoropropyl)acetamide]. Cancer Res. (2000) 60:2636–42.
22. Henderson BW, Daroqui C, Tracy E, Vaughan LA, Loewen GM, Cooper MT, et al. Cross-linking of signal transducer and activator of transcription 3–a molecular marker for the photodynamic reaction in cells and tumors. Clin Cancer Res. (2007) 13:3156–63. doi: 10.1158/1078-0432.CCR-06-2950
PubMed Abstract | Full Text | CrossRef Full Text | Google Scholar
23. Mayr NA, Yuh WT, Magnotta VA, Ehrhardt JC, Wheeler JA, Sorosky JI, et al. Tumor perfusion studies using fast magnetic resonance imaging technique in advanced cervical cancer: a new noninvasive predictive assay. Int J Radiat Oncol Biol Phys. (1996) 36:623–33. doi: 10.1016/S0360-3016(97)85090-0
PubMed Abstract | Full Text | CrossRef Full Text | Google Scholar
24. DeVries AF, Kremser C, Hein PA, Griebel J, Krezcy A, Ofner D, et al. Tumor microcirculation and diffusion predict therapy outcome for primary rectal carcinoma. Int J Radiat Oncol Biol Phys. (2003) 56:958–65. doi: 10.1016/S0360-3016(03)00208-6
PubMed Abstract | Full Text | CrossRef Full Text | Google Scholar
25. Hermans R, Lambin P, Van den Bogaert W, Haustermans K, Van der Goten A, Baert AL. Non-invasive tumour perfusion measurement by dynamic CT: preliminary results. Radiother Oncol. (1997) 44:159–62. doi: 10.1016/S0167-8140(97)01913-0
PubMed Abstract | Full Text | CrossRef Full Text | Google Scholar
26. Hermans R, Lambin P, Van der Goten A, Van den Bogaert W, Verbist B, Weltens C, et al. Tumoural perfusion as measured by dynamic computed tomography in head and neck carcinoma. Radiother Oncol. (1999) 53:105–11. doi: 10.1016/S0167-8140(99)00132-2
PubMed Abstract | Full Text | CrossRef Full Text | Google Scholar
27. Lapointe D, Brasseur N, Cadorette J, La Madeleine C, Rodrigue S, van Lier JE, et al. High-resolution PET imaging for in vivo monitoring of tumor response after photodynamic therapy in mice. J Nucl Med. (1999) 40:876–82.
28. Pirhonen JP, Grenman SA, Bredbacka AB, Bahado-Singh RO, Salmi TA. Effects of external radiotherapy on uterine blood flow in patients with advanced cervical carcinoma assessed by color Doppler ultrasonography. Cancer (1995) 76:67–71.
29. Huilgol NG, Khan MM, Puniyani R. Capillary perfusion–a study in two groups of radiated patients for cancer of head and neck. Indian J Cancer (1995) 32:59–62.
30. Enejder AM, af Klinteberg C, Wang I, Andersson-Engels S, Bendsoe N, Svanberg S, et al. Blood perfusion studies on basal cell carcinomas in conjunction with photodynamic therapy and cryotherapy employing laser-Doppler perfusion imaging. Acta Derm Venereol. (2000) 80:19–23. doi: 10.1080/000155500750012441
PubMed Abstract | Full Text | CrossRef Full Text | Google Scholar
31. Liu DL, Svanberg K, Wang I, Andersson-Engels S, Svanberg S. Laser Doppler perfusion imaging: new technique for determination of perfusion and reperfusion of splanchnic organs and tumor tissue. Lasers Surg Med. (1997) 20:473–9.
32. Wang I, Andersson-Engels S, Nilsson GE, Wardell K, Svanberg K. Superficial blood flow following photodynamic therapy of malignant non-melanoma skin tumours measured by laser Doppler perfusion imaging. Br J Dermatol. (1997) 136:184–9. doi: 10.1111/j.1365-2133.1997.tb14893.x
PubMed Abstract | Full Text | CrossRef Full Text | Google Scholar
33. Khurana M, Moriyama EH, Mariampillai A, Wilson BC. Intravital high-resolution optical imaging of individual vessel response to photodynamic treatment. J Biomed Opt. (2008) 13:040502. doi: 10.1117/1.2965545
PubMed Abstract | Full Text | CrossRef Full Text | Google Scholar
34. Becker TL, Paquette AD, Keymel KR, Henderson BW, Sunar U. Monitoring blood flow responses during topical ALA-PDT. Biomed Opt Express (2010) 2:123–30. doi: 10.1364/BOE.2.000123
PubMed Abstract | Full Text | CrossRef Full Text | Google Scholar
35. Rohrbach DJ, Rigual N, Tracy E, Kowalczewski A, Keymel KL, Cooper MT, et al. Interlesion differences in the local photodynamic therapy response of oral cavity lesions assessed by diffuse optical spectroscopies. Biomed Opt Express (2012) 3:2142–53. doi: 10.1364/BOE.3.002142
PubMed Abstract | Full Text | CrossRef Full Text | Google Scholar
36. Sunar U, Rohrbach D, Rigual N, Tracy E, Keymel K, Cooper MT, et al. Monitoring photobleaching and hemodynamic responses to HPPH-mediated photodynamic therapy of head and neck cancer: a case report. Opt Express (2010) 18:14969–78. doi: 10.1364/OE.18.014969
PubMed Abstract | Full Text | CrossRef Full Text | Google Scholar
37. Yu G, Durduran T, Zhou C, Wang HW, Putt ME, Saunders HM, et al. Noninvasive monitoring of murine tumor blood flow during and after photodynamic therapy provides early assessment of therapeutic efficacy. Clin Cancer Res. (2005) 11:3543–52. doi: 10.1158/1078-0432.CCR-04-2582
PubMed Abstract | Full Text | CrossRef Full Text | Google Scholar
38. Boas DA, Campbell LE, Yodh AG. Scattering and imaging with diffusing temporal field correlations. Phys Rev Lett. (1995) 75:1855–8. doi: 10.1103/PhysRevLett.75.1855
PubMed Abstract | Full Text | CrossRef Full Text | Google Scholar
39. Boas DA, Yodh AG. Spatially varying dynamical properties of turbid media probed with diffusing temporal light correlation. J Opt Soc Am A (1997) 14:192–215. doi: 10.1364/JOSAA.14.000192
40. Mesquita RC, Durduran T, Yu G, Buckley EM, Kim MN, Zhou C, et al. Direct measurement of tissue blood flow and metabolism with diffuse optics. Philos. Trans A Math Phys Eng Sci. (2011) 369:4390–406. doi: 10.1098/rsta.2011.0232
PubMed Abstract | Full Text | CrossRef Full Text | Google Scholar
41. Cheung C, Culver JP, Takahashi K, Greenberg JH, Yodh AG. In vivo cerebrovascular measurement combining diffuse near-infrared absorption and correlation spectroscopies. Phys Med Biol. (2001) 46:2053–65. doi: 10.1088/0031-9155/46/8/302
PubMed Abstract | Full Text | CrossRef Full Text | Google Scholar
42. Culver JP, Durduran T, Furuya D, Cheung C, Greenberg JH, Yodh AG. Diffuse optical tomography of cerebral blood flow, oxygenation, and metabolism in rat during focal ischemia. J Cereb Blood Flow Metab. (2003) 23:911–24. doi: 10.1097/01.WCB.0000076703.71231.BB
PubMed Abstract | Full Text | CrossRef Full Text | Google Scholar
43. Zhou C, Yu G, Furuya D, Greenberg J, Yodh A, Durduran T. Diffuse optical correlation tomography of cerebral blood flow during cortical spreading depression in rat brain. Opt Express (2006) 14:1125–44. doi: 10.1364/OE.14.001125
PubMed Abstract | Full Text | CrossRef Full Text | Google Scholar
44. Sunar U, Makonnen S, Zhou C, Durduran T, Yu G, Wang HW, et al. Hemodynamic responses to antivascular therapy and ionizing radiation assessed by diffuse optical spectroscopies. Opt Express (2007) 15:15507–16. doi: 10.1364/OE.15.015507
PubMed Abstract | Full Text | CrossRef Full Text | Google Scholar
45. Sunar U, Quon H, Durduran T, Zhang J, Du J, Zhou C, et al. Noninvasive diffuse optical measurement of blood flow and blood oxygenation for monitoring radiation therapy in patients with head and neck tumors: a pilot study. J Biomed Opt. (2006) 11:064021. doi: 10.1117/1.2397548
PubMed Abstract | Full Text | CrossRef Full Text | Google Scholar
46. Carp SA, Dai GP, Boas DA, Franceschini MA, Kim YR. Validation of diffuse correlation spectroscopy measurements of rodent cerebral blood flow with simultaneous arterial spin labeling MRI; towards MRI-optical continuous cerebral metabolic monitoring. Biomed Opt Express (2010) 1:553–65. doi: 10.1364/BOE.1.000553
PubMed Abstract | Full Text | CrossRef Full Text | Google Scholar
47. Li J, Dietsche G, Iftime D, Skipetrov SE, Maret G, Elbert T, et al. Noninvasive detection of functional brain activity with near-infrared diffusing-wave spectroscopy. J Biomed Opt. (2005) 10:44002. doi: 10.1117/1.2007987
PubMed Abstract | Full Text | CrossRef Full Text | Google Scholar
48. Becker T. Irradiance: A Parameter Determining Oxygenation during Topical Photodynamic Therapy (PDT). Roswell Park Cancer Institute; State University of New York at Buffalo, Buffalo, NY (2010).
49. Cottrell WJ, Oseroff AR, Foster TH. Portable instrument that integrates irradiation with fluorescence and reflectance spectroscopies during clinical photodynamic therapy of cutaneous disease. Rev Sci Instrum. (2006) 77:064302. doi: 10.1063/1.2204617
50. Patterson MS, Andersson-Engels S, Wilson BC, Osei EK. Absorption spectroscopy in tissue-simulating materials: a theoretical and experimental study of photon paths. Appl Opt. (1995) 34:22–30. doi: 10.1364/AO.34.000022
PubMed Abstract | Full Text | CrossRef Full Text | Google Scholar
51. Liu W, Oseroff AR, Baumann H. Photodynamic therapy causes cross-linking of signal transducer and activator of transcription proteins and attenuation of interleukin-6 cytokine responsiveness in epithelial cells. Cancer Res. (2004) 64:6579–87. doi: 10.1158/0008-5472.CAN-04-1580
PubMed Abstract | Full Text | CrossRef Full Text | Google Scholar
52. Srivatsan A, Wang Y, Joshi P, Sajjad M, Chen Y, Liu C, et al. In vitro cellular uptake and dimerization of signal transducer and activator of transcription-3 (STAT3) identify the photosensitizing and imaging-potential of isomeric photosensitizers derived from chlorophyll-a and bacteriochlorophyll-a. J Med Chem. (2011) 54:6859–73. doi: 10.1021/jm200805y
PubMed Abstract | Full Text | CrossRef Full Text | Google Scholar
53. Choi WW, Lewis MM, Lawson D, Yin-Goen Q, Birdsong GG, Cotsonis GA, et al. Angiogenic and lymphangiogenic microvessel density in breast carcinoma: correlation with clinicopathologic parameters and VEGF-family gene expression. Mod Pathol. (2005) 18:143–52. doi: 10.1038/modpathol.3800253
PubMed Abstract | Full Text | CrossRef Full Text | Google Scholar
54. Bhuvaneswari R, Gan YY, Lucky SS, Chin WWL, Ali SM, Soo KC, et al. Molecular profiling of angiogenesis in hypericin mediated photodynamic therapy. Mol Cancer (2008) 7:56. doi: 10.1186/1476-4598-7-56
PubMed Abstract | Full Text | CrossRef Full Text | Google Scholar
55. Middelburg TA, de Vijlder HC, de Bruijn HS, van der Ploeg-van den Heuvel A, Neumann HAM, de Haas ERM, et al. Topical photodynamic therapy using different porphyrin precursors leads to differences in vascular photosensitization and vascular damage in normal mouse skin. Photochem Photobiol. (2014) 90:896–902. doi: 10.1111/php.12271
PubMed Abstract | Full Text | CrossRef Full Text | Google Scholar
56. Ren J, Li P, Zhao H, Chen D, Zhen J, Wang Y, et al. Assessment of tissue perfusion changes in port wine stains after vascular targeted photodynamic therapy: a short-term follow-up study. Lasers Med Sci. (2014) 29:781–8. doi: 10.1007/s10103-013-1420-4
PubMed Abstract | Full Text | CrossRef Full Text | Google Scholar
57. Qiu H, Zhou Y, Gu Y, Ang Q, Zhao S, Wang Y, et al. Monitoring microcirculation changes in port wine stains during vascular targeted photodynamic therapy by laser speckle imaging. Photochem Photobiol. (2012) 88:978–84. doi: 10.1111/j.1751-1097.2012.01153.x
PubMed Abstract | Full Text | CrossRef Full Text | Google Scholar
58. Gross S, Gilead A, Scherz A, Neeman M, Salomon Y. Monitoring photodynamic therapy of solid tumors online by BOLD-contrast MRI. Nat Med. (2003) 9:1327–31. doi: 10.1038/nm940
PubMed Abstract | Full Text | CrossRef Full Text | Google Scholar
59. Standish BA, Lee KKC, Jin X, Mariampillai A, Munce NR, Wood MFG, et al. Interstitial doppler optical coherence tomography as a local tumor necrosis predictor in photodynamic therapy of prostatic carcinoma: an in vivo study. Cancer Res. (2008) 68:9987–95. doi: 10.1158/0008-5472.CAN-08-1128
PubMed Abstract | Full Text | CrossRef Full Text | Google Scholar
60. Li H, Standish BA, Mariampillai A, Munce NR, Mao Y, Chiu S, et al. Feasibility of interstitial Doppler optical coherence tomography for in vivo detection of microvascular changes during photodynamic therapy. Lasers Surg Med. (2006) 38:754–61. doi: 10.1002/lsm.20387
PubMed Abstract | Full Text | CrossRef Full Text | Google Scholar
61. Koudinova NV, Pinthus JH, Brandis A, Brenner O, Bendel P, Ramon J, et al. Photodynamic therapy with Pd-Bacteriopheophorbide (TOOKAD): successful in vivo treatment of human prostatic small cell carcinoma xenografts. Int J Cancer (2003) 104:782–9. doi: 10.1002/ijc.11002
PubMed Abstract | Full Text | CrossRef Full Text | Google Scholar
62. Zilberstein J, Schreiber S, Bloemers MC, Bendel P, Neeman M, Schechtman E, et al. Antivascular treatment of solid melanoma tumors with bacteriochlorophyll-serine-based photodynamic therapy. Photochem Photobiol. (2001) 73:257–66. doi: 10.1562/0031-8655(2001)073<0257:ATOSMT>2.0.CO;2
PubMed Abstract | Full Text | CrossRef Full Text | Google Scholar
Keywords: blood flow, photodynamic therapy, vascular response, diffuse correlation spectroscopy, STAT3 crosslinking, biomarker, head and neck
Citation: Rohrbach DJ, Tracy EC, Walker J, Baumann H and Sunar U (2015) Blood flow dynamics during local photoreaction in a head and neck tumor model. Front. Phys. 3:13. doi: 10.3389/fphy.2015.00013
Received: 16 December 2014; Accepted: 26 February 2015;
Published: 17 March 2015.
Edited by:
Zhen Cheng, Stanford University, USAReviewed by:
Edite Figueiras, Tampere University of Technology, FinlandCopyright © 2015 Rohrbach, Tracy, Walker, Baumann and Sunar. This is an open-access article distributed under the terms of the Creative Commons Attribution License (CC BY). The use, distribution or reproduction in other forums is permitted, provided the original author(s) or licensor are credited and that the original publication in this journal is cited, in accordance with accepted academic practice. No use, distribution or reproduction is permitted which does not comply with these terms.
*Correspondence: Ulas Sunar, Department of Biomedical Engineering, University at Buffalo, Buffalo, NY 14260, USAdWxhc3N1bmFAYnVmZmFsby5lZHU=
Disclaimer: All claims expressed in this article are solely those of the authors and do not necessarily represent those of their affiliated organizations, or those of the publisher, the editors and the reviewers. Any product that may be evaluated in this article or claim that may be made by its manufacturer is not guaranteed or endorsed by the publisher.
Research integrity at Frontiers

Learn more about the work of our research integrity team to safeguard the quality of each article we publish.