- 1Department of Radiation Oncology, School of Medicine, University of Pennsylvania, Philadelphia, PA, USA
- 2Division of Thoracic Surgery, Penn Presbyterian Medical Center, Philadelphia, PA, USA
Pleural photodynamic therapy (PDT) has been used as an adjuvant treatment with lung-sparing surgical treatment for malignant pleural mesothelioma (MPM). In the current pleural PDT protocol, a moving fiber-based point source is used to deliver the light. The light fluences at multiple locations are monitored by several isotropic detectors placed in the pleural cavity. To improve the delivery of light fluence uniformity, an infrared (IR) navigation system is used to track the motion of the light source in real-time at a rate of 20–60 Hz. A treatment planning system uses the laser source positions obtained from the IR camera to calculate light fluence distribution to monitor the light fluence uniformity on the surface of the pleural cavity. A novel reconstruction algorithm is used to determine the pleural cavity surface contour. A dual-correction method is used to match the calculated fluences at detector locations to the detector readings. Preliminary data from a phantom shows superior light uniformity using this method. Light fluence uniformity from patient treatments is also shown with and without the correction method.
Introduction
Malignant pleural mesothelioma (MPM) is an aggressive cancer with a median survival of less than 1 year. Conventional treatment modalities do not show effectiveness in terms of survival [1]. Photodynamic therapy (PDT), however, as an adjuvant surgically-based treatment modality, has allowed for improved survival from previous studies [2–4], which provides an option with great potential for MPM patients. PDT is a treatment modality for cancer and other localized diseases using light [5–11]. During PDT treatment, photosensitizers are excited by light and react with oxygen to generate cytotoxic agents that kill surrounding cells and tissues [12, 13]. An early study involved 40 MPM patients treated by adjuvant pleural PDT using the first generation photosensitizer Photofrin. Median survival reported in this study was 15 months for all patients [4]. The dosimetry was achieved by light fluence calculation based on the patient pleural cavity area obtained from CT images. A phase III trial was carried out at NIH on 63 MPM patients for adjuvant pleural PDT using Photofrin, and no difference in median survival was found in this study [14]. A European study included 28 MPM patients for adjuvant pleural PDT with mTHPC as photosensitizer. Local control of disease was achieved in 50% of the cases [15]. At the Hospital of the University of Pennsylvania, a phase II trail of MPM pleural PDT and surgery was conducted, and survival of more than 2.1 years was achieved in 14 patients undergoing radical pleurectomy, a lung-sparing cytoreduction technique, with adjuvant pleural PDT [2]. The dosimetry for the latter four studies involved isotropic light detectors to monitor the PDT light fluence directly during the procedure.
In pleural PDT procedures, light uniformity is of great importance to achieve ideal treatment efficacy. In our current MPM pleural PDT studies, the light treatments were guided by seven isotropic light detectors at strategic locations on the patient's pleural cavity to maintain uniform light fluence distribution [16, 17]. When the detector readings all reach the prescribed light fluence, the PDT treatment is finished. However, a uniform distribution over a limited number of light detectors does not guarantee a uniform light fluence distribution over every point on the pleural cavity. Therefore, a novel navigation system was proposed to plan and also guide the pleural PDT treatment, with better confidence of obtaining uniform light fluence distribution in the patient's pleural cavity [18]. In this proposed method, light fluence calculations are based on the distance of the light source to the pleural cavity. Therefore, light fluence on every point of the pleural cavity can be calculated, compared, and demonstrated to the physician during PDT treatment, which makes on-line treatment planning feasible. In this method, a navigation system is used to obtain the pleural cavity contour as well as track the motion of the laser source during PDT. This navigation system is based on an IR camera (Polaris® Spectra, North Digital Inc., Waterloo, Canada), which has been used in many medical fields such as spinal surgery, position control of surgical robots, and abdominal therapy intervention [19–22].
In this paper, we describe using an IR camera for pleural cavity contour reconstruction, laser point source position determination in real-time, as well as a simple direct light fluence calculation algorithm to calculate light fluence using the laser source position during PDT. The results are validated in phantom and limited patient studies.
Methods
Navigation System for Pleural PDT Treatment Guidance
A commercial IR navigation system (Polaris, NDI, waterloo, Canada) was introduced to pleural PDT for real-time tracking and also treatment guidance [18]. It is consistent of a pair of stereo camera that measures the light reflection from a modulated laser source (wavelength 850 nm), see Figure 1A. Typically 4 reflectors with known geometry is tracked in real-time (at a rate of 20–60 Hz), The positions of the 4 markers are used to determine the 3D position (x, y, z) and orientation (q1, q2, q3, q4) of the tip of the metal rod (also called a wand) (see Figure 1B). Utilizing the IR camera as shown in Figure 1A, the navigation system tracked treatment source motion in 3D and collected raw contour data. The accuracy of the system was ~0.5 mm in 3D, and the maximum volume for the extended system was ~205 × 186 × 147 cm3, which was optimal for operations on our patient population.
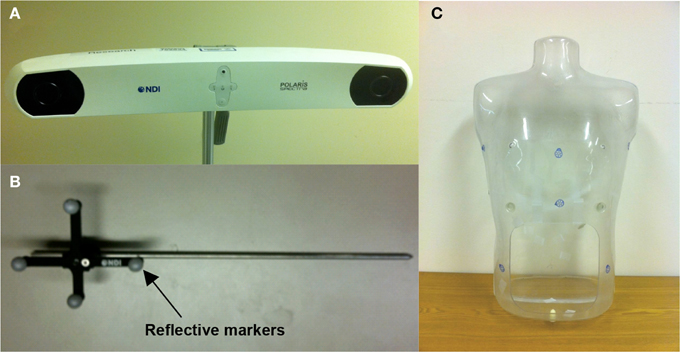
Figure 1. Photographs of (A) pleural PDT navigation camera, (B) tracking tool for the navigation system, and (C) human-shape phantom.
The tracking tool in the navigation system is a rigid body built on passive reflective markers (Figure 1B). The markers were used as the tracking target for the navigation system. Once the tracking tool was in the working volume, the IR camera system started to track the position of the markers in 3D, and therefore track the position of the tip of the rigid body by applying a vector to the position of the markers. The tip position data were transferred to a computer at a rate of 20–60 Hz and can be displayed in real time. When taking a surface contour in phantoms, the tip of the tracking tool was used to gently slide against the inner surface. The tracking tool tip positions over time represented the surface positions or raw contour data in 3D, based on the inner surface contour determined, given enough position samples.
Cavity Contour Reconstruction Algorithm
Cavity contour had been reconstructed by using 3D interpolation in our previous work [23]. In this traditional algorithm, the Matlab (The Mathworks, Inc, Natick, MA) function griddata was used to interpolate 3D surface position data. The 3D surface position data were interpolated to have uniform grid in the x-y plane. However, this algorithm had to divide the cavity surface into two portions to avoid interpolation ambiguity, which made it difficult to perform consistent light fluence calculations and to display the results. Furthermore, in cases where the tracking system recorded data points in the interior of the cavity, it was difficult for this algorithm to distinguish them from the real surface data, which introduced significant error in the surface contour reconstruction. Because of these intrinsic disadvantages, the traditional algorithm was never successfully implemented for clinical situations.
The novel surface contour reconstruction algorithm is summarized in Figure 2A, and is implemented using Matlab. When the representative cavity surface positions or raw contour data were taken in 3D, the coordinates of the center of mass were determined first and set as origin.
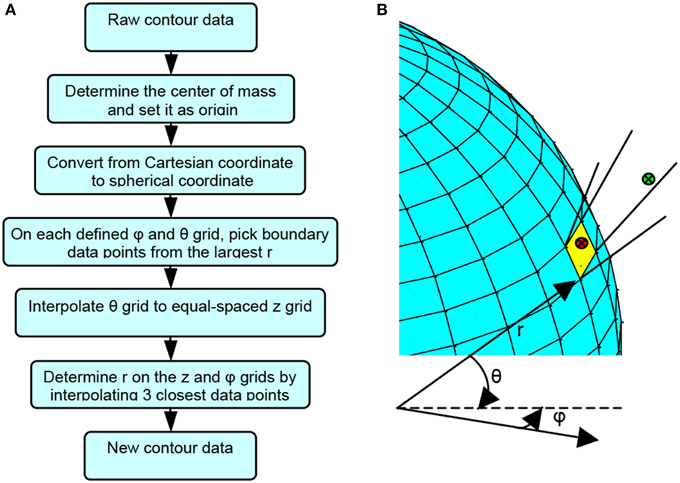
Figure 2. Surface contour reconstruction algorithm demonstration. (A) Flow chart for the novel cavity contour reconstruction algorithm. (B) Schematic diagram illustrating the cavity contour reconstruction algorithm.
All the contour position data were converted from Cartesian coordinates to spherical coordinates, as shown in Equation (1),
where i = 1··· N denotes the ith data points among the N contour position data. Grids were generated on the cavity surface by equally-spaced φ and θ from the origin, as shown in Figure 2B, given the condition that the cavity surface had only one layer with no obscure appendage from all angles. A number of contour position data points may fall within the solid angle subtended by each grid element. Among these contour position data points, the one with the largest r was selected as the representative boundary data point for each grid as
where j and k denote the sequence of the φ −θ grid. For instance, the green dot, rather than the red dot, will be chosen as the representative data point for the yellow grid in Figure 2B. This procedure filtered out the false surface data points, which were caused by recording data points in the inner space of the cavity but not on the surface of the cavity, and it produced surface data in spherical coordinates. Once all the boundary data points were determined, the θ for each point was converted to z by using
so that every boundary point was expressed in a cylindrical (r,φ,z) coordinates. The purpose of this conversion is to express the final data in the cylindrical coordinates (z, φ,) so that a two-dimensional plot of fluence (see Figure 11) is presented to physician for easy visual effect. An equally spaced φ and z grid was then established. The boundary data points were interpolated to the equally spaced φ and z grid. To determine rm,n for the φn - zm grid, three points among the entire boundary data were found to be closest to φn - zm grid by the criteria of
where zmax and zmin are the maximum and minimum z among all boundary data points, respectively, and (m,n) represent the sequence of the φ - z grid, as shown in Figure 3.
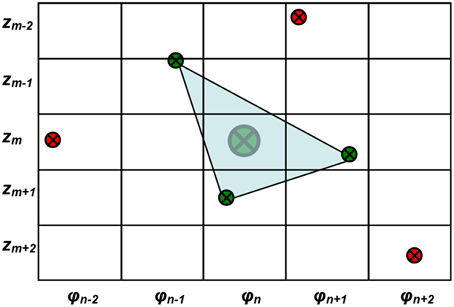
Figure 3. Demonstration of the equally spaced φ and z grid and the method of interpolation of r for each grid. The large green dot denotes the desired interpolated surface contour data for φn - zm grid. The small green dots are the three boundary data points closest to the φn - zm grid. The red dots are boundary data points that are not selected for the interpolation.
Once the three closest points (φ,z)R3 were determined, the rm,n for φn - zm grid can be determined by the distance from the origin to the intersection point of the plane determined by the three points and the line connecting the origin and the center of the grid in 3D, as
If the three points are far away from the φ - z grid being studied, the representative point is set to be NaN (not a number) first. After all the other representative points were determined, the NANs are then filled up using a function inpaint_nans.m from Matlab Central [24]. Briefly, this algorithm looks for NaNs in a matrix and attempts to interpolate smoothly to replace these elements by solving a linear equation. This method has been used for reducing artifacts in dental CT images [25]. Finally, the surface contour of the cavity was reconstructed, composing of equally spaced φ and z data points with different r describing the shape of the cavity surface. The recorded raw surface contour data (xi,yi,zi) are interpolated in an equally spaced φ - z grid with reconstructed contour data (rm,n, zm, φn). Therefore, the calculated light fluence for each point on the reconstructed cavity surface contour can be displayed in the equally spaced φ - z map as in Figure 3.
Light Fluence Calculation Algorithm
The light from the point source is the sum of the direct and the scattered lights. The direct light can be expressed as
where S is the power of the point source and r is the distance from the point source to the point of interest. In this study, the scattered light contribution is ignored given that the tissue in-vivo optical properties were unknown for patient cases and the scattered light is not present in the phantom study. Equation (6) can be directly used in the light fluence rate calculation for the phantom study where no scatter light is present.
Determination of Laser Source Position using an Optimization Algorithm
To track the laser source position, it is important to determine the shift (λm) of the laser source tip position inside a spherical bulb filled with Intralipid relative to the tip of the tracking rigid body. Figure 4 shows the treatment wand with the tracking wand attached. The laser source is located inside the white bulb filled with 0.1% Intralipid.

Figure 4. A treatment wand for pleural PDT with an optical fiber and a light diffuser. The treatment wand was attached to the tracking rigid body.
The laser source position shift can be defined in either the standard coordinate (λstd) when the tracking device is placed vertically in a “standard” position or in the “measurement coordinate” (λm) when the tracking device is actually positioned during PDT treatment (see Figure 5A). They are related by:
where Mstd is a 3 × 3 rotational matrix that defines the orientation of the tracking wand in the standard position. λstd and λm are 1 × 3 vectors. Once the laser source shift λstd is determined, the laser source position (lpos) is then related to the wand position (mpos) by
where M is the rotational matrix that defined the orientation of the tracking wand during the measurement.
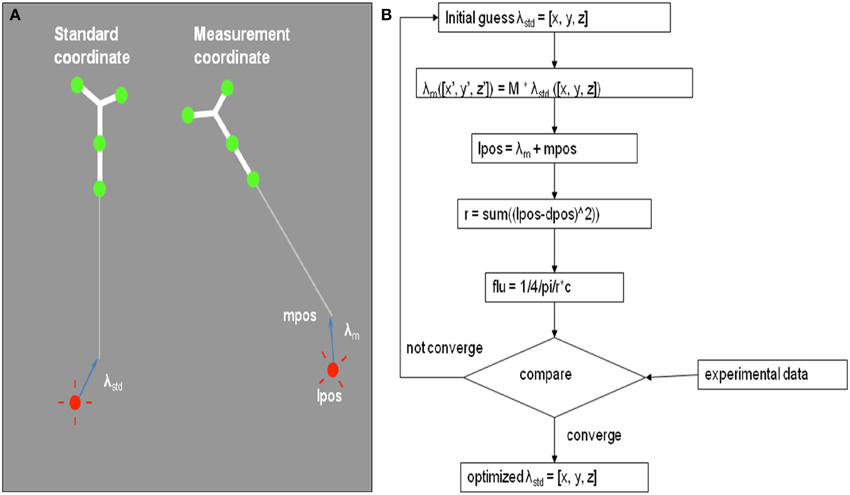
Figure 5. (A) Definition of the laser source position, lpos, and its shift relative to the tip of tracking wand tip in two coordinates: λstd in standard coordinate and λm in the measurement coordinate. (B) Schematics of the optimization algorithm to determine the shift λm of the laser source position using 5 measurements of the treatment wand relative to an isotropic detector.
By matching the light fluence rate to an isotropic detector from 6 known positions, we determine the laser source shift in the standard coordinate (λstd) using an optimization algorithm. Figure 5B shows the schematics of the optimization procedure. This process can be done within seconds and the shift lstd can be determined within an uncertainty of 1 mm.
Dual Fluence Correction Methodology
To improve the agreement between calculation and measurement, we have developed a dual correction method of light fluence rate. A diagram of the correction formalism is shown in Figure 6. This correction scheme includes a time-dependent multiplication correction factor CF(t) applied to the entire calculated light fluence rate, i.e.,
where φ is calculated spatially as a function of r as well as the time, t. The fluence is calculated as a temporal integration of φ. Since φ is calculated once every second, we can also calculate the primary light fluence as the summation of light fluence rate:ψ(r, t) = ∑iφ(r, ti). Every 30 and 150 s, chosen from trial and error, a CF is applied.
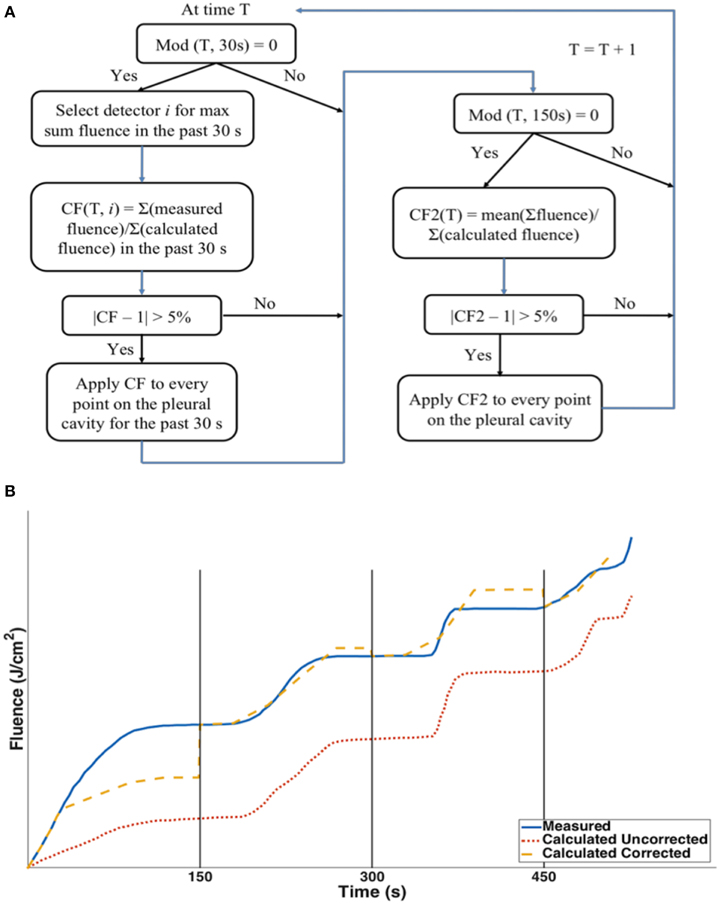
Figure 6. (A) Dual correction schematics to modify the calculated light fluence to match the measured light fluence. The dual correction includes (1) the light fluence for each 30 second interval; (2) The total cumulative light fluence at 150 s interval. Correction is applied only if the difference is more than 5%. (B) Schematics comparison between the uncorrected calculation (red dotted), corrected calculation (yellow dashed) and the measured light fluence (blue solid).
Notice that in Figure 6B at any given time point, t, the correction factor CF(t) is a spatial-independent constant applying to all data point. It is also important to know that the detector location where the CF is calculated is based on one of all detectors which has the largest sum fluence over the past 30 s. Two corrections are applied. For every 30 s, a correction (correction factor 1) is based on the ratio of the mean fluence rate between measurement and calculation over the last 30 s. However, this correction alone cannot ensure that the total light fluence at all individual detector points are corrected. Thus, a second correction is applied every 150 s (corrector factor 2), which is based on the ratio of the total measured light fluence to the total calculated fluence (which has already included prior dual corrections) at the detector location which receives the largest sum fluence over the past 30 s among all detectors. The second correction factor will ensure that the total fluence is in agreement.
Phantom Verification and Human Subject Measurements
A custom-made human-shape plastic phantom was used for determining cavity surface contours, as shown in Figure 1C. There is an opening on the abdominal area of the phantom, so that contour data from inside of the phantom can be taken by the navigation system. To validate the cavity contour surface reconstruction algorithm, CT images were taken of the same phantom to compare with the surface contour reconstruction based on the tracking system.
The human subject measurements reported in this paper are from a Phase I clinical trial at the Hospital of the University of Pennsylvania, referenced in clinicaltrials.gov as NCT01673073, “A Phase I Trial of Photodynamic Therapy with HPPH in patients with pleural malignancy.” The main purpose of the trial is to determine the maximally tolerated light fluence and drug for PDT treatment using the photosensitizer 2-[l-hexyloxyethyl]-2-devinyl pyropheophorebide-a (HPPH) and 665 nm red light in patients with pleural malignancies. The application of IR navigation system is included in the protocol and is approved by the University of Pennsylvania institutional review board (IRB). As currently written in the protocol, the result of IR navigation system is only used post treatment for data analysis and is not used to change the light delivery method for patient treatment, which is still based on the in-situ light dosimetry. Informed consents were obtained from all the patients. There are 29 patients enrolled into the HPPH pleural protocol at University of Pennsylvania. Among them 20 patients have available data for the application of IR navigation system to perform data analysis.
The operative approach has previously been described [26]. A serratus-sparing thoracotomy through the sixth rib interspace or bed of the resected seventh rib was used to access the intrathoracic cavity. First, the anterior mediastinum was approached by separating cancer from pericardium. Next, the diaphragm was dissected to separate pleura from underlying musculature. Then, remaining tumor now attached only to the lung was liberated and removed. Once all gross tumors were removed, a thoracic lymphadenectomy was performed. The surgeon then sutures in 7 isotropic detectors inside the pleural cavity [Apex, Peri (Pericardium), PM (posterior mediastinum), ACW (anterior chest wall), PCW (posterior chest wall), AS (anterior sulcus), PS (posterior sulcus)] in preparation for PDT. The goal of PDT is to achieve uniform fluence everywhere based on the measurements at the 7 detector points.
During the pleural PDT procedure, a treatment wand with an optical fiber and a light diffuser was used to deliver light for a desired light fluence (Figure 4). The treatment wand was attached to the tracking rigid body so that the PDT navigation system could track the position of the rigid body and thus the light source position during PDT treatment. The light source was embedded in the center of the light diffuser, which has a radius of ~2 cm. The light source position was recorded by the navigation system during the pleural PDT treatment.
The patient's pleural cavity contour was determined indirectly from the recorded light source positions during a pre-PDT treatment procedure. In this procedure, the surgeon moved the light diffuser over time against the patient's cavity boundary mimicking treatment of the whole pleural cavity, so that the spherical boundary of the light diffuser could be used as the representative cavity surface positions. Therefore, the raw contour data from a patient's pleural cavity were obtained by applying a 2 cm radius spherical boundary to the light source positions recorded by the navigation system.
PDT treatments were performed in phantom and in patients, and the light fluence rates calculated at the detector locations were compared.
Results
Contour Determined from the Phantom
The cavity contour algorithm was first applied to the cavity surface of the human-shape phantom. The surface positions were taken from the inner surface of the abdominal half of the phantom. The surface positions are shown in Figure 7A by the red dots, which were taken by gently sliding the tracking tool in Figure 1B against the phantom inner surface. A total number of 6238 samples were taken in 311.9 s. In the same figure, the contour determined by a previously taken CT image of the inside of the phantom is also superimposed, as shown by blue lines. The 3D registration for CT images with surface positions was implemented by a custom program in Matlab. The cavity contour algorithm was then applied to the cavity surface positions, which created the surface contour determined by the pleural PDT navigation system, as shown by green lines in Figure 7B. These results were compared with the contour obtained by the CT images in the same figure.
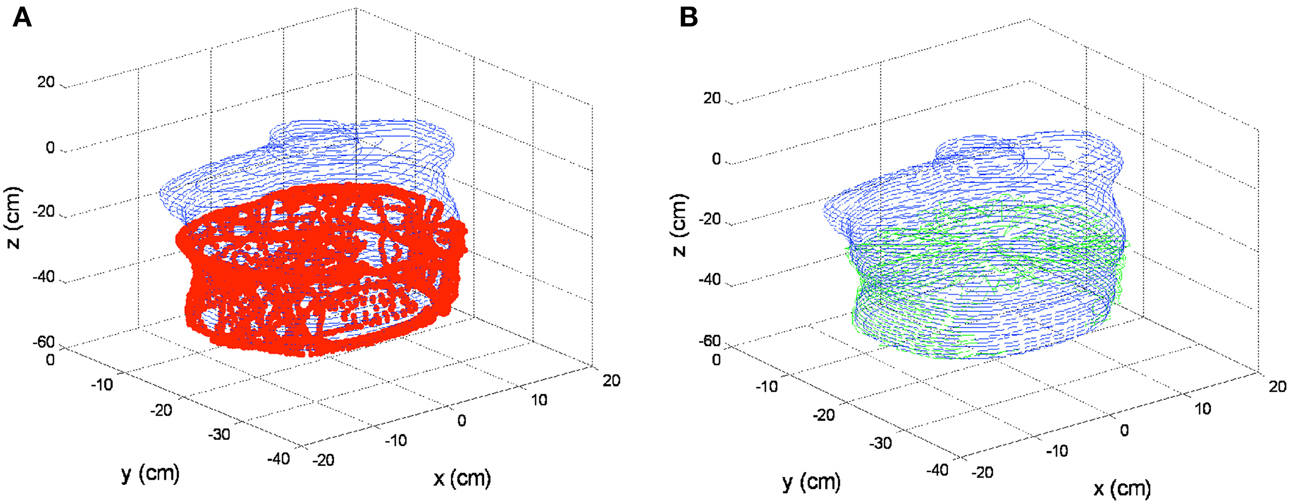
Figure 7. 3D contour results on phantom. (A) Cavity surface positions by the pleural PDT navigation system (red dots) and surface contour determined by the CT images (blue lines). (B) Surface contour determined by the pleural PDT navigation system (green lines) comparing with surface contour determined by CT images (blue lines).
Contours reconstructed by the novel method were also compared with the traditional algorithm in 2D, as shown in Figure 8. The red dots denote contours by the pleural PDT navigation system with the novel cavity contour reconstruction method, while the blue lines denote contours by CT images. Contours reconstructed by the traditional 3D interpolation algorithm are shown in Figure 8, in which the green and cyan dashed lines denote contours for two separate upper and lower parts, respectively. The 2D plots are extracted from different depths along z direction according to Figure 7 at −25.3, −31.3, −37.3, and −43.3 cm for Figures 8A–D, respectively. The reconstructed contours by the navigation system do not contain points in the lower middle region, because when collecting surface contour data, the cover of the phantom abdomen was taken off, while the cover was on during CT imaging.
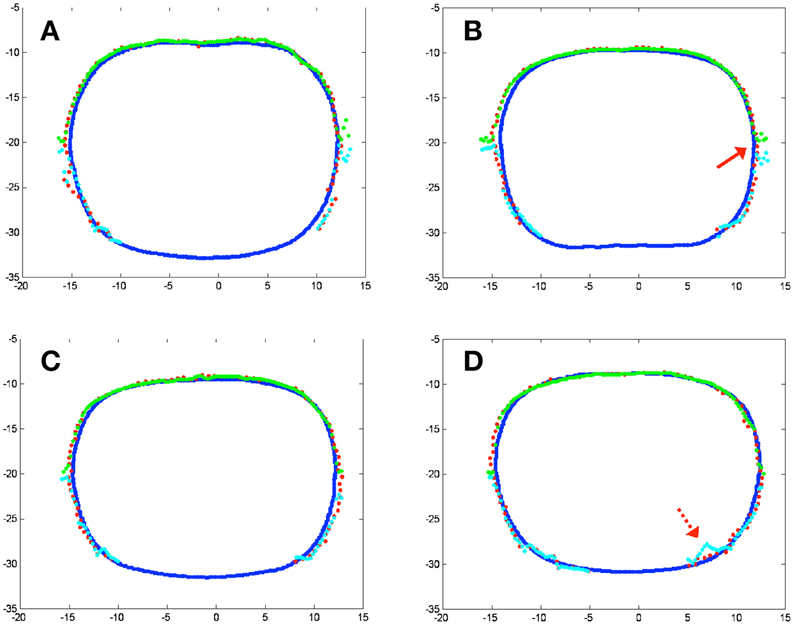
Figure 8. 2D contour results on phantom at different depth according to Figure 5. (A) z = −25.3 cm; (B) z = −31.3 cm; (C) z = −37.3 cm; (D) z = −43.3 cm. Blue lines represent contour by CT images, red dots represent reconstructed contour by the novel surface contour reconstruction algorithm, while green and cyan lines represent different parts of the reconstructed surface contour by conventional 3D interpolation method.
From Figure 8, two major improvements are noticed for the results by the novel contour reconstruction algorithm. First, the traditional 3D interpolation algorithms need to divide the cavity surface into two portions to avoid interpolation ambiguity, which may introduce reconstruction artifacts at the junction regions, as indicated by the red arrow in Figure 8B. The novel reconstruction algorithm avoids this error intrinsically. Second, the traditional 3D interpolation algorithm may introduce errors when the raw surface position data were taken accidentally inside the cavity, as indicated by the dotted red arrow in Figure 8D. The novel algorithm is improved in this regard by filtering out artifacts in the cavity in spherical coordinates.
Comparison of Light Fluence Rate in Phantom
Measurements were performed in a chest phantom (Figure 1C) with 3 detectors (1, 2, 3) placed at the right side, bottom, and left side of the phantom. The shift of the laser source position, lstd, is determined to be (x, y, z) = (2.45, 0.39, −6.45) mm. This is used to track the position of the laser source during PDT using Equation 8 as a function of time at a data acquisition rate of 20 Hz. The real-time distances between the laser source (lpos) and each of the 3 isotropic detectors are shown in the bottom row of Figure 9. The light fluence was calculated using Equation 6 for direct light only. A comparison of light fluence rate and the cumulative light fluence at the 3 detector locations are shown in Figure 9 (top and middle row). The cumulative light fluence agrees with each other reasonably well (to within 10% of each other).
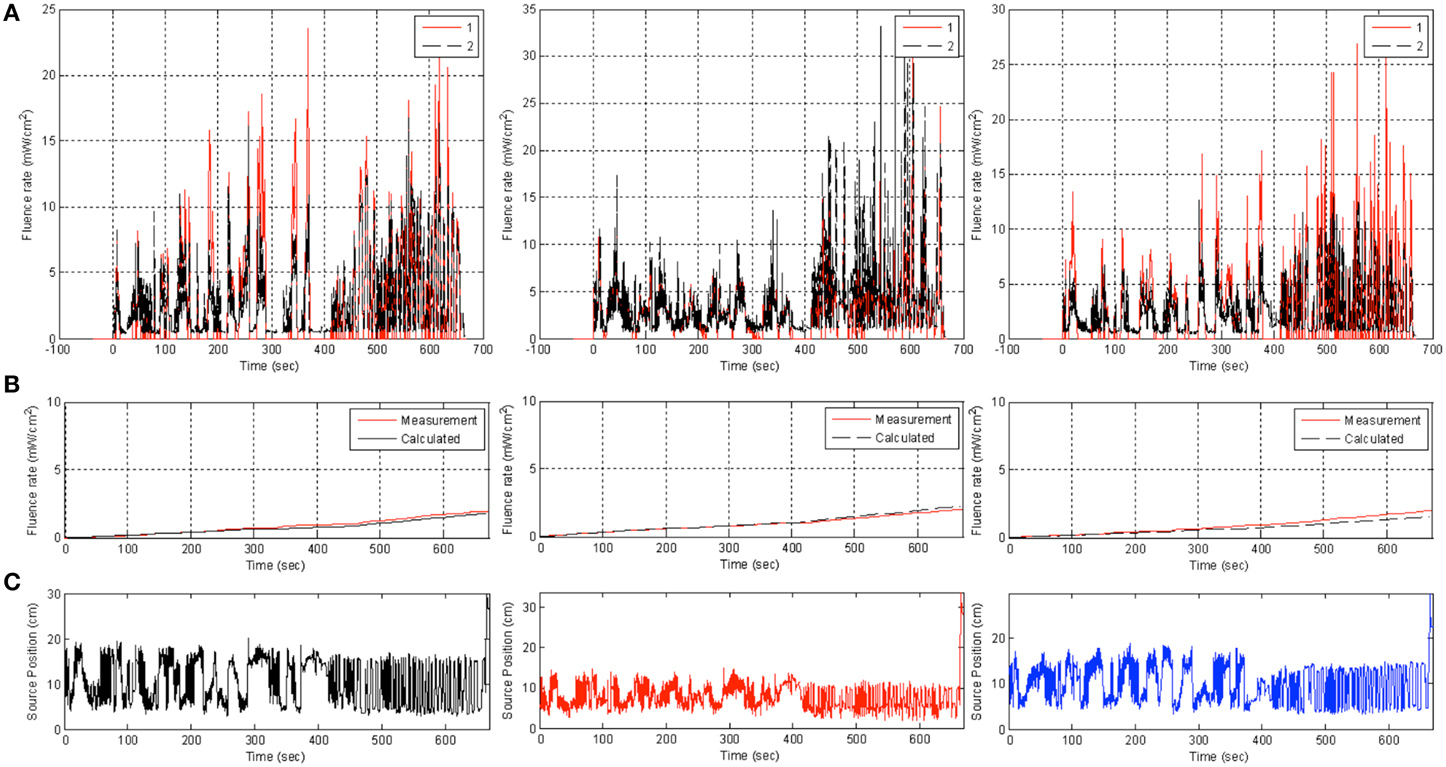
Figure 9. Comparison of measurement (red) and uncorrected calculation (black) using Equation (6) (red) in phantom at three detector locations (from left to right: 1, 2, 3) for light fluence rate (top row, A), cumulative light fluence (middle row, B), and the value of r to each detector (bottom row, C).
Comparison between Light Fluence for in Human Subjects
Figure 10A shows the comparison between measurement and calculation for a patient in 4 detector locations. Clearly, the calculated light fluence rate using Equation (6) is usually smaller than the measured light fluence rate because the scattered light is not included. However, this is not always the case (see Figure 10A for PM). The possible reasons can be partly due to the direct light being blocked by the concave surface contour which is not accounted for in the calculation and partly due to the absorption of the saline medium mixed with blood (e−μar), which is not being currently accounted for. After applying the dual correction method described previously to match the calculation with the detector readings, the agreement between measurement and calculation is greatly improved at all detector locations except for the posterior mediastinum (PM), where the calculated light fluence rate is still higher than the measured results (Figure 10B). The reason for the large discrepancy at PM can be due to either blocking of the light source by the surface contour or absorption of the water medium as discussed previously. For this clinical example, the standard deviation of the light fluence at 7 detector sites (three not shown) decreased from 42 to 29%. If one excludes the PM site, the standard deviation of the light fluence decreased from 26 to 12%. The later is acceptable for predicting light fluence rate for the current clinical protocol, which requires light fluence uncertainty to be less than 15%. The light fluence rate model (Equation 6) can predict the measured values without scattering to within 5% based on a phantom study using the same light source used for patient treatment.
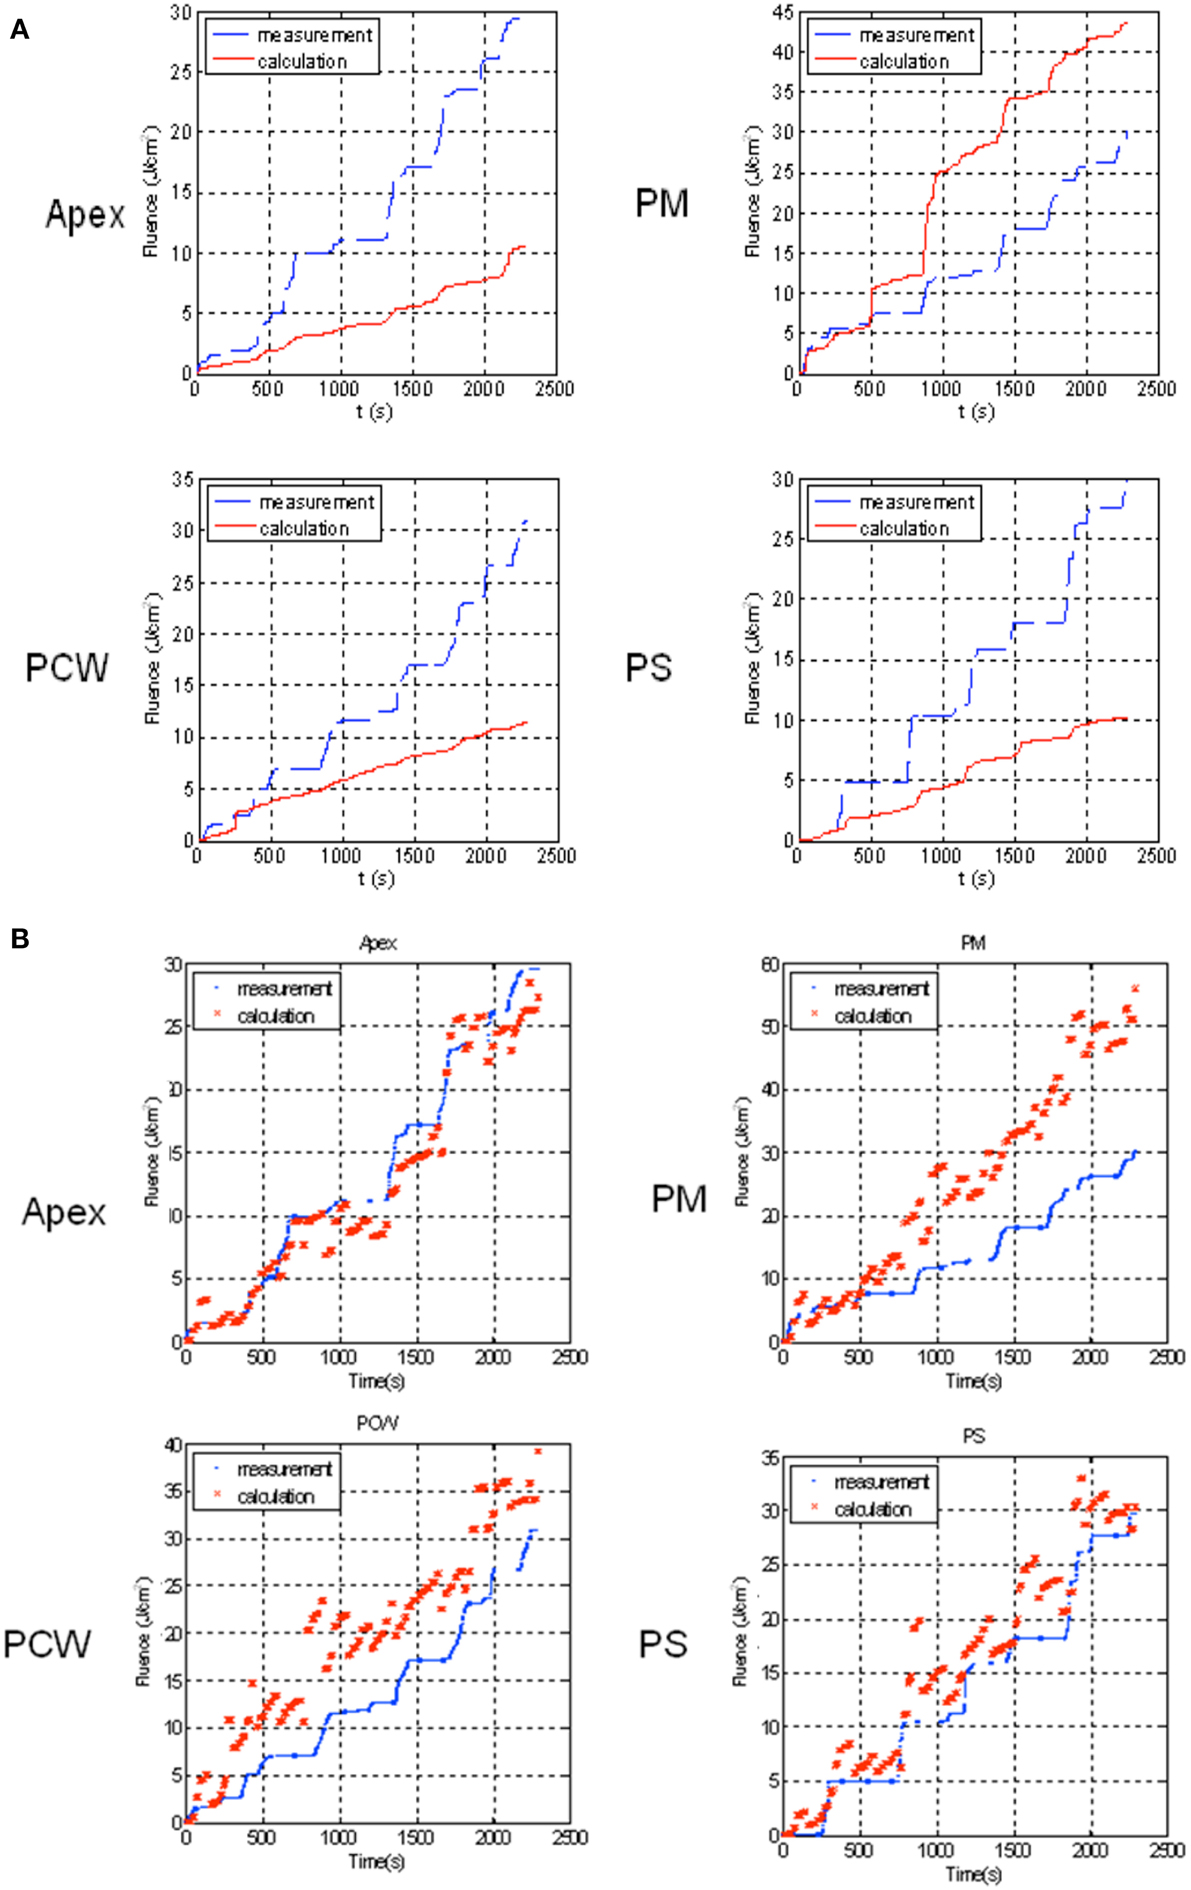
Figure 10. Comparison of measurement (blue) and uncorrected calculation using (A) direct light only (Equation 6) (red) and (B) corrected light fluence rate (Equation 9) for patient for 4 detector locations: Apex, PM (posterior mediastinum), PCW (posterior chest wall), PS (posterior sulcus).
Figure 11 shows the final calculated 2D light fluence distribution on the pleural cavity surface with dual correction factor applied. The x-axis is the unwrapped angle (0–360°) of the pleural cavity around its center of mass, and the y-axis is the superior-inferior direction along the patient body. The detector locations for the 7 isotropic detectors are also shown on the same figure. The color map represents the cumulative light fluence in J/cm2, with the total prescription of the light fluence of 30 J/cm2. The overall light fluence rate of the treatment is very uniform except for high light fluence rate near posterior mediastinum (PM). (Note that all data presented in the paper are post-surgery processed data based on measurements during PDT and is currently not real-time in nature.)
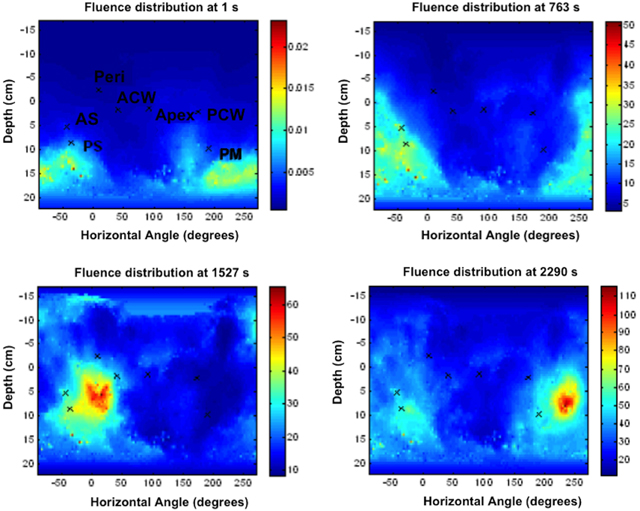
Figure 11. Calculated spatial distribution of light fluence for a patient with dual correction at various time points during the PDT treatment: t = 1 s, 763 s, 1527 s, and 2290 s. The seven isotropic detector locations were marked as: Apex, ACW (Anterior Chest Wall), AS (Anterior Sulcus), Peri (Pericardium), PCW (Posterior Chest Wall), PM (Posterior Mediastinum), and PS (Posterior Sulcus).
Discussions
Recording time is a critical parameter for the novel pleural cavity contour reconstruction method. Insufficient contour data recording may lead to inaccuracy of the reconstructed contour, while lengthy recording may prolong the PDT treatment time. The above-mentioned result on the phantom contains 6238 position samples, which consumed ~311.9 s (~5.2 min) to acquire raw contour data in order to reconstruct the phantom contour. By integrating the contour lines determined by CT images, the area of the phantom inner surface for the contour reconstruction is calculated as ~2250 cm2. Therefore, the sample per unit area is ~2.7724/cm2, and the time per unit area is ~138.6 ms/cm2. For this acquisition speed, an uncertainty of below 0.35 cm was achieved for the lower part reconstruction. To simulate speeding up acquisition rate, the original raw contour data were down sampled for 5, 10, and 20 times, as the raw surface contour data shown in Figures 12A,D,G respectively. Based on these down sampled raw contour data, the surface contours were reconstructed, as shown in Figures 12B,E,H in green lines, compared with the contours from CT images (denoted by blue lines). Errors from the contour reconstructions as functions of depths are shown in Figures 12C,F,I. It is noticed that with fewer raw contour samples, the errors increase to ~0.5 cm in the middle part of reconstruction. However, the 3D contour reconstruction still retains the majority of the phantom shape as compared with contours from CT images.
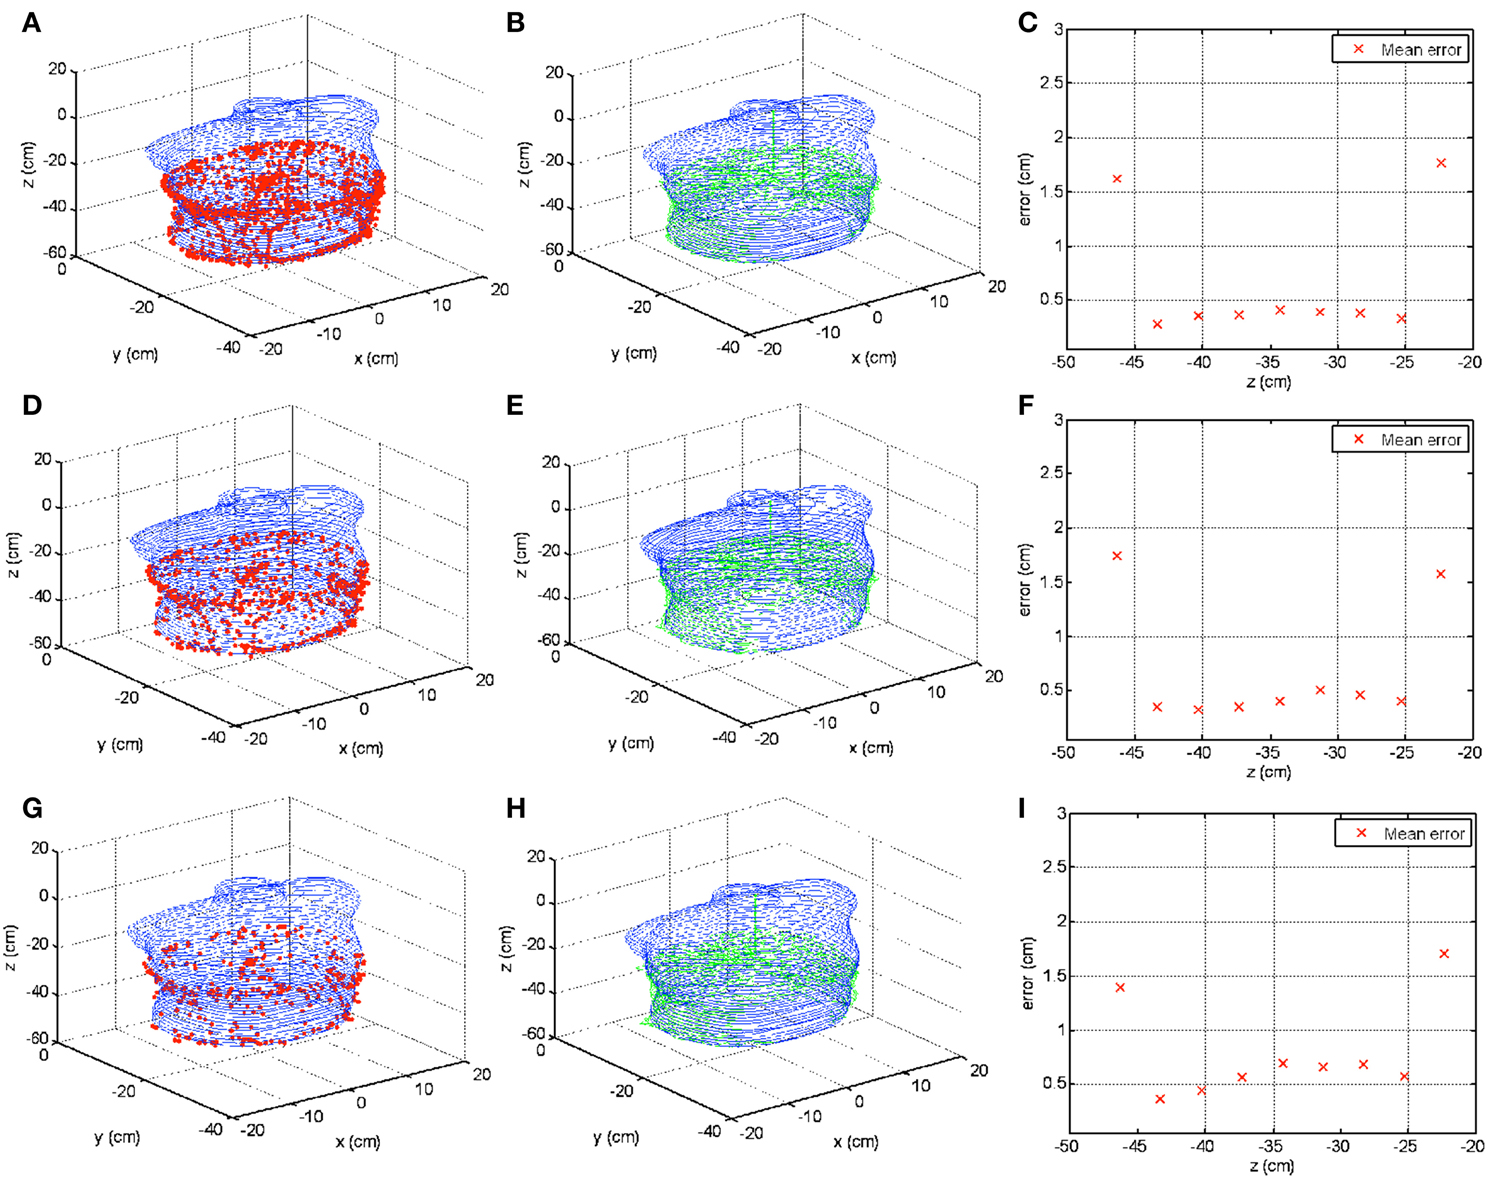
Figure 12. Surface contour reconstructions from different numbers of raw contour data samples. (A–C) Show contour reconstruction results including raw contour data, contour reconstruction, and error calculation as a function of depth from the same data in Figure 7 but with 5 times down sampling rate. (D–F) Show the results with 10 times down sample rate. (G–I) Show the results with 20 times down sample rate.
Excellent agreement was observed between calculation and measurement in the phantom using direct light only (Equation 6), which is a good indication that the laser source position and the body contour can be determined successfully.
The main source for the light fluence rate calculation errors in the patient is the simplified model for light fluence rate calculation (Equation 6), which does not account for scattered light. The errors can be reduced substantially if we apply a dual correction method. By applying this method, we can obtain agreement between measurement and calculation (defined as relative difference at all available detector points to agree to within 20% at the end of pleural PDT treatment) in 90% of the 20 HPPH pleural PDT patients examined.
Conclusions
Based on position tracking by an IR camera, novel methods to determine the pleural cavity contour shape, laser source shift, and light fluence rate distribution during PDT have been reported in this paper. An algorithm was developed to determine the outermost contour data and draw the contour from an equal-space z and equal-space φ grid. Contour results were shown to be accurate to within 2 mm between a human-shape phantom and human subjects from clinical pleural PDT procedures. Another algorithm is developed to determine the laser source shift using direct light (Equation 6). This method allows determination of the light fluence rate to be in agreement with the isotropic detectors in multiple points in the phantom study, without applying any correction factor. In the patient application, it is found to be necessary to apply a dual correction method to achieve agreement between measurement and calculation. The resulting light fluence distribution map will be useful in guiding physicians/surgeons to deliver light more uniformly during pleural PDT.
Conflict of Interest Statement
The authors declare that the research was conducted in the absence of any commercial or financial relationships that could be construed as a potential conflict of interest.
Acknowledgments
The authors thank Jeff Stanley and Dr. Andrew D. Wiles from Northern Digital Inc. for their technical support on the Polaris® IR camera. We also acknowledge technical assistance by Dr. Julia Meo and Dr. Chang Chang in the early development of the navigation system. This work is supported by grants from the National Institutes of Health (NIH P01 CA 87971 and NIH R01 CA154562).
References
1. Weder W, Opitz I, Stahel R. Multimodality strategies in malignant pleural mesothelioma. Semin Thorac Cardiovasc Surg. (2009) 21:172–6. doi: 10.1053/j.semtcvs.2009.07.004
Pubmed Abstract | Pubmed Full Text | CrossRef Full Text | Google Scholar
2. Friedberg JS, Mick R, Culligan M, Stevenson J, Fernandes A, Smith D, et al. Photodynamic therapy and the evolution of a lung-sparing surgical treatment for mesothelioma. Ann Thorac Surg. (2011) 91:1738–45. doi: 10.1016/j.athoracsur.2011.02.062
Pubmed Abstract | Pubmed Full Text | CrossRef Full Text | Google Scholar
3. Friedberg JS, Mick R, Stevenson JP, Zhu T, Busch TM, Shin D, et al. Phase II trial of pleural photodynamic therapy and surgery for patients with non-small-cell lung cancer with pleural spread. J Clin Oncol. (2004) 22:2192–201. doi: 10.1200/JCO.2004.07.097
Pubmed Abstract | Pubmed Full Text | CrossRef Full Text | Google Scholar
4. Moskal TL, Dougherty TJ, Urschel JD, Antkowiak JG, Regal AM, Driscoll DL. et al. Operation and photodynamic therapy for pleural mesothelioma: 6-year follow-up. Ann Thorac Surg. (1998) 66:1128–33. doi: 10.1016/S0003-4975(98)00799-1
Pubmed Abstract | Pubmed Full Text | CrossRef Full Text | Google Scholar
5. Patterson MS, Wilson BC, Graff R. In vivo tests of the concept of photodynamic threshold dose in normal rat liver photosensitized by aluminum chlorosulphonated phthalocyanine. Photochem Photobiol. (1990) 51:343–9.
6. Brown SB, Brown EA, Walker I. The present and future role of photodynamic therapy in cancer treatment. Lancet Oncol. (2004) 5:497–508. doi: 10.1016/S1470-2045(04)01529-3
Pubmed Abstract | Pubmed Full Text | CrossRef Full Text | Google Scholar
7. Hopper C. Photodynamic therapy: a clinical reality in the treatment of cancer. Lancet Oncol. (2000) 1:212–9. doi: 10.1016/S1470-2045(00)00166-2
Pubmed Abstract | Pubmed Full Text | CrossRef Full Text | Google Scholar
8. Dougherty TJ, Dougherty TJ, Gomer CJ, Jori G, Kessel D, Korbelik M, et al. Photodynamic therapy. J Natl Cancer Inst. (1998) 90:889–905. doi: 10.1093/jnci/90.12.889
Pubmed Abstract | Pubmed Full Text | CrossRef Full Text | Google Scholar
9. Tromberg BJ, Orenstein A, Kimel S, Barker SJ, Hyatt J, Nelson JS, et al. In vivo tumor oxygen tension measurements for the evaluation of the efficiency of photodynamic therapy. Photochem Photobiol. (1990) 52:375–85.
10. Foster TH, Murant RS, Bryant RG, Knox RS, Gibson SL, Hilf R. Oxygen consumption and diffusion effects in photodynamic therapy. Radiat Res. (1991) 126:296–303. doi: 10.2307/3577919
Pubmed Abstract | Pubmed Full Text | CrossRef Full Text | Google Scholar
11. Farrell TJ, Wilson BC, Patterson MS, Olivo MC. Comparison of the in vivo photodynamic threshold dose for photofrin, mono- and tetrasulfonated aluminum phthalocyanine using a rat liver model. Photochem Photobiol. (1998) 68:394–9. doi: 10.1111/j.1751-1097.1998.tb09698.x
Pubmed Abstract | Pubmed Full Text | CrossRef Full Text | Google Scholar
12. Henderson BW, Dougherty TJ. How does photodynamic therapy work? Photochem Photobiol. (1992) 55:145–157. doi: 10.1111/j.1751-1097.1992.tb04222.x
Pubmed Abstract | Pubmed Full Text | CrossRef Full Text | Google Scholar
13. Lee S, Isabelle ME, Gabally-Kinney KL, Pogue BW, Davis SJ. Dual-channel imaging system for singlet oxygen and photosensitizer for PDT. Biomed Opt Express (2011) 2:1233–42. doi: 10.1364/BOE.2.001233
Pubmed Abstract | Pubmed Full Text | CrossRef Full Text | Google Scholar
14. Pass H, Temeck B, Kranda K, Thomas G, Russo A, Smith P, et al. Phase III randomized trial of surgery with or without intraoperative photodynamic therapy and postoperative immunochemotherapy for malignant pleural mesothelioma. Ann Surg Oncol. (1997) 4:628–33. doi: 10.1007/BF02303746
Pubmed Abstract | Pubmed Full Text | CrossRef Full Text | Google Scholar
15. Schouwink H, Rutgers ET, van der Sijp J, Oppelaar H, van Zandwijk, N, van Veen R, et al. Intraoperative photodynamic therapy after pleuropneumonectomy in patients with malignant pleural mesothelioma: dose finding and toxicity results. Chest (2001) 120:1167–74. doi: 10.1378/chest.120.4.1167
Pubmed Abstract | Pubmed Full Text | CrossRef Full Text | Google Scholar
16. Dimofte A, Zhu TC, Finlay JC, Culligan M, Edmonds CE, Friedberg JS, et al. In vivo light dosimetry for HPPH-mediated pleural PDT. Opt Methods Tumor Treat Detect Mech Tech Photodyn Ther. XXI (2010) 7551:755115. doi: 10.1117/12.851514
17. Dimofte A, Zhu TC, Finlay JC, Culligan M, Edmonds CE, Friedberg JS, et al. In vivo light dosimetry for pleural PDT. Proc. SPIE (2009) 7164:71640A. doi: 10.1117/12.809548
Pubmed Abstract | Pubmed Full Text | CrossRef Full Text | Google Scholar
18. Zhu T, Liang X, Chang C, Sandell J, Finlay J, Dimofte A, et al. An IR navigation system for real-time treatment guidance of pleural PDT. Proc. SPIE (2011) 7886:78860L. doi: 10.1117/12.875635
19. Kalfas IH. Image-guided spinal navigation: application to spinal metastases. Neurosurg Focus (2001) 11:e5. doi: 10.3171/foc.2001.11.6.6
Pubmed Abstract | Pubmed Full Text | CrossRef Full Text | Google Scholar
20. Korb W, Engel D, Boesecke R, Eggers G, Kotrikova B, Marmulla R, et al. Development and first patient trial of a surgical robot for complex trajectory milling. Comput Aided Surg. (2003) 8:247–56. doi: 10.3109/10929080309146060
Pubmed Abstract | Pubmed Full Text | CrossRef Full Text | Google Scholar
21. Hong J, Nakashima H, Konishi K, Ieiri S, Tanoue K, Nakamuta M et al. Interventional navigation for abdominal therapy based on simultaneous use of MRI and ultrasound. Med Biol Eng Comput. (2006) 44:1127–34. doi: 10.1007/s11517-006-0133-2
Pubmed Abstract | Pubmed Full Text | CrossRef Full Text | Google Scholar
22. Herrell SD, Kwartowitz DM, Milhoua PM, Galloway RL. Toward image guided robotic surgery: system validation. J Urol. (2009) 181:783–9; discussion 789-90. doi: 10.1016/j.juro.2008.10.022
Pubmed Abstract | Pubmed Full Text | CrossRef Full Text | Google Scholar
23. Sandell J, Chang C, Finlay JC, Zhu TC. A treatment planning system for pleural PDT. Proc. SPIE (2010) 7551:75510C. doi: 10.1117/12.843044
24. D'Errico J. inpaint_nans. 2006; Available online at: http://www.mathworks.com/matlabcentral/fileexchange/4551.
25. Naranjo V, Llorens R, Alcaniz M, Verdu-Monedero R, Larrey-Ruiz J, Morales-Sanchez, J. A new 3D paradigm for metal artifact reduction in dental CT. in: Image Processing (ICIP), 2011 18th IEEE International Conference. Brussels (2011). doi: 10.1109/ICIP.2011.6116551
26. Friedberg JS, Culligan MJ, Mick R, Stevenson J, Hahn S M, Sterman D, et al. Radical pleurectomy and intraoperative photodynamic therapy for malignant pleural mesothelioma. Ann Thorac Surg. (2012) 93:1658–65. doi: 10.1016/j.athoracsur.2012.02.009
Pubmed Abstract | Pubmed Full Text | CrossRef Full Text | Google Scholar
Keywords: PDT, pleural, infrared camera, navigation system
Citation: Zhu TC, Liang X, Kim MM, Finlay JC, Dimofte A, Rodriguez C, Simone CB II, Friedberg JS and Cengel KA (2015) An IR navigation system for pleural PDT. Front. Phys. 3:9. doi: 10.3389/fphy.2015.00009
Received: 27 November 2014; Accepted: 13 February 2015;
Published online: 06 March 2015.
Edited by:
Ulas Sunar, University at Buffalo, The State University of New York, USAReviewed by:
Richard Baumgartner, Merck & Co., Inc., USAMichael Stuart Patterson, Juravinski Cancer Centre, Canada
Copyright © 2015 Zhu, Liang, Kim, Finlay, Dimofte, Rodriguez, Simone, Friedberg and Cengel. This is an open-access article distributed under the terms of the Creative Commons Attribution License (CC BY). The use, distribution or reproduction in other forums is permitted, provided the original author(s) or licensor are credited and that the original publication in this journal is cited, in accordance with accepted academic practice. No use, distribution or reproduction is permitted which does not comply with these terms.
*Correspondence: Timothy C. Zhu, Department of Radiation Oncology, School of Medicine, University of Pennsylvania, 3400 Civic Center Blvd., TRC 4W, Philadelphia, PA, USA e-mail:dHpodUBtYWlsLm1lZC51cGVubi5lZHU=
 Timothy C. Zhu
 Xing Liang
 Michele M. Kim
 Jarod C. Finlay1
 Andreea Dimofte
 Charles B. Simone II