
94% of researchers rate our articles as excellent or good
Learn more about the work of our research integrity team to safeguard the quality of each article we publish.
Find out more
ORIGINAL RESEARCH article
Front. Phys., 11 August 2014
Sec. Space Physics
Volume 2 - 2014 | https://doi.org/10.3389/fphy.2014.00047
We report magnetic field observations of the components transverse to the main field in the frequency range 1–25 Hz from times of equatorial plasma irregularity crossings. These field variations are interpreted as Alfvénic signatures accompanying intermediate-scale (150 m–4 km) plasma density depletions. Data utilized are the high-resolution CHAMP magnetic field measurements sampled at 50 Hz along the north-south satellite track. The recorded signals do not reflect the temporal variation but the spatial distribution of Alfvénic signatures. This is the first comprehensive study of Alfvénic signatures related to equatorial plasma bubbles that covers the whole solar cycle from 2000 to 2010. A detailed picture of the wave characteristics can be drawn due to the large number (almost 9000) of events considered. Some important findings are: Alfvénic features are a common feature of intermediate-scale plasma structures. The zonal and meridional magnetic components are generally well correlated suggesting skewed current sheets. The sheets have an orientation that is on average deflect by about 32° away from magnetic east toward upward or downward depending on the hemisphere. We have estimated the Poynting flux flowing into the E region. Typical values are distributed over the range 10−8–10−6 W/m2. Large Poynting fluxes are related to steep spectra of the Alfvénic signal, which imply passages through regularly varying electron density structures. No dependence of the Poynting flux level on solar activity has been found. But below a certain solar flux value (F10.7 < 100 sfu) practically no events are detected. There is a clear tendency that large Poynting flux events occur preferably at early hours after sunset (e.g., 20:00 local time). Toward later times the occurrence peak shifts successively toward lower energy levels. Finally we compare our observations with the recently published results of the high-resolution 3-D model simulations by Dao et al. [1].
During the hours after sunset frequently ionospheric plasma irregularities occur at equatorial and low latitudes. They are commonly termed equatorial spread-F or equatorial plasma bubbles (EPB). Traditionally EPBs have been treated as electrostatic phenomena. Meanwhile, however, it is accepted that magnetic signatures are a relevant part of EPB evolution (e.g., [2–6]).
There are two types of magnetic signatures associated with EPBs. One is caused by the diamagnetic effect (e.g., [5, 7]). That means, in the region of depleted plasma within the EPB the magnetic field strength is enhanced, maintaining a constant total pressure across the bubble. In addition there are fluctuations of the transverse magnetic components observed. These are interpreted as signatures of Alfvén waves (e.g., [2, 8, 9]) associated with field-aligned currents. Such Alfvén waves are transient features with a lifetime of several tens of seconds (see [1]). If they are observed over longer periods, there has to be an exciting mechanism triggering them again and again. An often quoted mechanism is a sudden disruption of zonal electric currents by the rising plasma bubble. This effect launches Alfvén waves, which are carried by field-aligned currents (FACs) flowing within the walls of the bubble (e.g., [9]). During the initial phase FACs are closed by polarization currents until the wave front reaches the conductive E region where the wave is partly reflected and partly damped by Ohmic dissipation. Since EPBs are moving eastward at a speed of about 100 m/s, the wave triggering process seems to be started again and again. Particularly active regions in terms of Alfvén waves are smaller plasma depletion structures, which seem to experience repeated triggering within the Alfvén wave travel time (between F and E region) or wave decay time.
In spite of the many indications for the electromagnetic nature of EPB there is a lack of systematic studies about EPB Alfvén wave characteristics. Recently Dao et al. [1] developed a high-resolution 3D-model of ionospheric plasma instabilities. These authors managed to resolve the full range of electric and magnetic field variations resulting from density depletion, current divergence and Alfvén wave propagation. Their model shows well the related processes that accompany the early stage of EPB evolution. It would be desirable to have their results verified by observations. Unfortunately, the code is too expensive that they are presently not able to simulate the bubble growth over an appreciably longer time.
The purpose of this study is to provide observational evidence for the characteristics of the Alfvénic signatures associated with EPBs. Basis for our investigations are the high-resolution magnetic field measurements of the CHAMP satellite. In an earlier paper we had studied the properties of intermediate-scale plasma sub-structures of EPBs [10]. This same dataset is now revisited with special attention on transverse magnetic field variations, which are interpreted as small-scale field-aligned current structures associated with Alfvén waves.
In the following section we will briefly describe the employed dataset and outline the processing approach. Section Observations presents the main findings derived from observations, and in Section Discussion we discuss the results in the context of equatorial plasma bubbles. Finally a summary of the results is given.
All the data presented here are retrieved by the CHAMP satellite, which was launched in July 2000 into a polar, low-Earth orbit at about 400 km altitude. Of particular interest are the three vector components of the geomagnetic field measured by the Flux-Gate Magnetometer (FGM) at a rate of 50 Hz.
The processing of the data follows the same approach as described by Lühr et al. [10]. Magnetic field data are first rotated into the Mean-Field-Aligned (MFA) coordinate system. In this frame the z-component (“parallel” component) is aligned with the mean ambient magnetic field, the y component (“zonal” component, pointing eastward) lies within the horizontals plane and is perpendicular to the mean field, and the x component (“meridional” component, pointing outward/upward) completes the triad. In this study the variations of the two transverse components, x and y, are of particular interest.
Since we want to investigate wave properties, the spectral features of the data are of particular interest. Fourier transform (FFT) was applied to the 50 Hz readings over an interval of 1024 values, about 20 s. From that we obtained spectra over 25 Hz with a frequency resolution of about 0.05 Hz. The FFT interval was advanced in steps of 10 s providing some overlap of processed data. In this way we generated dynamic spectra of the three magnetic field components over the whole CHAMP mission period (2000–2010). For more details of the processing approach the reader is referred to Lühr et al. [10].
We focus in this study on Alfvén wave signatures associated with plasma irregularities.
A necessary first step is thus to identify times when CHAMP is crossing EPB events. Here we take advantage of the events identified in our previous study on intermediates-scale plasma structures in EPBs [10]. All the data intervals considered in that study are revisited for Alfvén wave research. We will show later in Section Statistical Analysis the close relation between small EPB sub-structures and Alfvénic signatures. Furthermore, this approach helps to avoid contamination of our dataset by transverse magnetic signals from other phenomena like pulsations. However, known magnetic field signatures in the considered frequency range, e.g., Pc1 or Pi1, are confined to middle and high latitudes (e.g., [8]).
Figure 1 shows a prominent example of transverse magnetic signatures associated with plasma irregularities. In the bottom Figure 1F the electron density is shown sampled every 15 s. The fluctuating and depleted electron density region around the magnetic equator can clearly be seen. Collocated with them intervals of broadband magnetic signal appear in both components, zonal and meridional, Figures 1A,B, respectively. For completeness also the variations of the parallel component are shown in Figure 1C. Outside of the active region variations are much smoother and represent different kinds of signals. The broadband nature of the magnetic variations is well reflected by the dynamic spectra, Figures 1D,E. The magnetic signal in Figures 1A,B contains besides broadband also longer-period variations. These deflections are interpreted as field-aligned currents associated with EPBs, as described by Park et al. [6]. In general, periods of enhanced wave signal coincide well with depletions in plasma density.
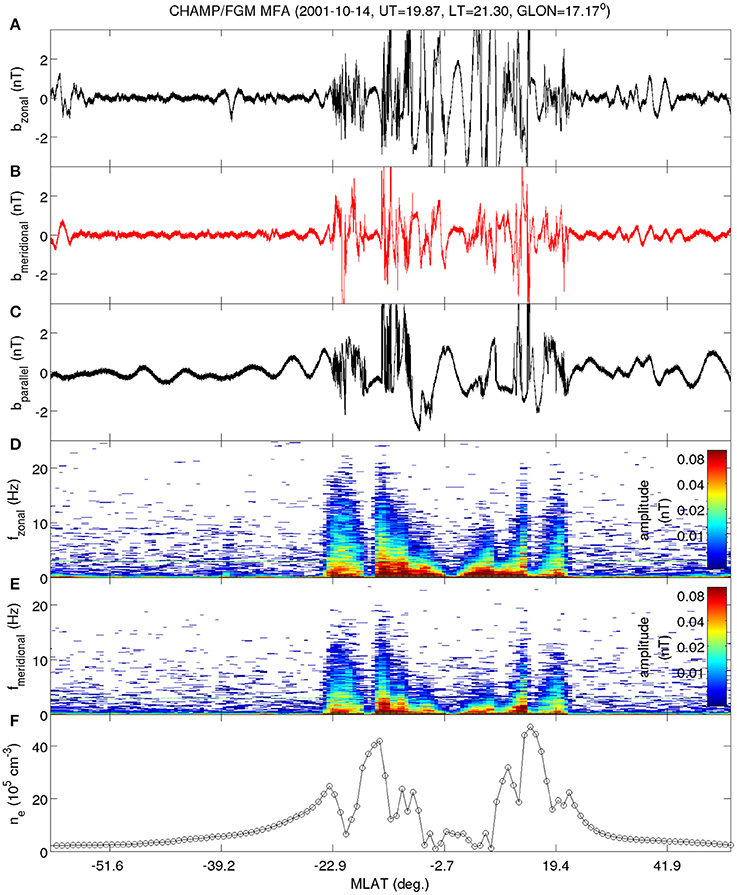
Figure 1. Example of Alfvénic wave signatures associated with equatorial plasma bubbles. The (A–C) show the observed magnetic variations of the zonal, meridional and parallel components, respectively. (D,E) contain the dynamic spectra of the two transverse components. In (F) the recorded electron density profile is shown for comparison.
The CHAMP satellite mission provided magnetic field measurements from August 2000 to September 2010. This covers the solar cycle maximum phase and the deep and prolonged solar minimum. Our earlier survey on intermediate- scale plasma structures within EPBs [10] revealed 8706 events during the first 5 years and only 144 during the second low-activity period. From this large difference we can conclude that we are dealing with solar maximum phenomena. Since we reuse the earlier event list the seasonal/longitudinal distribution and the global distribution of the considered events have already been shown by Lühr et al. [10] and will not be repeated here.
We are interested in the spectral properties of the magnetic signatures. A qualitative parameter for representing the wave activity is the Integrated Spectral Amplitude (ISA). It reflects the mean value of the spectral amplitudes within the frequency band 3–25 Hz. A detailed description of this parameter and how it is derived from the data is given in Lühr et al. [10]. Figure 2 shows for one CHAMP passage through low latitude regions the variation of the ISA parameter separately for the three magnetic field components. It is quite obvious from that figure that the magnetic activity varies synchronously in all three components. Such a close relation between small-scale plasma structures and Alfvén wave activity is also suggested by the model of Dao et al. [1]. This can be regarded as a justification for our approach to use the occurrence of intermediate-scale plasma irregularities for identifying Alfvén wave events.
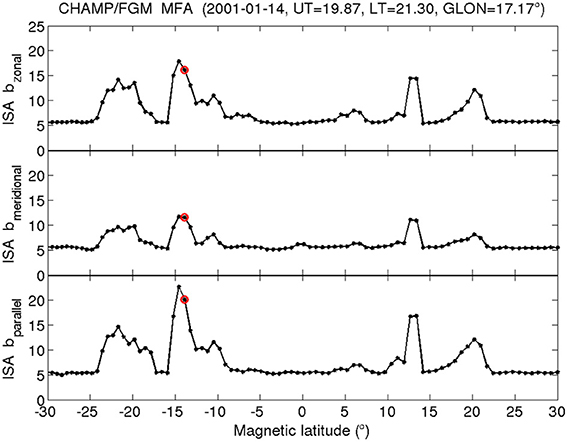
Figure 2. Latitudinal variation of integrated spectral amplitude (ISA) of the three components. The wave activity of the two transverse components is well correlated with the variations of the parallel component.
Another quantity of interest for this study is the slope at which the signal power drops with frequency. Examples of power spectra for the zonal and meridional components are shown in Figure 3. The data are obtained from a time and region of high wave activity, as marked by red dots in Figure 2. In our subsequent analysis we assume that the power spectral density, PSD, follows a power law with frequency, f.
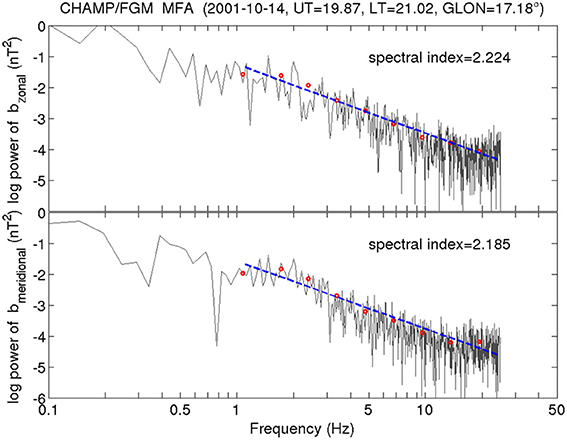
Figure 3. Spectral shapes of the two transverse components. The spectral decay can be approximated by a power law (blue dashed line). The spectral indices derived for the two components are almost the same.
where a1 is the signal power at 1 Hz and q is the spectral index. As can be seen in Figure 3, we determined the slope by fitting a linear function (dashed blue line) to bin averages in frequency space (red dots) over the frequency range 1–25 Hz. Here again we follow the approach as described in Lühr et al., [10]. From Figure 3 it is clear that the power law is a good representation of the spectral shape over the considered frequency range. This linear characteristic of the spectral slope is a common feature. For more than 95% of the events we obtain correlation coefficients larger than 0.9. The quality of the results is comparable with those shown by Lühr et al. [10] in Figure 7 for the parallel component. We have computed spectral indices for all the almost 9000 events. Values of q range from 1 to 3.
We were interested to see whether there is a relation between the zonal (y) and meridional (x) signals. Figure 4A shows that there is a good linear correlation between the spectral indices of the components x and y. Also the slope of the linear fit is close to 1. This indicates great similarity in spectral characteristics between the two transverse components for each of the events. We may even conclude that the two time series are linearly related to each other, as was shown by Park et al. [6] for individual EPB events. In that case the data can be combined in a single spectrum. It is furthermore interesting to check the amplitude relation between the two components. For that purpose we compare the wave amplitudes at 5 Hz. From Figure 4B we see that the ratio scattered a lot, but on average the zonal component, y, is somewhat larger. When taking the slope of the regression line an average angle of 32° results, by which the Alfvén wave front is deflected away from magnetic east toward upward or downward depending on the hemisphere. The obtained angle agrees well with the average polarization angle of about 128°, as reported by Park et al. [6] for FACs in EPBs, when considering a 90° ambiguity due to missing sign information of our 5 Hz amplitudes. For completeness Figure 4C presents the correlation between the spectral indices of the total field (or electron density) variations and the zonal component. Also here a linear relation is revealed, although not as good as between the two transverse components. Implications resulting from the spectral indices will be discussed in the next section.
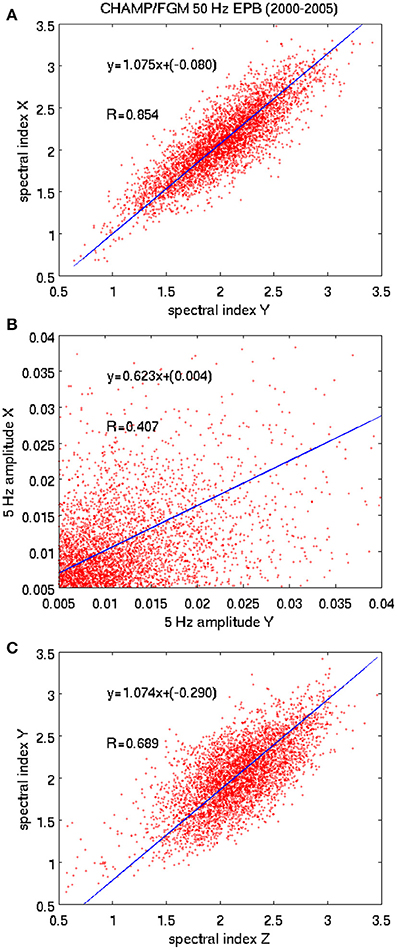
Figure 4. Spectral properties of the three magnetic field components. (A) The two transverse components have almost the same spectral slopes for all events (high correlation and linear slope close to 1); (B) The amplitude ratio between the zonal and meridional component is varying over a wide range; (C) There exists an appreciable correlation between the spectral indices of the parallel and zonal components.
In this paper we present a follow-up study to the survey of intermediate-scale plasma sub-structures of EPBs by considering now the Alfvénic wave features associated with these events. As outlined in the previous paper [10] rapid variations of the field strength reflect passages through small plasma density irregularities. From the signal spectra we can deduce the scale sizes of the plasma structures in meridional direction. When considering the spacecraft velocity (7.6 km/s) the frequency range 1–25 Hz converts to 0.3–7.6 km. In addition we have to take the inclination of the fluxtube (I ≈ 30°) into account at the height of CHAMP crossing. All this results in a scale range of 0.15–4 km. The same line of arguments is true for the transverse magnetic field variations. Also they are mapping the spatial distribution of field-aligned current density rather than reflecting temporal variations of the current strength. The typical Alfvén wave period (travel time between hemispheres) within an EPB is of order 10 s see [1]. This is long compared to the frequency of the signal (1–25 Hz) considered here.
From Figure 4C we know that the spectral shapes of the total field, z component, variations are similar to those of the transverse components. This gives us hints about the current configuration. Our interpretation is schematically outlined in Figure 5. If we have a local plasma depletion, then the magnetic field strength is enhanced in that region. A similar signal shape is expected for the transverse magnetic field components when we have field-aligned currents flowing within the bubble walls (i.e., the gradient in density) and a current closure below the satellite (see Figure 5). These are the kinds of signal that we observe. Since CHAMP provides the full magnetic field vector information, we can find the orientation of the FAC sheets with respect to the ambient field configuration. From the amplitude ratio of zonal to meridional component (see Figure 4B) we deduce that the sheets are deflected on average by 32° away from the eastward direction. When mapped onto the E region the polarization front is running from south-east to north-west in the northern hemisphere and from north-east to south-west in the southern. A similar angle of deflection has been deduced earlier from airglow observations for plasma bubbles [11]. This implies that the intermediate-scale plasma structures are aligned on average with the large-scale bubble structures. Also Park et al. [6] found this kind of skewing angle in their study on FAC related with EPBs.
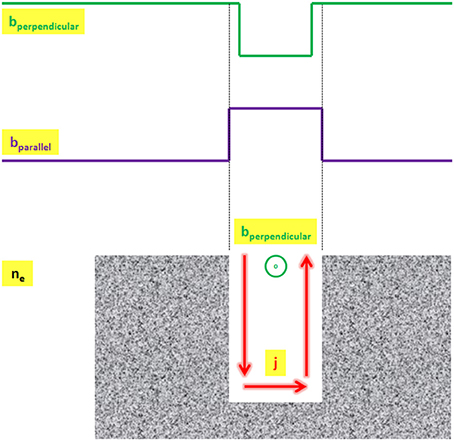
Figure 5. Schematic illustration of magnetic signatures accompanying a local plasma depletion. The diamagnetic effect causes an enhancement of the magnetic field strength (bparallel) at the location of plasma depletion. Alfvén waves carried by field-aligned currents within the bubble walls cause collocated deflections of the transverse magnetic components (bperpendicular).
It is not possible to estimate the FAC density associated with the Alfvén waves directly from the observed magnetic field variations because the FACs cannot be assumed to be stationary at these small scales. Alternatively, we want to estimate the Poynting flux that is flowing from the generator region down to the E region. The Poynting flux, S, can be expressed as
where μ0 is the permeability of free space, E is the electric field and ΔB the magnetic field caused by the currents. Since we do not have electric field observations, we make the assumption that all the observed transverse magnetic field variations are caused by Alfvén waves. Then the relation for the Alfvén wave velocity, VA, can be employed
where ne is the electron density, mi the ion mass and B0 the ambient magnetic field strength. Our assumption is supported by results of Ishii et al. [12]. Based on DE2 observations at high latitude they showed that for structures of order 30 km or smaller (4 s along track) E over B generally represents the Alfvén velocity rather than the Pedersen conductance. When solving Equation (3) for the electric field, E, and inserting it into Equation (2) we obtain for the Poynting flux
Here all the quantities are observed and for mi we assume the mass of atomic oxygen. This provides the possibility to calculate estimates of the Poynting flux for the events detected. The magnetic field variation, ΔB, represents in our case the mean signal power over the frequency range 1–25 Hz for each of the events.
This integral can be solved.
For deriving the signal power at 1 Hz, a21, we use the routinely determined amplitudes at 5 Hz of the two transverse components
This finally results in
Equation (7) is only valid for q larger than 1. We limit therefore the application to spectra with an index q > 1.1.
The Poynting flux deduced for the Alfvénic signatures is generally rather small. Typical values vary around 10−7 W/m2. Figure 6A shows the variation of the Poynting flux with the signal amplitude at 5 Hz. As can be observed, the Poynting flux increases progressively with the B-field wave amplitude. Consequently, the strong events are responsible for the main part of the energy deposit in the irregularity region.
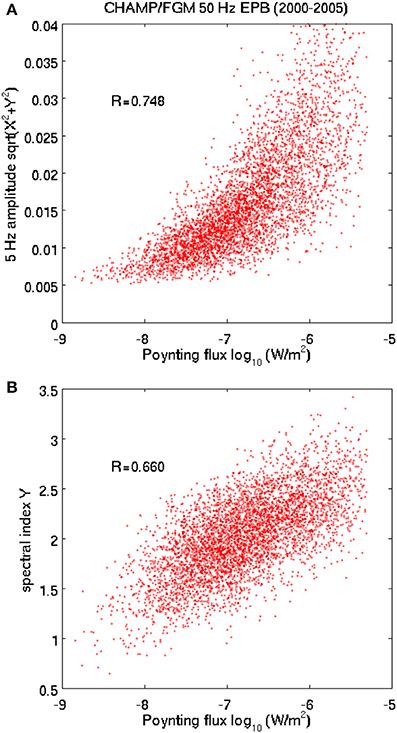
Figure 6. Characteristics of the Alfvén wave Poynting flux. (A) The Poynting flux increases monotonically with the signal amplitude, but in a highly non-linear way. (B) Relation between the spectral index of the Alfvénic signal and the log of the Poynting flux. Steep spectra are related with higher energy flux.
Another interesting relation exists between the Poynting flux and the spectral index, as shown in Figure 6B. Here we find a quasi-linear relation, implying that the Poynting flux increases exponentially with the spectral slope of the spectra. Powerful Alfvén waves seem to be related to steep spectra. That means they are associated with rather regularly varying structures.
A further issue we addressed is a possible dependence of the Poynting flux on the solar flux level. Figure 7 shows that one cannot identify any relation. The figure primarily reflects the preferred appearance of intermediate-scale events during times of high solar fluxes, but no correlation between solar and Poynting flux emerges. Alfvén waves are a common feature of small plasma irregularities, but processes other than the solar activity determine the amount of Poynting flux or wave amplitude.
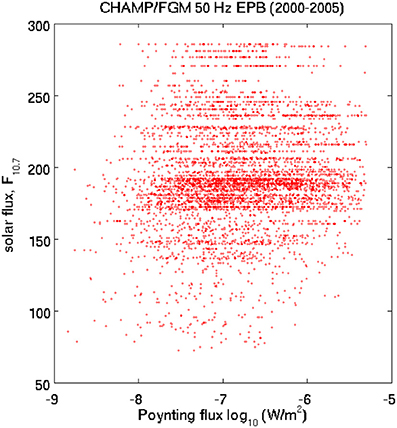
Figure 7. Relation between solar EUV flux and Poynting flux. No dependence of Poynting flux on solar activity can be found for F10.7 > 100 sfu.
A full 3-D fluid treatment of ionospheric plasma instabilities was presented recently by Dao et al. [1]. They simulated for the first time the full Alfvénic dynamics in a depleted fluxtube. The code is able to resolve the spatial and temporal scales of those phenomena. We regard our observations as suitable quantities for direct validation of their results.
The code simulates the dynamics within the EPB all along the magnetic fluxtube. From the latitude where most of our events occurred (10°–15° Mlat) we may conclude that we sample with CHAMP the processes at the lower end of the fluxtube. This corresponds probably to the Slices d and e in Dao et al. [1]. At that height range largest magnetic field variations are predicted by the model which is a fortunate coincidence of our observations. Furthermore, the model predicts, well in accordance with our cartoon in Figure 5, strongest field-aligned currents close to the EPB walls (see Figure 3 of [1]). This implies a close similarity between the magnetic signals due to the diamagnetic effect and due to the FACs, as revealed by our study. In the last paragraph of Section 3.4 of Dao et al. [1] it is stated: “Note that the current flow and associated electric fields are dominated by the density gradient on the poleward side of the bubble because….” Our observations confirm this inference quite well. In Figure 1 it can be clearly seen that the dynamic spectra have a triangular shape vs. latitude. Largest amplitude Alfvénic signals appear on the poleward side of the depleted region and amplitudes become smaller as the satellite moves equatorward. Here again we find a good confirmation of the model prediction.
After this more qualitative assessment of the model results we now try a quantitative comparison. For that purpose we choose the Poynting flux. From Figure 3 of Dao et al. [1] we read a zonal electric field of about 0.1 mV/m and a transverse magnetic field variation of ±0.4 nT. According to Equation (2) we can write
This results in a model-predicted Poynting flux, S = 6.4·10−8 W/m2. The obtained number is well within the range of our observed flux values (see Figure 8). Only a factor of 3 smaller than our most commonly observed value. This good agreement is obtained although the model results are from EPBs of 100 km size, while our observations are from intermediate-scale structure, about two orders of magnitude smaller.
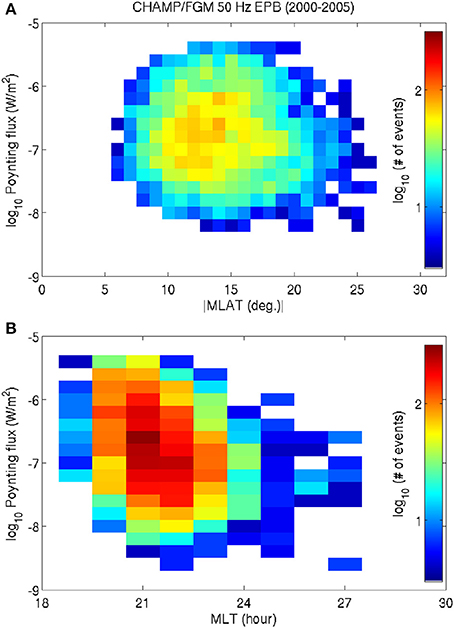
Figure 8. Distribution of Poynting flux level in space and time. (A) Occurrence frequency of Poynting flux vs. magnetic latitude. There is no dependence of flux level on latitude emerging. (B) Occurrence frequency distribution of Poynting flux vs. magnetic local time. Peak occurrence rates appear at successively lower energy levels at later hours.
The satellite observations of the Alfvénic signatures in EPBs give only short snapshots of the situations during the passage. It is thus difficult to deduce from them a time line of variations. From our statistical analysis of almost 9000 events, however, we may get some hints about the evolution. For example, the latitudinal distribution of the Poynting flux (L-shell dependence) is shown in Figure 8A. Most obvious from that figure is the clustering of events between 10 and 15° MLat. Highest occurrence rates are observed at Poynting fluxes ranging around 2·10−7 W/m2. Surprisingly, we cannot identify any significant dependence of the Poynting flux distribution on magnetic latitude. During the period considered (2000–2005) the CHAMP orbital altitude dropped from 456 to 360 km. In order to account for that change we looked also at the Poynting flux with respect to the L-value, which is independent of observation height. Again we find the same distribution of flux values for all apex heights in the range 600–900 km. Chances for encountering events with a certain level of energy flux are practically the same at all the relevant latitudes. Presently we have no immediate explanation for that surprising result.
A somewhat different picture emerges when looking at the local time distribution of the Poynting flux, shown in Figure 8B. Here we find a clear dependence. When starting at 20:00 MLT we find highest occurrence rates at 6.3·10−7 W/m2. At 21:00 MLT highest event counts are at somewhat lower energy flux (2.5·10−7 W/m2), at 22:00 MLT occurrence peaks at 1·10−7 W/m2. This systematic trend of decreasing mean Poynting flux continues from hour to hour until midnight. These observations confirm that the Alfvénic signatures are primarily a phenomenon of the early stage EPB evolution. During the early hours after sunset the field-aligned currents are particularly strong, and they get weaker thereafter. This may be a consequence of the gradually weakening of the gravity-driven current that is disrupted by the rising plasma bubbles, but also the reduced dynamics of EPBs at late night hours may have an additional effect.
For the physical explanation of many of these observed effects it would be desirable to have high-resolution 3-D model simulations of the kind presented by Dao et al. [1]. We are looking forward to the time when the code is further developed that the bubble evolution can be simulated over hours.
In this paper we have presented the characteristics of Alfvénic wave structures associated with intermediate-scale plasma density irregularities at equatorial regions. Therefore, this may be regarded as a follow-up study to Lühr et al. [10]. It is the first comprehensive observational survey of the electromagnetic properties related to small EPB structures of 4 km or less. Our findings are based on CHAMP high-resolution magnetic field measurements. The large number of events (~9000) sampled during the active years 2000–2005 allows to derive statistically significant result for several aspects of the electrodynamics related to plasma bubbles.
(1) Alfvénic wave signatures are a common feature of intermediate-scale plasma structures. Therefore, their occurrence rates share the same geographical, seasonal and local time distributions.
(2) The spectral characteristics of the zonal and meridional magnetic field components caused by the Alfvén waves are the same. This suggests that the two transverse components are correlated. From the amplitude ratio between the two components we deduce an average deflection of the associated current sheet away from magnetic east by about 32°. When mapped onto the E region the polarization front runs from south-east to north-west in the northern hemisphere. This is in agreement with the general deflection of EPBs, suggesting an alignment on average of the intermediate-scale structures with the plasma bubble orientation.
(3) Our magnetic field observations allow estimating the Poynting flux flowing downward for each event. Average flux levels range around 10−7 W/m2. Large Poynting flux values are found for Alfvénic signals with steep spectral slopes. This implies rather harmonic variations.
(4) We cannot find any dependence of the Poynting flux value on the solar flux level. Conversely, below a certain solar flux level (e.g., F10.7) hardly any event is found. Other factors than solar flux seem to be more important for controlling the energy flow.
(5) Surprisingly there is no dependence of the observed Poynting flux value on latitude or L-shell. The chances for encountering high or low energy fluxes are nearly the same for all the magnetic latitudes within the relevant range.
(6) There is a clear tendency of high Poynting flux values at early hours after sunset. During the hours after 20 LT the energy flux decreases monotonically and vanishes shortly after midnight.
We may state, Alfvénic signatures are a typical feature of intermediate-scale plasma irregularities. Here we have focused on the observational facts of the phenomena and could not give convincing explanations for all of the presented effects. Adequate numerical simulations may be needed to elucidate the details of the processes involved in plasma bubble evolution.
The authors declare that the research was conducted in the absence of any commercial or financial relationships that could be construed as a potential conflict of interest.
The CHAMP mission was sponsored by the Space Agency of the German Aerospace Center (DLR) through funds of the Federal Ministry of Economics and Technology. The work of Chao Xiong is supported by the Alexander von Humboldt Foundation through a Research Fellowship for Postdoctorial Researchers.
1. Dao E, Seyler CE, Kelley MC. Three-dimensional modeling of the electromagnetic characteristics of equatorial plasma depletions. J Geophys Res. (2013) 118:3505–14. doi: 10.1002/jgra.50216
2. Aggson TL, Burke WJ, Maynard NC, Hanson WB, Anderson PC, Slavin JA, et al. Equatorial bubbles updrifting at supersonic speed. J Geophys Res. (1992) 97:8581–90.
3. Aveiro HC, Hysell DL, Park J, Lühr H. Equatorial spread F-related currents: three-dimensional simulations and observations. Geophys Res Lett. (2011) 38:L21103. doi: 10.1029/2011GL049586
4. Bhattacharyya A, Burke WJ. A transmission line analogy for the development of equatorial ionospheric bubbles. J Geophys Res. (2000) 105:24941–50. doi: 10.1029/1999JA000458
5. Stolle C, Lühr H, Rother M, Balasis G. Magnetic signatures of equatorial spead-F, as observed by the CHAMP satellite. J Geophys Res. (2006) 111:A02304. doi: 10.1029/2005JA011184
6. Park J, Lühr H, Stolle C Rother M, Min KW, Michaelis I. The characteristics of field-aligned currents associated with equatorial plasma bubbles as observed by the CHAMP satellite. Ann Geophys (2009) 27:2685–97. doi: 10.5194/angeo-27-2685-2009
7. Lühr H, Rother M, Maus S, Mai W, Cooke D. The diamagnetic effect of the equatorial appleton anomaly: its characteristics and impact on geomagnetic field modelling. Geophys Res Lett. (2003) 30:1906. doi: 10.1029/2003GL017407
8. Park J, Lühr H, Rauberg J. Global characteristics of Pc1 magnetic pulsations during solar cycle 23 deduced from CHAMP data. Ann Geophys. (2013) 31:1507–20. doi: 10.5194/angeo-31-1507-2013
9. Pottelette R, Malingre M, Berthelier JJ, Seran E, Parrot M. Filamentary Alfvénic structures excited at the edges of equatorial plasma bubbles. Ann Geophys. (2007) 25:2159–65. doi: 10.5194/angeo-25-2159-2007
10. Lühr H, Xiong C, Park J, Rauberg J. Systematic study of intermediate-scale structures of equatorial plasma irregularities in the ionosphere based on CHAMP observations. Front Phys. (2014) 2:15. doi: 10.3389/fphy.2014.00015
11. Makela JJ, Kelley MC. Field-aligned 777.4-nm composite airglow images of equatorial plasma depletions. Geophys Res Lett. (2003) 30:1442. doi: 10.1029/2003GL017106
Keywords: equatorial ionosphere, topside ionosphere, plasma waves and instabilities, plasma irregularities, plasma depletions
Citation: Lühr H, Park J, Xiong C and Rauberg J (2014) Alfvén wave characteristics of equatorial plasma irregularities in the ionosphere derived from CHAMP observations. Front. Phys. 2:47. doi: 10.3389/fphy.2014.00047
Received: 26 June 2014; Paper pending published: 08 July 2014;
Accepted: 22 July 2014; Published online: 11 August 2014.
Edited by:
Rudolf A. Treumann, Munich University, GermanyReviewed by:
Harald Uwe Frey, University of California at Berkeley, USACopyright © 2014 Lühr, Park, Xiong and Rauberg. This is an open-access article distributed under the terms of the Creative Commons Attribution License (CC BY). The use, distribution or reproduction in other forums is permitted, provided the original author(s) or licensor are credited and that the original publication in this journal is cited, in accordance with accepted academic practice. No use, distribution or reproduction is permitted which does not comply with these terms.
*Correspondence: Hermann Lühr, Section 2.3, Earth's Magnetic Field, GFZ, Telegrafenberg, Potsdam 14473, Germany e-mail:aGx1ZWhyQGdmei1wb3RzZGFtLmRl
Disclaimer: All claims expressed in this article are solely those of the authors and do not necessarily represent those of their affiliated organizations, or those of the publisher, the editors and the reviewers. Any product that may be evaluated in this article or claim that may be made by its manufacturer is not guaranteed or endorsed by the publisher.
Research integrity at Frontiers

Learn more about the work of our research integrity team to safeguard the quality of each article we publish.