 Joshua M. Herzog
 Volker Sick
- Department of Mechanical Engineering, University of Michigan, Ann Arbor, MI, United States
Diagnostic technologies for the anterior segment of the eye, especially for hard-to-diagnose diseases such as microbial keratitis, are still lacking. Although in vivo confocal microscopy and optical coherence tomography are becoming more widely applicable to a variety of conditions, they are often prohibitively expensive, require specialized training and equipment, and are intrinsically insensitive to chemical changes. Here, ultraviolet-fluorescence imaging is proposed as a new technique to aid in investigation of the anterior segment. In this work, a novel two-color line-of-sight fluorescence imaging technique is described for imaging of the anterior segment. The technique is applied to seven ex vivo porcine eyes to illustrate the utility of the technique. The image data was used to estimate an effective fluorescence quantum yield of each eye at 370 nm. The eyes were then inoculated with bacteria to simulate microbial keratitis, a common sight-threatening infection, and the measurement was repeated. A simplified fluorescence-extinction model was developed to describe and analyze the relative intensities of the eye and biofilm fluorescence. Overall, the technique appears to have utility in clinical practice and with proper development may be suitable for detecting chemical changes in the eye, or the presence of foreign matter; however, further investigation is needed to develop the technique and analysis procedures into a quantitative diagnostic tool.
1 Introduction
The eye is well-known to reveal valuable information relating to a person’s health ranging from systemic functioning including circulation (Flammer et al., 2013) to neuropathology (London et al., 2013), autoimmune disease (Perez et al., 2013), and infectious diseases (Pirani et al., 2019). The adage the eyes are the window to the soul first recorded by the poet and playwright William Shakespeare four centuries ago has survived many tests since by physicians and scientists, and the eye is becoming increasingly recognized as an important part of a general health exam. Indeed, the American Academy of Ophthalmology (AAO) recommends older adults have comprehensive eye exams every one to 2 years and emphasizes their importance in detecting systemic issues that may otherwise go undetected, such as diabetes or blood clots (Mukamal, 2014).
In the context of optical imaging diagnostics, the eye and cornea in particular are indeed windows that are largely transmissive at optical and even near-ultraviolet (UV) wavelengths (Sliney, 2002). This feature makes them an ideal system for optical techniques including fluorescence imaging and spectroscopy. One of the oldest and most widely-used techniques in ophthalmology is slit-lamp biomicroscopy which allows an ophthalmologist to directly view the structures of the eye with moderate optical magnification and visible illumination (Martin, 2018). A variety of newer imaging modalities have also aimed to take advantage of the optical-accessibility of the eye including in vivo confocal microscopy (IVCM) (Wang et al., 2015; You and Botelho, 2016) and optical coherence tomography (OCT) and its extensions (Kostanyan et al., 2015; Hagag et al., 2017) which have been investigated for a variety of applications.
As an example, microbial keratitis (MK) is notoriously difficult to diagnose and many advanced diagnostic strategies are being developed to combat this (Alkatan and Al-Essa, 2019; Wang et al., 2019; Ting et al., 2022). MK is a condition characterized by the infiltration of microbes into the cornea, typically leading to ulceration. MK, and infectious ulceration in particular, is widely acknowledged to be a leading cause of preventable blindness in both developed and developing countries (Ung et al., 2019b), and it has been estimated that 1.5 million people worldwide will develop blindness as a result of the condition each year (Whitcher et al., 2001). These estimates are also widely acknowledged to underestimate the global impact as many cases likely go unreported and the condition leaves many patients with impaired vision that falls just short of the definition of blindness (Ung et al., 2019a). Despite these diagnostic advancements, proper and timely diagnosis remains a significant barrier to treatment. Direct diagnosis of certain conditions including MK using existing optical techniques like IVCM and OCT remains elusive partly due to a lack of specificity and resolution. Diagnosis of MK using IVCM typically uses direct imaging of pathogens which, while feasible for fungal infections with large cell sizes, renders IVCM incapable of directly detecting bacteria which have lengths on the order of the optical resolution limit near 1 μm; IVCM also cannot reliably differentiate between organisms causing the infection (Hoffman et al., 2021). In cases of MK, OCT has instead been used to measure clinical signs including infiltrate thickness that can aid in diagnosis (Konstantopoulos et al., 2008; Oliveira et al., 2020).
OCT and IVCM provide an immense amount of fully spatially-resolved data relating to the structures of the eye and are indispensable in modern diagnostic ophthalmology. However, there are still significant limitations in their use in diagnosis of a variety of conditions. Both techniques traditionally make use of reflected light which is primarily related to physical, rather than chemical changes in eye tissues. Further, OCT and IVCM are often prohibitively expensive, require specially-trained operators, and in some cases results can be operator-dependent (Vaddavalli et al., 2011). The relationship between features in IVCM or OCT images and the underlying pathology is also often unclear.
In this work, a methodology for two-color fluorescence imaging of the anterior segment of the eye, without the use of a label or tracer, is presented and analyzed. Various components of the eye, especially the cornea and lens, are known to fluoresce when excited at near-UV wavelengths due to the presence of pyridine nucleotides, flavins, and other chemicals. Fluorescence imaging using near-UV excitation is thus believed to be capable of providing a quantitative measurement of chemical changes in the eye. For example, age-related chemistry (Weale, 1996; Van Best et al., 1998) and cataract (Gakamsky et al., 2017) are both known to impact fluorescence properties of eye tissues. Further, intrinsic eye fluorescence is believed to have diagnostic potential as an indirect measure of cellular metabolism (Piston et al., 1995; Schweitzer et al., 2007) which may have utility in classifying or detecting other diseases. Finally, for the specific case of MK, fluorescence from bacteria and fungi in biofilms is believed to be sufficiently bright that it can be detected and in principal used to classify microbial species (Herzog and Sick, 2023a). To that end, a discussion of the proposed imaging technique, safety considerations, analysis methods, and sample imaging results of ex vivo deceased porcine eyes (“healthy”, and after streaking with bacteria to simulate an infection) are presented.
2 Methods
The imaging methodology has been described and analyzed previously in a general context (Herzog and Sick, 2023a). Briefly, he imaging device was constructed from two nominally-identical cameras (ThorLabs CS165MU1), a visible beamsplitter with 458-nm cutoff (Semrock FF458-Di02), and an f/2 achromatic imaging lens (Edmund Optics #65-976). The imaging bands are further restricted using a UV-cutoff filter (ThorLabs FELH0400), a 450-nm longpass filter (Green band; ThorLabs FELH0450) and a 450-nm shortpass filter (Blue band; ThorLabs FESH0450). A high-powered UV LED module (ThorLabs M365LP1) is directed onto the eye using a second dichroic beamsplitter (Semrock FF389-Di01) which provides a peak fluence of 30 mW/cm2 and is uniform over a ∼1-cm square in the object plane. The LED is synchronized with the cameras and gated using a LED driver (ThorLabs LEDD1B); the cameras and LED are gated for 50 ms (total fluence 1.5 mJ/cm2), well below established safety thresholds for human use. Due to the long illumination and exposure duration, the technique operates in a steady-state fluorescence regime. No significant photobleaching was observed over the timescale of the experiments conducted here.
The imaging lens is fixed, so focus is achieved by translating the camera system axially relative to the eye until the diffuse reflection appeared to be in focus. Once focus was achieved, a series of 10 fluorescence exposures were collected and a series of diffuse reflection images were recorded for comparison. The fluorescence images were corrected for background and for the LED irradiance profile which was measured using the fluorescence image from a target. Eye images were taken at a fixed exposure of 50 ms. A single fluorescence exposure was used for the majority of the results presented here, and is believed to be sufficient for medical imaging purposes. The simultaneous two-color, line-of-sight imaging strategy is advantageous in that it minimizes the impact of optical distortions caused by eye tissues as the two wavelength bands share a common optical path.
Seven ex vivo porcine eyes (Animal Technologies Inc., Porcine eye-globe only) were acquired to demonstrate the technique. The eyes were shipped on wet ice and imaged within 1 week of slaughter. A fluorescence emission spectrum was collected for each eye and for three bacteria smears for comparison (B. cereus, B. subtilis, and E. coli) using a spectrometer (Ocean Insight USB 2000) with fiber-coupled lens (ThorLabs F810SMA-635) and UV-cutoff filter (ThorLabs FELH0400). Spectra were collected using a 1–3 s exposure and 30 to 40 samples were averaged, corrected for background and relative spectral response using a quartz-tungsten halogen lamp (World Precision Instruments D2H), and normalized by integrated emission intensity. Spectra were smoothed with a Savitzky-Golay filter with a ∼10.5 nm kernel width. The eyes were then placed on a rotating platform at the object plane of the imaging system, and imaged with varying incidence angle. A series of 10 images was acquired at each orientation. Images were averaged and background subtracted before analysis. Imaging measurements were repeated for each eye after inoculating with ∼2 µL of B. cereus (eyes 1-6) or S. marcescens (eye 7) to simulate a bacterial infection. An illustration of the imaging setup is shown in Figure 1.
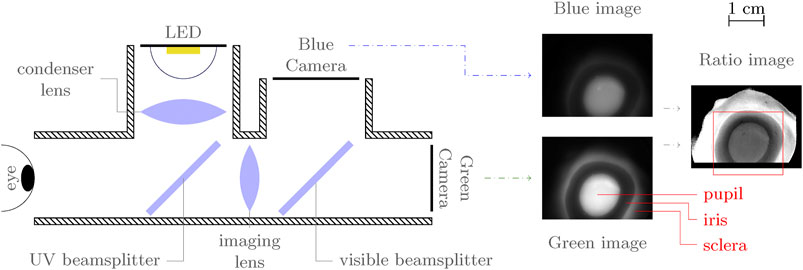
FIGURE 1. Simplified, top-view illustration of imaging setup with annotated sample image. The red box in the ratio image indicates the approximate region of interest to which images are cropped. In the fluorescence images, the pupil (lens) and sclera appear bright, while the iris is dark.
The object plane pixel size of the system is approximately 15 μm, corresponding to a best case resolution of 30 µm based on the Nyquist-Shannon sampling theorem. The required resolution depends on the condition under investigation and is not immediately clear. A recent study (Patel et al., 2018) found that in MK patients, measurements of corneal ulcer size varied on the order of 0.5 mm or more between different ophthalmologists using slit lamp calipers. The best-case resolution for the technique under investigation here provides a significant improvement over this 0.5 mm resolution target for MK; this resolution requirement can still be exceeded even with the addition of 8 × 8 binning to increase the measurement signal-to-noise ratio (SNR). The depth of field for an 8-pixel diameter circle of confusion is approximately 3.3 mm based on the selected optical parameters.
2.1 Exposure limits and analysis
Limits on exposure to near-UV radiation have been formulated by the International Commission on Non-Ionizing Radiation Protection (ICNIRP) for directed UV, optical, and near-infrared radiation (ICNIRP, 2013). For a source between 315 and 400 nm, the irradiance limit is given as a function of exposure time t as
where
2.1.1 Cumulative exposure and standard erythemal dose
Long-term effects of UV exposure are less well-known. Cumulative exposure throughout an individual’s lifetime can increase risk for several diseases (Yam and Kwok, 2014) including pterygium (Singh, 2017), ocular surface squamous neoplasia, and to a lesser extent pinguecula and climatic droplet keratopathy. Some studies have noted a potential relationship between UV exposure and uveal melanoma (Shah et al., 2005), but there is currently no concrete evidence that near-UV (340–400 nm) exposure increases risk for cancers of the eye. The standard erythemal dose (SED) (Diffey et al., 1997) is proposed here as a method to quantify cumulative exposure to near-UV light resulting from the proposed diagnostic technique. The SED is calculated as the radiant UV dose weighted by a wavelength-dependent action spectrum (the erythema action spectrum (Webb et al., 2011)) and normalized to a reference value of 10 mJ/cm2. The reference value is chosen such that a SED of unity is generally insufficient to cause erythema in most skin types and is considered a safe dose for daily exposure.
The SED for a single exposure at 50 ms and 30 mW/cm2 was calculated using manufacturer provided LED emission and filter transmission data, with a resulting value of SED⪅10–4. The calculated SED is well below the lifetime average SEDs of Americans estimated from (Godar et al., 2003) at 0.5 per day, suggesting that even daily repeated exposure to the LED source has a negligible impact on cumulative UV exposure.
2.1.2 ISO 15004.2:2007 standard
Several standards exist for ophthalmic instruments including the ISO 15004.2:2007 standard (ISO, 2007), which are derived from the ICNIRP exposure guidelines. Briefly, the ISO 15004.2:2007 standard organizes devices into two groups: Group 1 devices have no potential radiation hazard while Group 2 devices are potentially hazardous; the distinction is based on several exposure parameters related to the ICNIRP guidelines. The proposed device exceeds the emission limits for Group 1 classification and therefore would likely be classified as a Group 2 device. The most relevant UV emission parameters were calculated from component manufacturer specifications and listed in Table 1. From the table, the proposed imaging procedure and current device design fall well within the established ISO 15004.2:2007 Group 2 safety limits.
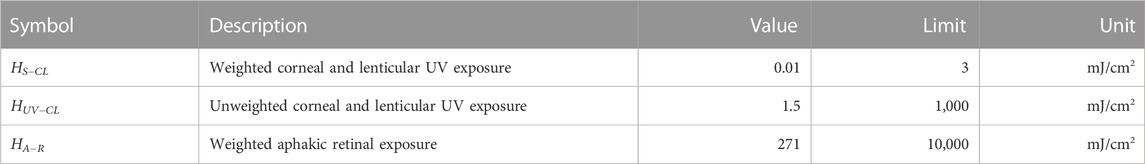
TABLE 1. Estimated safety parameters for ISO 15004.2 Group 2 classification.
2.2 Image analysis
Each image was first background-subtracted and flatfield-corrected using an irradiance profile measured from a fluorescent target taken at the same LED power and exposure. The irradiance profile was background-subtracted and averaged over 10 measurements. The background measurements were made with the LED turned off and the aperture covered. The blue band fluorescence image was registered to the reference frame of the green band image assuming the images are separated only by translation using Matlab’s built-in monomodal registration tools. The green band image was resampled in the new coordinate system using a bicubic interpolation scheme.
To provide consistent analysis across the range of observed pupil shapes, the pupil boundaries in the uninoculated eye images were estimated using an algorithm based on Daugman’s integro-differential operator (Daugman, 1993)
using an elliptical boundary C as described in detail by (Barbosa and James, 2014). In Eq. 2, Gσ(r)⋆ represents convolution with a Gaussian radial profile or a Gaussian blur applied in a radial direction from the center of the curve C. In practice, the operator defines a weighted sum over the image coordinates in which the weights are given by the radial derivative of the Gaussian function over the contour C. The image is first fit to a circle with only three independent parameters (x0, y0 and R) before relaxing constraints to include elliptical boundaries. The optimization is performed in Matlab using a custom optimization solver that implements Newton’s method in which the gradient and Hessian are calculated analytically. The Gaussian blur parameter δ is initially large but is reduced significantly throughout the optimization procedure to precisely locate the boundary. The pupil shape parameters and fluorescence intensity and ratio statistics were then calculated inside this boundary. Daugman’s operator was chosen over other pupil detection methods as its simplicity make it easy to adapt for use on fluorescence images; the elliptical boundary was further selected because it defines a convenient coordinate system for future analysis and modeling of radial fluorescence profiles.
For the inoculated eye images, the pupil boundary was estimated with an ellipse by hand since the bacteria smears severely obscure the pupil boundary. Within the elliptical region, a bright, high-ratio region appears in eyes 1-3 that is not expected to be representative of the previously analyzed bacterial films due to its increased thickness (and corresponding increased water content) resulting from the inoculation procedure, so this zone was masked for subsequent processing. The masked images were further segmented using a k-means algorithm on the ratio images with two zones followed by successive median filtering (kernel sizes 3 to 9 pixels square) to smooth the segment boundaries; the segment boundaries were then eroded with a 5-pixel diameter disk to reduce edge effects. For eyes 1 to 6, the lower ratio region was selected as the “infected” region, while the higher ratio region was selected for eye 7, consistent with previous work (Herzog and Sick, 2023a). It should be noted that while these procedures provide useful results in this study, further efforts will be needed to develop more robust image segmentation tools for clinical use.
2.3 Fluorescence quantum yield determination
An effective fluorescence quantum yield (FQY) for each eye was calculated based on the incident and measured radiation intensities. For simplicity, the quantum yield is calculated as the ratio of fluorescence photon flux to the incident UV photon flux averaged over the pupil. This FQY effectively assumes that all of the incident UV light is absorbed by the eye; the collected fluorescence signal S on the camera is then (ignoring lensing effects)
where tint is the camera integration duration, CAD is the analog-to-digital conversion gain of the sensor, Ω is the lens collection solid angle, ηopt is the optical collection efficiency, and ηQE is the camera quantum efficiency. The factor ℏω is the photon energy of the source. This approximation is believed to be appropriate as whole lenses are negligibly transmissive (T < 0.01) at wavelengths near 370 nm (Pajer et al., 2013). The quantum yield of the eye can then be estimated as
where G is the total system gain. The estimated optical properties are listed in Table 2. For simplicity, the sum of the green and blue fluorescence bands is used in the analysis and thus ignores any ultraviolet emission.
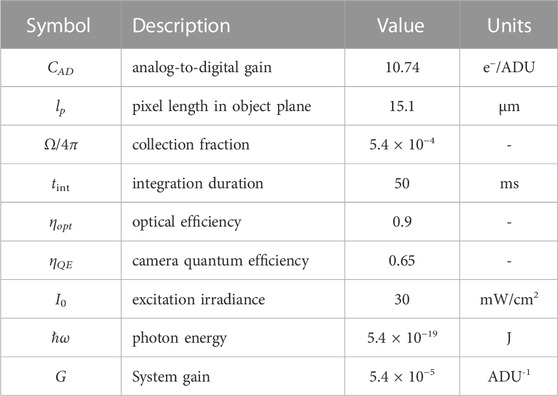
TABLE 2. Estimated radiometric parameters for eye imaging results.
3 Results
Fluorescence spectra and images were captured for each eye before inoculation, and a second set of images were captured after inoculation with bacteria. The corrected fluorescence spectra are shown in Figure 2, and representative fluorescence images of each eye are shown in Figure 3 along with the calculated luminescence intensity ratio (defined as the ratio of green band emission to blue band emission; see (Herzog and Sick, 2023a) for a detailed discussion of this measurement). The images are cropped to the pupil region which is the primary object of this investigation. A flatfield correction was applied to account for non-uniformity of the LED source, which was found to have only a small impact on the order of 2% within the pupil. Probability distribution functions (PDFs) of the measured ratio values in the inoculated eyes are also shown in Figure 3 comparing the values in the “healthy” and “infected” regions.
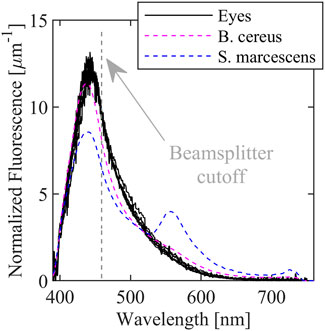
FIGURE 2. Fluorescence spectra of ex vivo porcine eyes with in vitro B. cereus, B. subtilis, and E. coli fluorescence spectra superimposed. Spectral resolution is ∼10.5 nm due to the Savitzky-Golay filter.
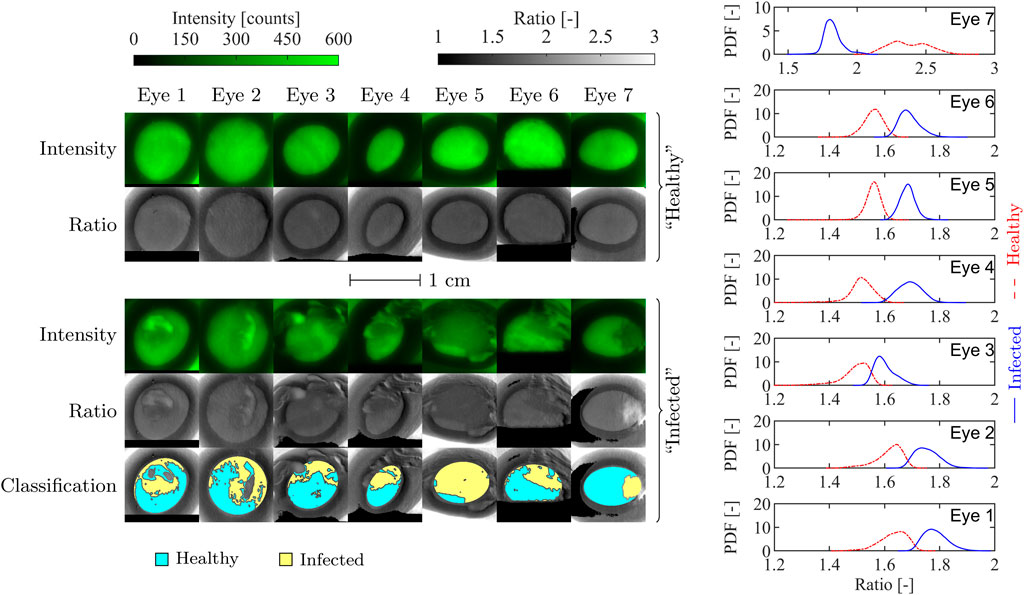
FIGURE 3. En face porcine eye fluorescence intensity and ratio images before and after inoculation (left), and ratio distribution functions of the inoculated eyes (right). The classification maps on the bottom row indicate the regions assumed to be infected (shaded yellow) and not infected (shaded blue). Eyes 1-6 were inoculated with B. cereus, while eye 7 was inoculated with S. marcescens. The ratio PDFs on the right are calculated from the segmented regions of the inoculated eyes for comparison.
The fluorescence spectra for the eyes are broad, peak near 440 nm, and extend from below 400 nm to almost 700 nm and is very similar the observed bacteria spectra that are superimposed. The similarity is unsurprising since cornea and lens tissue also contain a significant amount of pyridine nucleotides. In contrast, the three bacteria spectra contain peaks (or shoulders) near 550 nm which are likely due to the presence of flavins. The proposed diagnostic approach targets the relative intensity of the 550 nm peak compared to the 440 nm peak. Because of the similarity of the eye spectra to the bacteria spectra, it may be more difficult to detect or distinguish between microbes with primarily blue emission such as B. cereus; however, detection of pigmented bacteria or fungi with more green or red emission is more straightforward.
Several common features are immediately evident in the “healthy” eye images in Figure 3. The pupil is relatively uniform and bright, and surrounded by the darker iris region suggesting that the majority of the observed fluorescence is from the lens. Further, the ratio distribution throughout the pupil is flat despite some variation in each of the intensity images; this illustrates the benefit of the two-color approach as nonuniformity in illumination or chemical concentration does not strongly impact the ratio. Both the fluorescence intensity and ratio decrease quickly near the edge of the pupil.
The inoculated eyes, in contrast, show much more variation in both fluorescence intensity and ratio throughout and outside the pupil. In general, fluorescence emission throughout the entire image domain is weaker when bacteria are present, suggesting that extinction of UV light by bacteria is significant; this will be discussed in detail in Section 3.1 In comparison with the uninoculated images, the inoculated eye images show significant spatial variation caused by the bacterial film which indicates the location and extent of the smear. The pupil regions of the inoculated eyes were segmented based on the measured ratio (as described in Section 2) into “infected” and “uninfected” regions, denoting the presence or lack of superimposed biofilm, respectively. The segmentation and subsequently calculated ratio PDFs also shown in Figure 3 demonstrate that a significant change in ratio occurs locally due to the presence of the superimposed biofilm, and that this change can be used to detect weakly fluorescent organic matter on the cornea.
The pupil detection algorithm was used to identify the pupil boundary in the blue fluorescence band image for each of the seven “healthy” eye images. The average fluorescence intensity S, average ratio R, average pupil radius rp, pupil eccentricity e, and calculated FQY Φ are listed for each eye in Table 3, along with mean ratio and intensity values and FQY estimates for each eye. Mean ratio and intensity values for the “healthy” and “infected” regions of the inoculated eyes are also listed in Table 3, along with a typical in vitro bacteria ratio value from (Herzog and Sick, 2023a) for comparison.
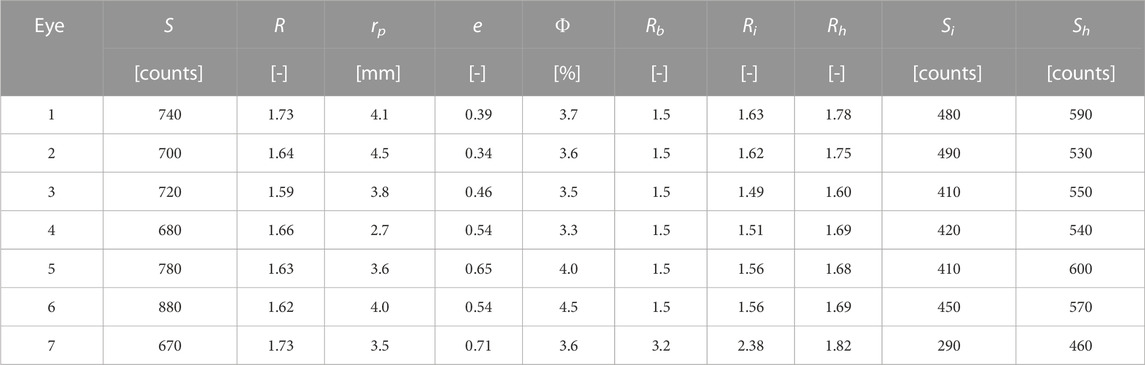
TABLE 3. Average intensity, ratio, and FQY within the pupil for each healthy eye, along with the identified average pupil radius and eccentricity calculated with the pupil boundary detection algorithm. The mean infected and healthy ratio values (Ri and Rh, respectively) and signal intensities (Si and Sh) are included for each infected eye. A typical ratio value for each species Rb from (Herzog and Sick, 2023a) is also provided for reference. Note that, for a 99% confidence interval, the uncertainty in the mean value for any signal or ratio measured here is several orders of magnitude smaller than the implied precision.
3.1 Impact of bacteria scattering
The biofilms used in this study are semi-transparent at optical wavelengths and are strongly scattering. Thus, thinner bacterial layers primarily scatter or absorb fluorescence emission from the eye. Conversely, thicker films are characterized by bright fluorescence regions indicative of strong microbial fluorescence coupled with reduced or negligible ocular fluorescence.
A simplified model was developed to estimate and describe the relative proportions of biofilm and ocular fluorescence. The simplified model assumes light propagates only along the z-axis and models attenuation, absorption, and fluorescence in the biofilm. An illustration of the model is provided in Figure 4.
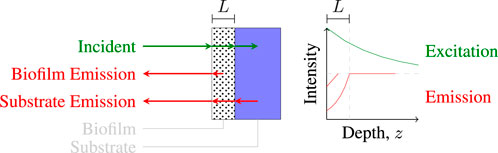
FIGURE 4. Illustration of light paths in a one-dimensional coupled fluorescence-extinction model for a material coated with a thin film of thickness L.
The incident UV intensity at any depth z in the biofilm is given by
where ke is the effective extinction coefficient, and the intensity entering the eye is given by I(L) where L is the film thickness. It is assumed that all of the light that passes through the biofilm is absorbed within the eye. Eye fluorescence is thus generated and exits the eye at z = L with intensity
where Φe is the effective fluorescence quantum yield of the eye, and the factor of one-half is added to account for the fact that half of the generated fluorescence must propagate in the +z-direction away from the sensor. Similarly, at each point z within the biofilm, fluorescence light is generated with intensity
where ka is the absorption coefficient of the biofilm, Φb is the fluorescence quantum yield of the biofilm, and a factor of one-half is again added to account for forward-propagation of fluorescence. Fluorescence emission passing through the biofilm is also attenuated such that the ocular fluorescence intensity measured at the sensor is simply
Likewise, the biofilm fluorescence intensity at the front surface is determined by integrating over the attenuated fluorescence originating from depth z, or
Thus, the measurement signal-to-background ratio (SBR) is
Defining the biofilm transmission coefficient as
the SBR can be rewritten as
The extinction coefficient ke must be altered to account for the strong forward-scattering that is characteristic of microparticles. According to the diffusion theory of radiative transfer (see Section 3 of Contini et al. (1997)), the effective scattering coefficient is modified by the scattering anisotropy g according to
where
We assume an effective eye FQY of 3% based on the data presented here, a fluorescence coefficient kf = Φbka = 0.05 mm-1 from Herzog and Sick (2023b), and a standard scattering coefficient of 1 μm-1; this corresponds to a 5 μm2 scattering cross-section and number density of 0.2 µm-3 which are order of magnitude estimates for a B. cereus biofilm. We further estimate g = 0.75 based on Mie scattering for spherical-equivalent B. cereus cells. The SBR estimated via Eq. (12) is plotted in Figure 5 as a function of transmission coefficient and film thickness L based on these parameters.
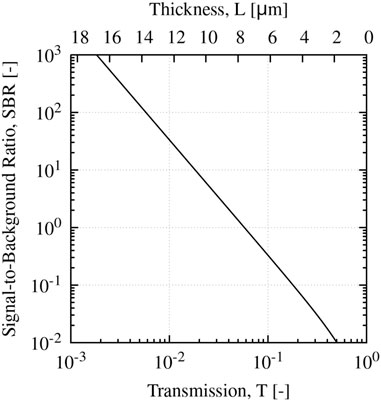
FIGURE 5. Calculated SBR for E. coli biofilm as a function of film transmission coefficient T, and film thickness L neglecting forward scattering contributions.
From the plot, a film thickness of ∼10 µm is necessary to have a moderate SBR of order 10. Thus, typical infiltrates observed in MK (on the order of hundreds of µm (Konstantopoulos et al., 2008)) are likely of sufficient thickness to image quantitatively; however, thinner regions near the periphery will likely exhibit weaker SBRs similar to the images presented here. However, it is worth noting that since microbial extinction is dominated by scattering, the Beer-Lambert law likely underestimates the biofilm transmission coefficient at moderate to high optical densities due to the strong forward scattering. In either case, further investigation and analysis is needed to identify an appropriate strategy to account for this effect.
4 Discussion
Our results show that fluorescence imaging of whole eyes using near-UV excitation is feasible for investigating the anterior segment and the lens in particular. We have shown that it is safe and feasible to perform near video-rate imaging (∼10–20 Hz) with the proposed two-color approach. The observed fluorescence appears to be generated in the lens, is primarily blue (440 nm peak), and is uniform throughout the lens in otherwise healthy eyes. The fluorescence images can provide accurate (apparent) pupil geometry measurements that are insensitive to reflection, and can be used to detect physical changes in the lens or cornea. At the same time, the ratio measurement was shown to be largely uniform in healthy eyes and is related to lens chemistry. Some variation in ratio value was observed between eyes which is likely due to chemical differences; however, it is not immediately clear which factors influence this value. We hypothesize that the proposed imaging methodology may be suitable for quantitative grading and risk of cataracts, which encompass both physical and chemical changes to the lens. Future studies will be conducted to test this hypothesis.
While the cornea itself exhibits little fluorescence compared to the lens, the technique appears to be suitable to detect the presence of fluorescent material (e.g., bacteria films or other organic matter) on the cornea and therefore in discriminating between corneal infections and abrasions. Indeed, the presence of the bacterial film in Figure 3 can be readily observed despite being optically thin and nearly transparent under ambient lighting conditions. However, there appears to be significant interference caused by the lens fluorescence. The measured ratio values in the “infected” regions of the inoculated eyes approach the expected values of the pure biofilms, but are influenced by intrinsic eye fluorescence. The measured values are believed to be a superposition of lens and biofilm fluorescence that are attenuated by scattering and absorption in the bacterial biofilm, as supported by the simple radiative transfer model presented in Section 3.1. Future studies will aim to assess the impact of non-fluorescent corneal opacities on fluorescence imaging.
For MK specifically, the imaging technique appears promising to detect cases of MK and to distinguish between infecting microbes. The majority of cases here (eyes 1 through 6) used B. cereus, which has a nearly identical fluorescence spectra to the eyes (see Figure 2), to provide a worst-case test of the technique. Other bacteria have significantly different ratio values (1.4 to ∼10 have been measured previously (Herzog and Sick, 2023a)) that can be used in principal to discriminate between species. However, to provide a more accurate and quantitative measure, it will likely be necessary to adjust the beamsplitter cutoff wavelength or add a third imaging band to better discriminate between eye fluorescence and bacteria fluorescence. Additional future work will aim to assess the technique’s utility in discriminating between bacteria samples on model eyes and identify necessary changes to make the technique clinically relevant for MK.
As an imaging technique, the proposed method is intrinsically spatially-resolved. Spatial distribution of fluorescence signatures can in principal be used to aid in diagnosis of a condition. For example, the Lens Opacities Classification Systems for cataract grading uses the size and shape of the opacity for classification and grading (Chylack et al., 1993) while congenital cataracts are often categorized by morphology (Merin, 1971). Similarly for MK, size, location, and morphology of corneal ulcers are used to classify and aid in empirical diagnosis of infection (Garg and Rao, 1999). As a spatially-resolved imaging method, future development could also take advantage of spatial distribution and morphological features in fluorescence images to aid in diagnosis. Morphological features in MK fluorescence images in particular may lend themselves well to machine learning techniques for ulcer classification that are currently under investigation using a variety of image sources (Kang et al., 2022); however, since the fluorescence images intrinsically contain chemistry information that is species-dependent, further work will be needed to adapt these automated approaches to the proposed imaging technique.
As a line-of-sight imaging technique, there are necessarily fluorescence contributions from out-of-plane sources that could negatively impact spatial resolution or image quality. An f/2 aperture was selected for the imaging lens as it provides a moderate depth of field on the order of 3 mm at a ∼100 µm theoretical spatial resolution, which is sufficient to image both the cornea and front surface of the lens simultaneously with minimal distortion. Further extensions, such as the addition of an aperture and lens for spatial filtering, may enable imaging of the lens and cornea separately, or otherwise allow for depth-resolved imaging. Investigation of spatial filtering strategies, along with the impact of alternative illumination strategies and analysis of fluorescence excitation and propagation in ocular media, is ongoing.
4.1 Translation to human eyes
The data presented here uses porcine eyes which are similar to human eyes in size and shape as a convenient demonstration of the principle of the technique. However, there are some key differences between human and porcine eyes that require further investigation to enable translation to quantitative in vivo human eye imaging. In particular, the relative concentration of NADH in the lens, a UV-active pyridine nucleotide that may contribute significantly to the observed fluorescence, is known to vary by an order of magnitude across species (Giblin and Reddy, 1980); a detailed study comparing pyridine nucleotides and other fluorescent chemicals in human and porcine eyes has not been published yet to our knowledge. Based on Giblin and Reddy (1980), we hypothesize that pyridine nucleotide concentrations in human lenses are up to 50% lower than those in porcine lenses which, assuming NADH is the dominant fluorophore in both cases, would reduce the observed fluorescence intensities in human eyes by up to a factor of two compared to the results presented here. This would be beneficial for MK as the fluorescent background from the lens would be reduced significantly.
It is further likely that concentrations of other chemicals, e.g., ascorbic acid which is known to quench fluorescence in the aqueous humour (Ringvold, 1995), are different between human and porcine lenses and could alter the measured fluorescence intensity ratio. Additional studies have shown that there are significant differences in UV transmission spectra between human and porcine lenses (Bree and Borchman, 2018) which may be indicative of differences in the UV-protection mechanism. We expect these differences could also impact fluorescence properties, in particular changing the effective quantum yield.
Finally, it is generally accepted that animal models are not sufficient to represent human lens chemistry (Borchman et al., 2004; Truscott, 2005), especially age-related chemistry and oxidation. The imaging principle as demonstrated here is expected to work well in human eyes in vivo; however, future measurements and development of the imaging technique will require studies with human eyes to address these limitations.
4.2 Extensions and comparison with alternative methods
A variety of imaging modalities based on fluorescence have been adapted and applied in imaging of biological tissues in vivo that could in principle be used to extend the proposed imaging approach. Among these are fluorescence lifetime imaging (FLIM) and multi- or hyper-spectral imaging (MSI or HSI) approaches. FLIM additionally measures the fluorescence decay rate through time-resolved imaging. Recent technological advances in high-speed imaging have made FLIM feasible for video-rate imaging (Gao et al., 2014; Ma et al., 2021). MSI and HSI similarly aim to split the fluorescence signal into multiple near-simultaneous images at different wavelength bands, and similar technological advancements have also made MSI/HSI feasible for video-rate imaging (Yang et al., 2020). However, there are significant limitations to these approaches; FLIM generally requires high-powered, pulsed laser sources that could pose a much greater safety hazard, although frequency-domain FLIM approaches could mitigate this to some extent. Further, MSI/HSI and FLIM would both require splitting the trace fluorescence signal into many additional channels, greatly reducing the measurement SNR; this could be mitigated with higher excitation energy but again at the cost of increased risk of ocular damage. Both FLIM and MSI/HSI would also require more specialized equipment that would greatly increase device cost, severely hampering its potential utility in poorly-equipped areas.
Similar imaging approaches that target NADH and FAD (a UV-active flavin common to many cells) via fluorescence, such as redox imaging, can be used to monitor cellular redox reactions (Datta et al., 2020) and therefore directly observe metabolic changes in tissue. The fluorescence intensity ratio calculated here is closely related to the optical redox ratio, and a detailed analysis of the relationship between ratio and the FAD/NADH concentration ratio (neglecting changes in chemical environment) was performed in Herzog and Sick (2023a) which found that R is a good indicator of, and increases monotonically with, the FAD/NADH concentration ratio, especially when the concentration ratio is on the order of unity or larger. The proposed diagnostic approach may therefore be suitable as an alternative to redox imaging with appropriate calibration; this would additionally suggest that the proposed technique may have utility in screening or analysis of cancer cells for which redox imaging has been investigated previously (Skala et al., 2007). It is worth noting that due to the choice of UV excitation here, penetration depths into tissues are greatly reduced compared to red or infrared two-photon excitation methods which are often employed for redox imaging; thus, the proposed strategy would likely be restricted to imaging of thin or semi-transparent tissues (e.g., the cornea), or surface cells only.
In comparison to OCT and IVCM, the proposed method is advantageous in that it is low-cost, rapid, and provides chemistry information; on the other hand, OCT and IVCM typically have much higher spatial resolution and are depth-resolved. The total equipment cost for the imaging device is less than 4,000 USD using calibrated and precision components from photonics suppliers; we expect costs could be reduced to on the order of 1,000 USD or less using rapid prototyping technologies and lower-cost image sensors and lenses without significantly impacting image quality. The total duration of the imaging procedure can be on the order of seconds, requiring only two automated exposures of 50 ms each (background and fluorescence, sequentially) after positioning the device. Due to the compact and robust nature of the setup, the proposed approach could be made portable as a handheld device and used in a variety of scenarios outside of a clinic or laboratory. In contrast, both OCT and IVCM systems can cost on the order of 100,000 USD, are not easily portable, and typically take on the order of minutes to complete the procedure.
5 Conclusion
Diagnostic methods for the anterior segment of the eye are lacking. In this work, we proposed a two-color fluorescence imaging strategy that uses UV excitation to produce a fluorescence intensity ratio measurement. This method is safe, low-cost, convenient, can be performed at near-video rate, and would provide a significant advantage over in vivo confocal microscopy (IVCM) and optical coherence tomography (OCT) as, unlike in IVCM and OCT, the fluorescence intensity ratio is intrinsically related to eye chemistry. The proposed diagnostic approach was demonstrated on seven ex vivo porcine eyes before and after inoculation with bacteria. It was found that fluorescence is generated primarily in the lens and is uniform in otherwise healthy eyes. If the cornea is intact, the imaging technique provides a convenient and accurate method to measure apparent pupil geometry. Fluorescence imaging of the eye was proposed to have utility in quantitative grading and risk assessment for cataracts. After inoculating with bacteria, it was found that the fluorescence intensity ratio measurements of “infected” regions of the eye are similar to the bacteria’s value in vitro, but may be influenced by interference from intrinsic eye fluorescence. These results suggest that the technique may be suitable to distinguish between physical and chemical changes in cornea tissue, e.g., between a corneal abrasion and infection. In the context of microbial keratitis, the technique could be adapted to distinguish between, e.g., bacterial and fungal infections. Several additional phenomena were identified for future investigation including the effect of radiative transfer in bacterial biofilms, and the impact of non-fluorescent corneal opacities on excitation and emission of lens fluorescence.
Data availability statement
The raw data supporting the conclusion of this article will be made available by the authors, without undue reservation.
Author contributions
JH: Conceptualization, Data curation, Formal Analysis, Investigation, Methodology, Project administration, Software, Validation, Visualization, Writing–original draft, Writing–review and editing. VS: Conceptualization, Funding acquisition, Project administration, Resources, Supervision, Writing–review and editing.
Funding
The author(s) declare financial support was received for the research, authorship, and/or publication of this article. We acknowledge support from the State of Michigan's Technology Transfer Talent Network (T3N) within the University Technology Acceleration and Commercialization Program through AWD006819.
Acknowledgments
We thank K. Coalmer, R. Tang, and G. Agosta for assistance in constructing and testing the imaging device and carrying out experiments. We also thank Profs. D. Burke, M. Woodward, and A. Verkade for useful discussions.
Conflict of interest
The authors declare that the research was conducted in the absence of any commercial or financial relationships that could be construed as a potential conflict of interest.
The author(s) declared that they were an editorial board member of Frontiers, at the time of submission. This had no impact on the peer review process and the final decision.
Publisher’s note
All claims expressed in this article are solely those of the authors and do not necessarily represent those of their affiliated organizations, or those of the publisher, the editors and the reviewers. Any product that may be evaluated in this article, or claim that may be made by its manufacturer, is not guaranteed or endorsed by the publisher.
References
Alkatan, H. M., and Al-Essa, R. S. (2019). Challenges in the diagnosis of microbial keratitis: a detailed review with update and general guidelines. Saudi J. Ophthalmol. 33, 268–276. doi:10.1016/j.sjopt.2019.09.002
Barbosa, M., and James, A. C. (2014). Joint iris boundary detection and fit: a real-time method for accurate pupil tracking. Biomed. Opt. express 5, 2458–2470. doi:10.1364/boe.5.002458
Borchman, D., Yappert, M. C., and Afzal, M. (2004). Lens lipids and maximum lifespan. Exp. eye Res. 79, 761–768. doi:10.1016/j.exer.2004.04.004
Bree, M., and Borchman, D. (2018). The optical properties of rat, porcine and human lenses in organ culture treated with dexamethasone. Exp. Eye Res. 170, 67–75. doi:10.1016/j.exer.2018.02.016
Chylack, L. T., Wolfe, J. K., Singer, D. M., Leske, M. C., Bullimore, M. A., Bailey, I. L., et al. (1993). The lens opacities classification system iii. Archives Ophthalmol. 111, 831–836. doi:10.1001/archopht.1993.01090060119035
Contini, D., Martelli, F., and Zaccanti, G. (1997). Photon migration through a turbid slab described by a model based on diffusion approximation. I. Theory. Appl. Opt. 36, 4587–4599. doi:10.1364/ao.36.004587
Datta, R., Heaster, T. M., Sharick, J. T., Gillette, A. A., and Skala, M. C. (2020). Fluorescence lifetime imaging microscopy: fundamentals and advances in instrumentation, analysis, and applications. J. Biomed. Opt. 25, 1–doi:10.1117/1.jbo.25.7.071203
Daugman, J. G. (1993). High confidence visual recognition of persons by a test of statistical independence. IEEE Trans. pattern analysis Mach. Intell. 15, 1148–1161. doi:10.1109/34.244676
Diffey, B., Jansen, C., Urbach, F., and Wulf, H. (1997). The standard erythema dose: a new photobiological concept. Photodermatol. Photoimmunol. Photomed. 13, 64–66. doi:10.1111/j.1600-0781.1997.tb00110.x
Flammer, J., Konieczka, K., Bruno, R. M., Virdis, A., Flammer, A. J., and Taddei, S. (2013). The eye and the heart. Eur. heart J. 34, 1270–1278. doi:10.1093/eurheartj/eht023
Gakamsky, A., Duncan, R. R., Howarth, N. M., Dhillon, B., Buttenschön, K. K., Daly, D. J., et al. (2017). Tryptophan and non-tryptophan fluorescence of the eye lens proteins provides diagnostics of cataract at the molecular level. Sci. Rep. 7, 40375–40415. doi:10.1038/srep40375
Gao, L., Liang, J., Li, C., and Wang, L. V. (2014). Single-shot compressed ultrafast photography at one hundred billion frames per second. Nature 516, 74–77. doi:10.1038/nature14005
Garg, P., and Rao, G. N. (1999). Corneal ulcer: diagnosis and management. Community eye health 12, 21–23.
Giblin, F. J., and Reddy, V. N. (1980). Pyridine nucleotides in ocular tissues as determined by the cycling assay. Exp. eye Res. 31, 601–609. doi:10.1016/s0014-4835(80)80019-4
Godar, D. E., Urbach, F., Gasparro, F. P., and van der Leun, J. C. (2003). UV doses of young adults. Photochem. Photobiol. 77, 453–457. doi:10.1562/0031-8655(2003)0770453udoya2.0.co2
Hagag, A. M., Gao, S. S., Jia, Y., and Huang, D. (2017). Optical coherence tomography angiography: technical principles and clinical applications in ophthalmology. Taiwan J. Ophthalmol. 7, 115. doi:10.4103/tjo.tjo_31_17
Herzog, J. M., and Sick, V. (2023a). Design of a line-of-sight fluorescence-based imaging diagnostic for classification of microbe species. Meas. Sci. Technol. 34, 095703. doi:10.1088/1361-6501/acd711
Herzog, J. M., and Sick, V. (2023b). Quantitative spectroscopic characterization of near-uv/visible e. coli (pyac4), b. subtilis (py79), and green bread mold fungus fluorescence for diagnostic applications. J. Fluoresc. 33, 1813–1825. doi:10.1007/s10895-023-03183-6
Hoffman, J. J., Burton, M. J., and Leck, A. (2021). Mycotic keratitis—a global threat from the filamentous fungi. J. Fungi 7, 273. doi:10.3390/jof7040273
ICNIRP (2013). ICNIRP guidelines on limits of exposure to laser radiation of wavelengths between 180 nm and 1,000 μm. Health Phys. 105, 271–295. doi:10.1097/HP.0b013e3182983fd4
ISO (2007). Ophthalmic instruments — fundamental requirements and test methods — Part 2: light hazard protection. Geneva, CH: International Organization for Standardization.
Kang, L., Ballouz, D., and Woodward, M. A. (2022). Artificial intelligence and corneal diseases. Curr. Opin. Ophthalmol. 33, 407–417. doi:10.1097/icu.0000000000000885
Konstantopoulos, A., Kuo, J., Anderson, D., and Hossain, P. (2008). Assessment of the use of anterior segment optical coherence tomography in microbial keratitis. Am. J. Ophthalmol. 146, 534–542.e2. doi:10.1016/j.ajo.2008.05.030
Kostanyan, T., Wollstein, G., and Schuman, J. S. (2015). New developments in optical coherence tomography. Curr. Opin. Ophthalmol. 26, 110–115. doi:10.1097/icu.0000000000000133
London, A., Benhar, I., and Schwartz, M. (2013). The retina as a window to the brain—from eye research to CNS disorders. Nat. Rev. Neurol. 9, 44–53. doi:10.1038/nrneurol.2012.227
Ma, Y., Lee, Y., Best-Popescu, C., and Gao, L. (2021). High-speed compressed-sensing fluorescence lifetime imaging microscopy of live cells. Proc. Natl. Acad. Sci. 118, e2004176118. doi:10.1073/pnas.2004176118
Martin, R. (2018). Cornea and anterior eye assessment with slit lamp biomicroscopy, specular microscopy, confocal microscopy, and ultrasound biomicroscopy. Indian J. Ophthalmol. 66, 195. doi:10.4103/ijo.ijo_649_17
Merin, S., and Crawford, J. S. (1971). The etiology of congenital cataracts. A survey of 386 cases. Can. J. Ophthalmol. 6, 178–182.
Mukamal, R. (2014). Your eyes could be the windows to your health. Available at: https://www.aao.org/eye-health/tips-prevention/diagnosing-systemic-diseases-eye-exams. (Accessed: 2022-July-20).
Oliveira, M. A., Rosa, A., Soares, M., Gil, J., Costa, E., Quadrado, M. J., et al. (2020). Anterior segment optical coherence tomography in the early management of microbial keratitis: a cross-sectional study. Acta Médica Port. 33, 318–325. doi:10.20344/amp.12663
Pajer, V., Tiboldi, Á., Bae, N., Li, K., Kang, S. U., Hopp, B., et al. (2013). The molecular background of the differential UV absorbance of the human lens in the 240–400 nm range. Photochem. Photobiol. 89, 856–863. doi:10.1111/php.12063
Patel, T. P., Prajna, N. V., Farisu, S., Valikodath, N. G., Niziol, L. M., Dudeja, L., et al. (2018). Novel image-based analysis for reduction of clinician-dependent variability in measurement of the corneal ulcer size. Cornea 37, 331–339. doi:10.1097/ico.0000000000001488
Perez, V., Saeed, A., Tan, Y., Urbieta, M., and Cruz-Guilloty, F. (2013). The eye: a window to the soul of the immune system. J. Autoimmun. 45, 7–14. doi:10.1016/j.jaut.2013.06.011
Pirani, V., Pelliccioni, P., De Turris, S., Rosati, A., Franceschi, A., Cesari, C., et al. (2019). The eye as a window to systemic infectious diseases: old enemies, new imaging. J. Clin. Med. 8, 1392. doi:10.3390/jcm8091392
Piston, D., Masters, B., and Webb, W. (1995). Three-dimensionally resolved NAD(P)H cellular metabolic redox imaging of the in situ cornea with two-photon excitation laser scanning microscopy. J. Microsc. 178, 20–27. doi:10.1111/j.1365-2818.1995.tb03576.x
Ringvold, A. (1995). Quenching of UV-induced fluorescence by ascorbic acid in the aqueous humour. Acta Ophthalmol. Scand. 73, 529–533. doi:10.1111/j.1600-0420.1995.tb00330.x
Schweitzer, D., Hammer, M., Jentsch, S., and Schenke, S. (2007). Interpretation of measurements of dynamic fluorescence of the eye. Adv. Phot. Count. Tech. II 6771, 73–84.
Shah, C. P., Weis, E., Lajous, M., Shields, J. A., and Shields, C. L. (2005). Intermittent and chronic ultraviolet light exposure and uveal melanoma: a meta-analysis. Ophthalmology 112, 1599–1607. doi:10.1016/j.ophtha.2005.04.020
Singh, S. K. (2017). Pterygium: epidemiology prevention and treatment. Community Eye Health 30, S5–S6.
Skala, M. C., Riching, K. M., Gendron-Fitzpatrick, A., Eickhoff, J., Eliceiri, K. W., White, J. G., et al. (2007). In vivo multiphoton microscopy of nadh and fad redox states, fluorescence lifetimes, and cellular morphology in precancerous epithelia. Proc. Natl. Acad. Sci. 104, 19494––19499. doi:10.1073/pnas.0708425104
Sliney, D. H. (2002). How light reaches the eye and its components. Int. J. Toxicol. 21, 501–509. doi:10.1080/10915810290169927
Ting, D. S., Gopal, B. P., Deshmukh, R., Seitzman, G. D., Said, D. G., and Dua, H. S. (2022). Diagnostic armamentarium of infectious keratitis: a comprehensive review. Ocular Surf. 23, 27–39. doi:10.1016/j.jtos.2021.11.003
Truscott, R. J. (2005). Age-related nuclear cataract—oxidation is the key. Exp. eye Res. 80, 709–725. doi:10.1016/j.exer.2004.12.007
Ung, L., Acharya, N. R., Agarwal, T., Alfonso, E. C., Bagga, B., Bispo, P. J., et al. (2019a). Infectious corneal ulceration: a proposal for neglected tropical disease status. Bull. World Health Organ. 97, 854–856. doi:10.2471/blt.19.232660
Ung, L., Bispo, P. J., Shanbhag, S. S., Gilmore, M. S., and Chodosh, J. (2019b). The persistent dilemma of microbial keratitis: global burden, diagnosis, and antimicrobial resistance. Surv. Ophthalmol. 64, 255–271. doi:10.1016/j.survophthal.2018.12.003
Vaddavalli, P. K., Garg, P., Sharma, S., Sangwan, V. S., Rao, G. N., and Thomas, R. (2011). Role of confocal microscopy in the diagnosis of fungal and acanthamoeba keratitis. Ophthalmology 118, 29–35. doi:10.1016/j.ophtha.2010.05.018
Van Best, J. A., Van Delft, J. L., and Keunen, J. E. (1998). Long term follow-up of lenticular autofluorescence and transmittance in healthy volunteers. Exp. eye Res. 66, 117–123. doi:10.1006/exer.1997.0417
Wang, E. F., Misra, S. L., and Patel, D. V. (2015). In vivo confocal microscopy of the human cornea in the assessment of peripheral neuropathy and systemic diseases. BioMed Res. Int. 2015, 1, 11. doi:10.1155/2015/951081
Wang, Y. E., Tepelus, T. C., Vickers, L. A., Baghdasaryan, E., Gui, W., Huang, P., et al. (2019). Role of in vivo confocal microscopy in the diagnosis of infectious keratitis. Int. Ophthalmol. 39, 2865–2874. doi:10.1007/s10792-019-01134-4
Weale, R. (1996). Age and human lenticular fluorescence. J. Biomed. Opt. 1, 251–261. doi:10.1117/12.240632
Webb, A. R., Slaper, H., Koepke, P., and Schmalwieser, A. W. (2011). Know your standard: clarifying the CIE erythema action spectrum. Photochem. Photobiol. 87, 483–486. doi:10.1111/j.1751-1097.2010.00871.x
Whitcher, J. P., Srinivasan, M., and Upadhyay, M. P. (2001). Corneal blindness: a global perspective. Bull. world health Organ. 79, 214–221.
Yam, J., and Kwok, A. K. (2014). Ultraviolet light and ocular diseases. Int. Ophthalmol. 34, 383–400. doi:10.1007/s10792-013-9791-x
Yang, C., Cao, F., Qi, D., He, Y., Ding, P., Yao, J., et al. (2020). Hyperspectrally compressed ultrafast photography. Phys. Rev. Lett. 124, 023902. doi:10.1103/physrevlett.124.023902
Keywords: anterior segment, fluorescence, imaging, microbial keratitis, diagnostics, spectroscopy, ultraviolet
Citation: Herzog JM and Sick V (2024) Fluorescence imaging for the anterior segment of the eye. Front. Photonics 4:1336541. doi: 10.3389/fphot.2023.1336541
Received: 10 November 2023; Accepted: 11 December 2023;
Published: 03 January 2024.
Edited by:
Stefan G. Stanciu, Polytechnic University of Bucharest, RomaniaReviewed by:
Yayao Ma, University of California, Los Angeles, United StatesFrancisco Avila, Universidad de Zaragoza de, Spain
Copyright © 2024 Herzog and Sick. This is an open-access article distributed under the terms of the Creative Commons Attribution License (CC BY). The use, distribution or reproduction in other forums is permitted, provided the original author(s) and the copyright owner(s) are credited and that the original publication in this journal is cited, in accordance with accepted academic practice. No use, distribution or reproduction is permitted which does not comply with these terms.
*Correspondence: Joshua M. Herzog, am1oZXJ6b2dAdW1pY2guZWR1