 A. Marone
 N. Maheshwari
 S. K. Kim
 D. R. Bajakian3
 A. H. Hielscher
- 1Department of Biomedical Engineering, Tandon School of Engineering, New York University, New York City, NY, United States
- 2Department of Radiology, Columbia University Medical Center, New York City, NY, United States
- 3Department of Surgery—Division of Vascular Surgery and Endovascular Intervention, Columbia University Irving Medical Center, New York City, NY, United States
Peripheral arterial disease (PAD) patients experience a reduction in blood supply to the extremities caused by an accumulation of plaque in their arterial system. In advanced stages of PAD, surgical intervention is often required to reopen arteries and restore limb perfusion to avoid necrosis and amputations. To determine the success of an intervention, it is necessary to confirm that reperfusion was achieved after the intervention in areas of the foot that lacked perfusion before the intervention. The standard procedure to obtain this information is to perform repeated X-ray angiography. However, this approach requires a relatively high radiation dose and the extensive use of contrast agents. To overcome these issues, our lab has developed a system that uses dynamic vascular optical spectroscopy (DVOS) to monitor perfusion in the foot in real-time before, during, and after an intervention. In the explorative study presented in this paper, we monitored ten patients undergoing revascularization surgery. We found that there is a clear change in the DVOS signal in cases when reperfusion to affected areas in the foot is established. It was also possible to assess the effects that balloon inflations and deflations and contrast agent injections had on the downstream vasculature of the patients.
1 Introduction
Peripheral arterial disease (PAD) is estimated to affect between 8 and 12 million Americans (Cohoon, et al., 2017; Virani, et al., 2021). It is caused by an accumulation of plaque in the arterial system, which reduces blood supply to the extremities (Creager and Loscalzo, 2018). In advanced stages of PAD, surgical intervention is required to reopen the arteries and restore limb perfusion to avoid necrosis and amputations. Stenting, balloon angioplasty, and atherectomy are common endovascular strategies for treating obstruction to the blood flow (Gerhard-Herman, et al., 2016). These procedures are considered minimally invasive percutaneous approaches. They are usually performed when conservative treatments, such as lifestyle changes and drug therapy, fail and before open vascular bypass surgery is required (Gerhard-Herman, et al., 2016). They have lower periprocedural complications, avoid surgical wounds, involve shorter hospital stays, and require no general anesthesia. However, these minimally invasive interventions often do not achieve long-term benefits (Ipema, et al., 2020). Furthermore, percutaneous balloon angioplasty and stenting are ineffective in treating fully closed arteries and highly calcified or fibrous blockages, due to the difficulty in passing a catheter through these occlusions. Restenosis, which is the narrowing of a section of a blocked artery that was previously opened with angioplasty, is also frequently seen among patients treated with percutaneous revascularizations. A systematic review of angioplasty and stenting for PAD patients found a success rate between 85% to 100% and a 1-year patency between 70% to 97% depending on the length and the localization of the occlusion (Jongkind, et al., 2010). Atherectomy, introduced to reduce these problems, has not proven to have a better primary patency rate (Graeme, et al., 2014). In summary, these techniques, while they rarely worsen the condition of patients, may not be effective for some patients.
To track the success of a surgical intervention, it is important to identify the areas of the foot that lack perfusion and determine if the intervention has achieved reperfusion of these areas. There are several techniques employed to determine if a patient needs an intervention and to monitor their condition after the intervention itself. The most commonly used non-invasive techniques are the assessment of the ankle-brachial index (ABI), which consists in evaluating the ratio of the blood pressure in the arm and leg (Suominen, et al., 2008), and duplex ultrasound imaging (DUI) (Martinelli, et al., 2021). Invasive techniques include magnetic resonance angiography (MRA), computed tomography angiography (CTA), and contrast angiography (CA) (Collins, et al., 2007).
All these methods have shortcomings. ABI was shown to have low sensitivity in diabetics and subjects with renal disease (Potiera, et al., 2011). Furthermore, ABI cannot be used in real-time during an intervention since it requires the measurement of the arterial pressure via a cuff occlusion that would interfere with the catheter inside the patient leg. DUI can detect vessel narrowing in the upper thigh, but its efficacy is limited when considering the distal perfusion in the foot (Mustapha, et al., 2013). During an intervention, DUI is at times used to check if a pulse can be heard; but it does not provide real-time information about the perfusion of the tissues and its application might be impeded by the presence of ulcers, edema, heavy arterial calcification, and obesity (Eiberg, et al., 2010). MRA can provide a map of the vascular tree in the leg (Collins, et al., 2007; Martinelli, et al., 2021) but relies on nephrotoxic contrast agents, which limits application in patients with renal disease. In addition, MRA cannot be used during an intervention because it necessitates that the patients are placed inside an MRI scanner. Both CTA and CA employ radiation, which limits its use in patients with renal failure or for continuous monitoring of the condition (Hingorani, et al., 2007). The most used method nevertheless is CA, consisting of the extensive use of a contrast agent and relatively high radiation dose in the areas of interest.
To address some of these shortcomings, we propose in this paper the use of dynamic vascular optical spectroscopy (DVOS). DVOS is a non-invasive technique that has shown promising results in monitoring PAD (Hielscher, et al., 2019; Marone, et al., 2019; Maheshwari, et al., 2022). DVOS measures transmitted and reflected light intensities and can monitor variations of the hemoglobin distribution in different parts of the lower leg and foot. Generally, a surgeon can only monitor a limited section of the leg (up to a couple of decimeters) at once with X-ray angiograms during an intervention. To understand the blood pooling dynamics during the surgery, a surgeon must look at multiple angiograms by rotating an X-ray imager to focus on different arteries. The whole procedure is both time-consuming and cumbersome. In the following sections, we show that it is possible to detect both the passing of a contrast agent and the opening and closing of a balloon during an angioplasty using the DVOS instrumentation. The DVOS supplies the surgeon with immediate real-time feedback on the effect of the intervention, which lets the surgeon know which angiosomes have changes in blood pooling and which angiosomes have not been reached by the contrast agent/blood. Therefore, a surgeon can immediately know if there is limited perfusion in multiple angiosomes in the lower leg while monitoring the upper leg with the X-ray system. This information is also useful for assessing if a single balloon inflation has successfully opened a clogged artery or if multiple balloon inflations are required. Therefore, DVOS could potentially help reduce intervention time and decrease the number of injections of harmful contrast agents and X-ray exposure.
2 Methods
Between 2019 and 2020, we conducted a cross-sectional, observational pilot study at the Columbia University Irving Medical Center (CUIMC) in New York City, NY, United States. Ten patients who were scheduled for revascularization surgery were considered for this study. The purpose of the study was to analyze if differences in foot perfusion can be detected in real-time during a revascularization intervention. The study complied with the Declaration of Helsinki, was approved by the Columbia University Medical Center Institutional Review Board (IRB), and informed written consent was obtained for all patients enrolled. A non-random convenience sampling method was used to enroll PAD patients.
2.1 Dynamic vascular optical spectroscopy system
For this explorative study, we developed a DVOS system to access the hemoglobin concentration in the lower leg and foot based on the absorption and reflection of light in the red and near infra-red range. Our system consists of a 160 mm × 160 mm × 86 mm operating unit that contains all the measurement electronics and four measurement probes that can be attached to the system box via rs232 connectors. Each probe contains four 5.6 mm-diameter laser diodes at wavelengths of 670, 780, 808, and 850 nm (HL6748MG, L780P010, L808P010, L850P010, Thorlabs) that are placed in a square arrangement (see Figure 1). Each laser diode has an output power of 5 mW, which is modulated at 5 KHz. In addition, each probe contains two silicon photodiodes (Hamamatsu S1337-33BR) that are located at 1.6 and 2.5 cm from the sources.
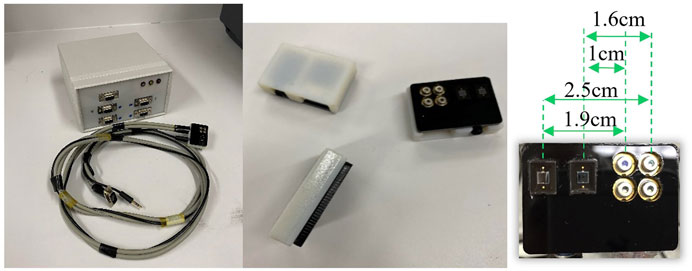
FIGURE 1. DVOS acquisition system on the left, three probe heads in the center, and a probe head on the right with the distances between the four photodiodes and the two photodetectors.
The analog signals obtained with these probes are processed by two dedicated detection boards inside the operating unit (one board per four detectors). The signal processing includes signal amplification, filtering, and conversion to digital signals with a 16-bit analogue to digital converter (ADC) (LTC 1865, Linear Technology). The detection boards feed the digital signals to a common master board that controls the overall operation and timing of the probes and relays the digital data to a laptop for further processing. The microcontrollers used in all three boards are PIC32MX695F512H. The data acquisition rates can be varied between 2.5 and 10 Hz, depending on the number of measurement probes used.
A MATLAB program was written to automatically identify and distinguish signals due to balloon angioplasty and angiograms from the background noise.
2.2 Measurement procedure
To obtain data from a patient, the measurement probes were placed on different angiosomes of the patient’s feet. Angiosomes are vascular territories, characterized and named by the artery that they are principally fed by (Attinger, et al., 2006). Depending on the location of the ulcerations and/or of the surgical intervention, one or more angiosomes can be affected at the same time. In this study the probes were positioned, when possible, on the posterior tibial artery, anterior tibial artery, dorsalis pedis artery, and peroneal artery, see Figure 2. While we always aimed to use four probes, in the presence of technical issues, ulcers, or amputations, sometimes three or only two probes were used (this is specified for each patient in Supplementary Table S1). A Tegaderm film was used to avoid direct contact between the probes and the foot of the patient and a second layer of the Tegaderm film on top of the probes was used to fix the probes in place.
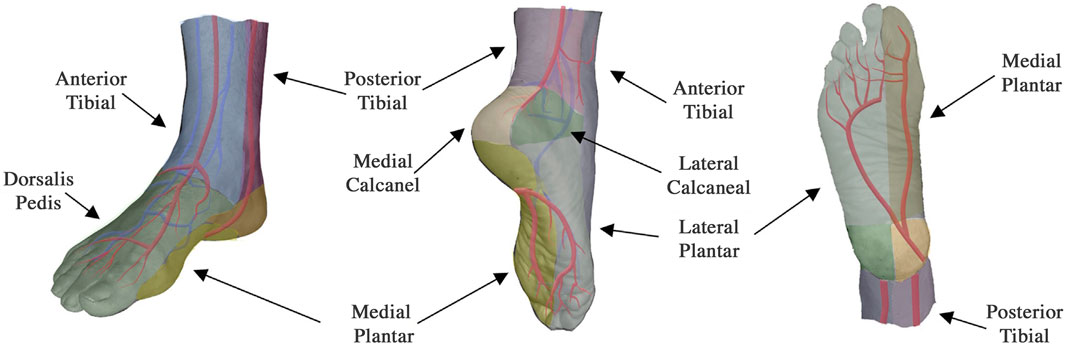
FIGURE 2. Angiosomes of the foot.
Data was collected from each patient from at least one of the following three times (refer to Supplementary Table S1 for more details): 1) less than one hour before the patient was moved to the surgery room, 2) continuously during the duration of the intervention, and 3) about one hour after the intervention was completed. The data acquisition process differed depending on if done during the intervention or before or after the intervention. For data collected before or after the intervention, a thigh cuff was used to cause a venous occlusion while minimally (60 mmHg) or marginally (100 mmHg) affecting the arteries, and the procedure consisted in five different phases of approximately one minute each: 1- a resting phase to acquire a baseline value; 2- manual inflation of the thigh cuff to 60 mmHg in less than 10 s and kept at that pressure for the remaining seconds of the minute; 3- deflation of the cuff followed by another resting phase to allow the signals to stabilize; 4- inflation of the cuff as before, however up to 100 mmHg; 5- deflation of the cuff followed by a resting phase.
For the acquisition during the intervention, the patients were lying on the operating table and the probes were placed in the same positions as before the intervention. Data were acquired throughout the intervention, which lasted between 45 and 90 min. Movements of a patient’s leg, movements of the bed, and timing of the angiograms were recorded and matched with the optical data collected. The resulting data were input to a diffusion-theory-based PDE-constrained multispectral evolution-based reconstruction algorithm (Kim, et al., 2010) which calculated the changes in total haemoglobin during the measurements.
A typical time trace for measurements taken before and after the intervention is shown in Figure 3. For the analysis of the data collected before and after the intervention, the parameters considered were: Rise Time (RT), defined as the time needed for the signal to pass from 10% to 90% of its maximum value; Plateau Time (PT), defined as the time after the signal surpasses 90% of its maximum value during the cuff inflation until the cuff is deflated and the signal drops lower than 90% of its maximum value; and Signal Percent Change (SPC), defined as the percentage change of the signal peak respect to its baseline value. We found in previous publications (Hielscher, et al., 2019; Marone, et al., 2019; Maheshwari, et al., 2022) that those parameters hold the most significant information on the healthiness of the vascular system under the probe location. Note that the three parameters RT, PT and SPC cannot be collected during the intervention. They require a thigh cuff inflation/deflation and about 5 min of acquisition, both of which would interfere with the intervention. For example, during an intervention, intravascular catheters are employed that would have to be removed each time a cuff is inflated. This is impractical and unnecessarily prolongs the time a patient would need to stay sedated.
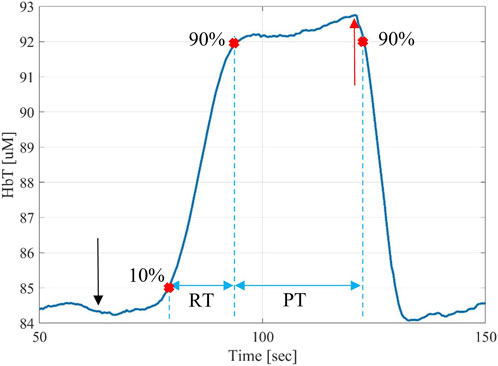
FIGURE 3. Typical time-trace for a DVOS measurement showing the increase total hemoglobin in the foot as a result of a cuff inflation on the leg, which results in a venous occlusion. Upon release of the cuff, the total hemoglobin returns to baseline values observed before the cuff inflation. The start of the 100-mmHg thigh pressure cuff inflation (which corresponds to the baseline value of the signal at 60 s) is marked with a black arrow and the moment in which the thigh pressure cuff is released (which corresponds to the max value of the signal at 120 s) is marked with a red arrow. The rise time (RT) is defined as the time needed for the signal to pass from 10% to 90% of its maximum value. Furthermore, the plateau time (PT) is defined as the time between the 90% of the rising and decreasing signal are marked on the figure.
3 Results
The characteristics of the patient population enrolled in this study are shown in Table 1. The numbers and positions of the probes used for each patient are shown in Supplementary Table S1.
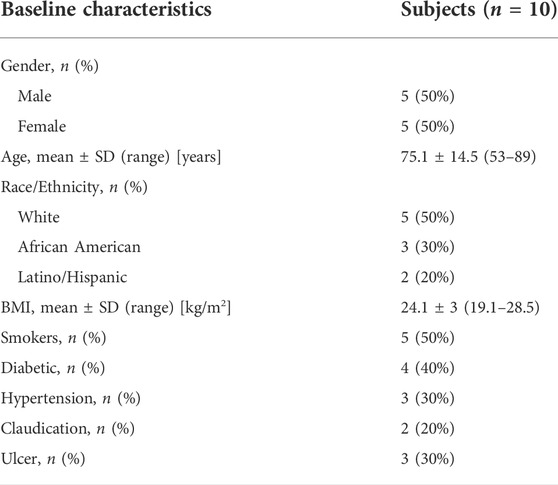
TABLE 1. Demographic and clinical characteristics of study objects.
Of the ten patients, seven patients received a balloon-angioplasty intervention followed by a stent placement, five interventions were located on the superficial femoral artery, one on the tibioperoneal artery, and one on the anterior tibial artery. For the remaining three patients that did not receive balloon-angioplasty, only an angiogram of the arterial tree was generated. There was a total of thirty-one data signals measured during the interventions. Twenty-two data signals were obtained from the subset of seven patients who received a balloon angioplasty intervention. However, seven probes had to be disconnected during the intervention after the first few angiograms and before the balloon angioplasty, since an entry point on the foot was required to treat the tibioperoneal and anterior tibial artery occlusions (see Supplementary Table S1). We wanted to avoid having the cables of the probes passing near the intervention entry points, since the cables were not previously sterilized. The data obtained from the three patients without a balloon angioplasty intervention amounted to nine signals.
In general, during an intervention, the endovascular surgeon performs two types of actions which can immediately and directly affect the blood pooling in the lower extremities. First, a contrast agent (iodine) is injected to perform X-ray angiography. This provides the surgeon with an overview of the vascular tree and shows locations where the arteries are blocked. Second, an intravascular balloon is inflated and deflated to open blocked arteries.
Here we first show how these actions influence the DVOS signals. After that all the observations made during the intervention are compared with the pre- and post-intervention measurements when applicable.
3.1 Contrast agent detection
Using the DVOS system we were able to identify the contrast agent of an angiogram passing in one or more of the angiosomes covered by the probes. The agent temporarily substitutes or dilutes the blood flowing in the arterial tree. In turn, this reduces the total hemoglobin concentration (HbT) measured by the DVOS system.
Among the thirty-one measurements, it was possible to automatically identify changes in the optical signal caused by the passing contrast agent in twenty measurements before a successful opening of the occlusion. An additional three measurements showed clearly identifiable changes in signal after contrast agent injection following a balloon angioplasty. Eight measurements never showed an automatically identifiable signal change related to the contrast agent. This was likely caused by an occlusion further up the arterial tree obstructed the passing of the dye under the probe. Of these, three were confirmed by angiographies to be from probes located on angiosomes that did not have patent arteries, while the other five measurement locations had limited perfusion. The change in the signal with respect to its baseline value due to the contrast agent varied among the subjects. We observed change in the range of 1%–8% with a mean of 3.2%. Noise levels varied among measurements but were always lower than 1% of the signal baseline value and below 0.1% in 28 out of 31 cases. Figure 4 shows examples of the contrast agent detection from two probes on different angiosomes of the same patient. Supplementary Figures S1, S2 show all the thirty-one HbT measurements.
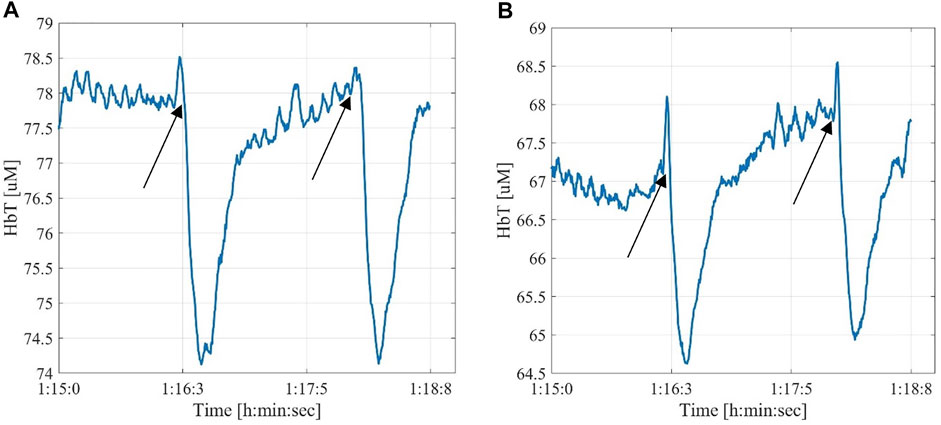
FIGURE 4. Examples of angiographic contrast agent effect on the signal read by two probes located on different angiosomes of the same patient. The black arrows mark the injection time of the contrast agent (A)—posterior tibial artery; (B)—medial plantar artery.
We also observed in one patient with patent arteries and just a single obstruction that if the contrast agent was injected directly in contact with a complete obstruction in the artery, the signal change was of lower amplitude and lasted longer than when injected farther upstream. Specifically, the patient’s three measurements detected a normal contrast agent signal of about 4% lasting for about 30 s when the contrast agent was injected far away from the occlusion. When the contrast agent was injected directly at the occlusion, we observed an optical signal change of only ∼1.5%, which lasted for 44 s. The fluctuation due to the noise was about 0.1% of the signal. This, as confirmed by an angiogram, is because injecting the contrast agent directly at the site of the obstruction prevented the contrast agent from moving downstream and caused it to enter alternative pathways supplying the lower leg and foot.
3.2 Balloon angioplasty detection
Using the DVOS system we were also able to detect the effects of the inflation and deflation of the balloon during a balloon angioplasty. In this case, we encountered two different situations. Either the opening of the clogged artery was successful with the first balloon inflation and deflation (Figure 5A), or the balloon had to be inflated multiple times while being shifted down the artery due to the presence of a extended occlusion (Figure 5B). If the artery was then patent, and there were no further occlusions in the lower part of the arterial tree, we observed an increase of the total hemoglobin value. This increase was between 3% and 10% with a mean change of 5%. All the contrast agent injections performed after patency was achieved caused more pronounced changes in DVOS signal, showing a higher percent change in the signal up to 5%.
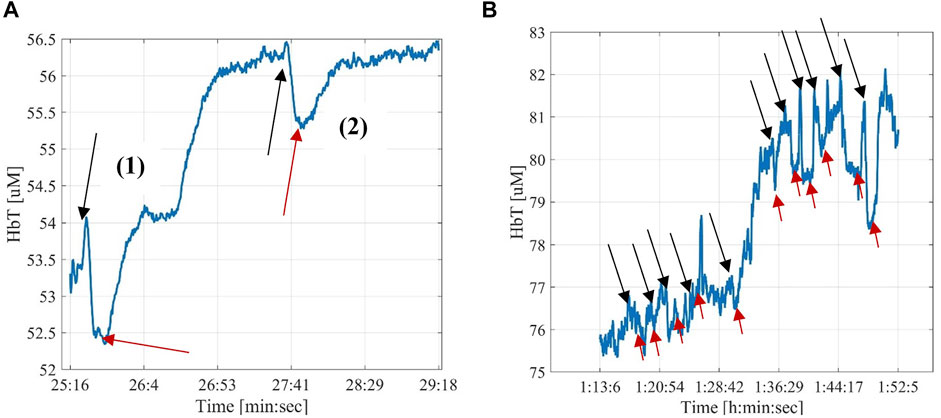
FIGURE 5. Examples of the effect of the balloon angioplasty. The black arrows mark the starting and the red arrows the ending of a balloon inflation. (A)—The first balloon inflation was effective in opening the occlusion and the signal increased by about 6.5% compared to the baseline (∼56.5 μM after inflation and deflation, compared to ∼53.0 μΜ before the inflation); The second balloon inflation and deflation did not change the HbT signal, as expected when this procedure is done on an artery without stenosis. (B)—Example of changes in HbT resulting from multiple balloon inflations/deflation cycles. The first four cycles did not result in an increase of HbT, indicating that the artery is still occluded. After five cycles, HbT increase drastically (from ∼77 to 80 μM) indicating that the stenosis has been removed and a better flow has been established. Subsequent cycles of inflating and deflating the balloon, did not result in further perfusion improvements.
Among the fifteen measurements during a balloon angioplasty, it was possible to identify the optical signal from the inflation and deflation of the balloon angioplasty in thirteen measurements. Two measurements never showed any related signal change during the intervention. In these cases, subsequent angiographies showed that the arteries suppling those angiosomes were still occluded. Note that two measurements among the thirteen did not show a clear increase in the total hemoglobin values, however they were already showing clear contrast agent signals before the angioplasty. It is likely that those angiosomes were already well perfused and the angioplasty did not greatly change their state.
Finally, it is worth noting that while the probe shown in Figure 5B recorded a signal change in the dorsalis pedis angiosome of the patient, no signal change was observed in the data gathered by the two probes localized on the lateral and medial plantar angiosomes. A subsequently performed angiogram revealed a secondary occlusion (that was not treated) on the posterior tibial artery, which supplies blood to both the lateral and medial plantar angiosomes. This explains the absence of a signal change.
3.3 Pre- and post-intervention comparison with intraoperative data
We found that the results of the DVOS measurements taken before a patient entered the surgical suite and after leaving the surgical suite were correlated data recorded during the intervention. We collected from the patient cohort a total of thirty-four measurements pre-intervention and twenty-eight measurements post-interventions (details for the acquisition are presented in Supplementary Table S1). We observed four different cases considering the signals collected before and after the intervention.
Figure 6A shows an example of case 1, where a DVOS measurement collected before and after the intervention showed the same response to thigh cuff inflations. The HbT traces are almost identical and display a block-like shape that is typical for a healthy vasculature, characterized by a short RT (of about 16 s) and long PT (of about 48 s) (Hielscher, et al., 2019). The measurement of Figure 6A was obtained from a probe placed on the peroneal angiosome of a patient. During the intervention, we were able to see the “dips” related to the infusion of a contrast agent (see Figure 7A) from the start of the intervention. Overall, this suggests that the intervention only minimally improved the blood perfusion of that area of the foot. Among the 28 coupled pre- and post-intervention signals collected from the patient cohort, five fit this case.
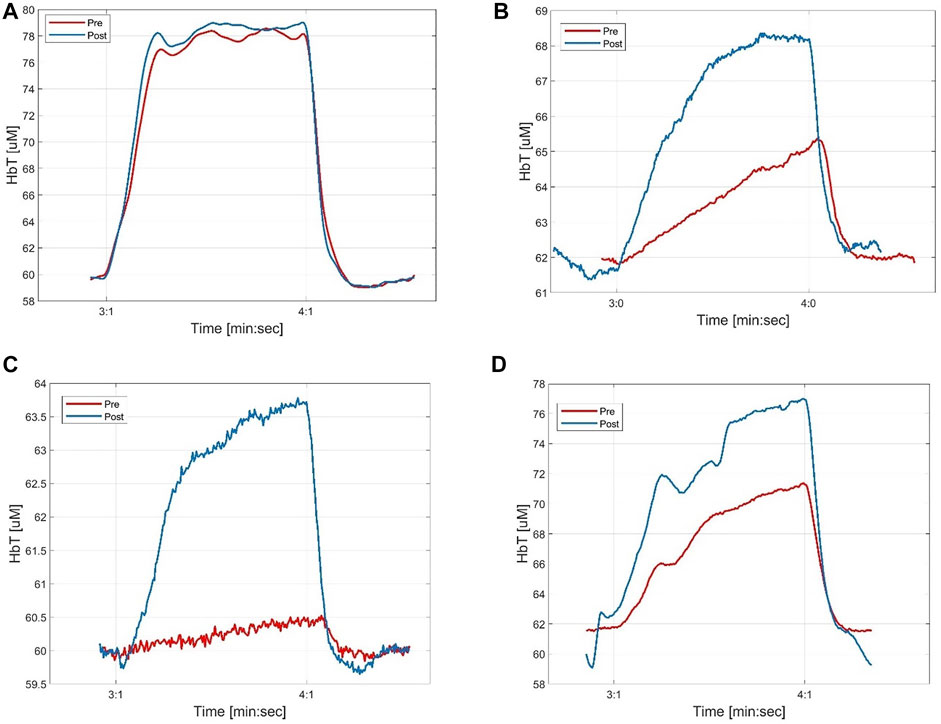
FIGURE 6. Examples of pre- and post-intervention measurements (with 100 mm Hg cuff inflation) in different probes that correlate with different outcomes of the interventions. (A) shows time-traces that before and after the intervention are similar and correspond to a healthy case; (B) shows a signal that improved and for which it was possible to notice the angiogram contrast agent even before the angioplasty; (C) shows a signal that improved and for which it was not possible to notice the angiogram contrast agent before the angioplasty; (D) shows a signal that didn’t improve considerably after the intervention. In this case it was not possible to notice the angiogram contrast agent or the balloon inflations/deflations during the angioplasty.
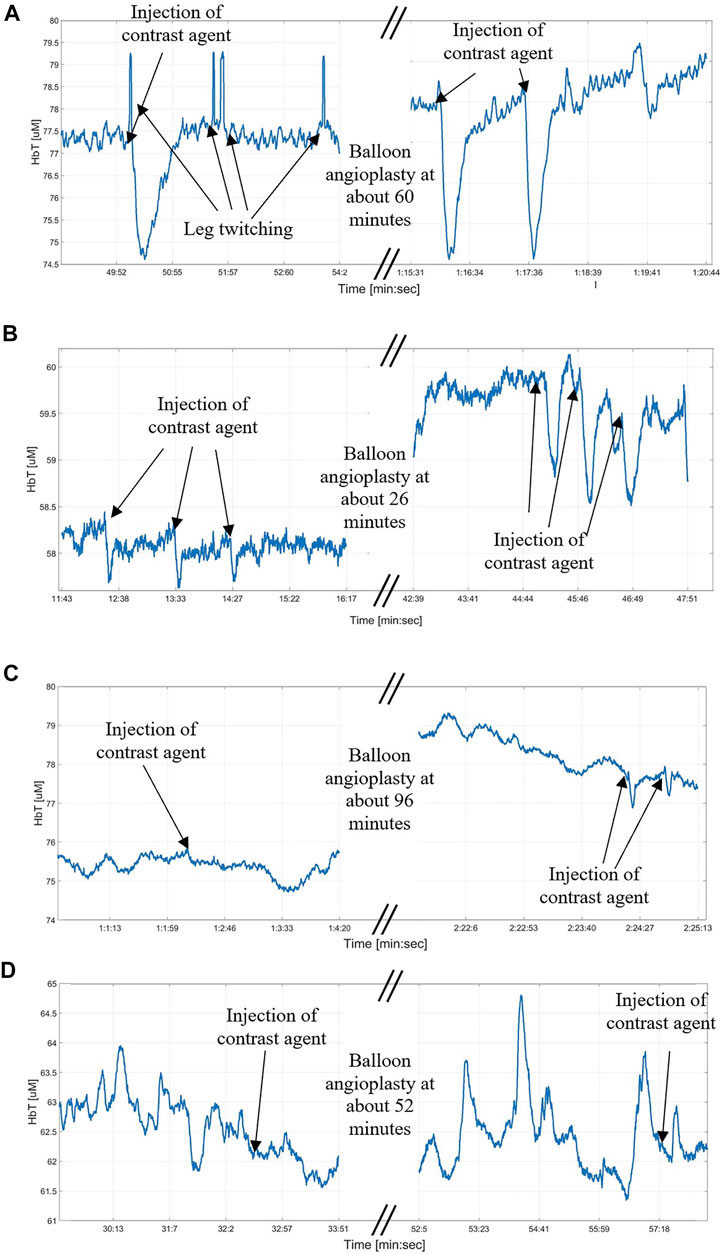
FIGURE 7. Examples of changes due to the contrast agent passage under a probe during the intervention. (A)—There is no clear difference between the contrast agent signal before and after the angioplasty, in both cases it is clearly visible and means that the perfusion is good; (B)—After the angioplasty there is a clear increase in the signal due to the injection of the contrast agent in the upper leg; (C)—While before the angioplasty it was not possible to collect a signal due to the injection of the contrast agent, it becomes possible after the angioplasty, meaning that an improvement in the perfusion was obtained; (D)—It was not possible to collect a signal from the injection of the contrast agent neither before or after the angioplasty, meaning that the angiosomes covered by the probe is not receiving the direct perfusion from the superficial femoral artery in the upper leg where the contrast agent was injected.
Figures 6B, 7B show an example for case 2 in which a clear improvement in the blood perfusion is obtained. Before the start of the intervention the DVOS HbT time trace has a triangular shape (red curve). This is indicative of a compromised perfusion. After the patient left the surgical suite, the time trace shows a shape closer to that of a healthy vasculature (see Figure 6A). The SPC and PT values are increased (respectively from 5% to 9% and from 14 s to about 26 s), while RT is shorter (from about 40 s to about 28 s). In this case, the optical probe was placed on a dorsalis pedis angiosome and during the intervention it was possible to see only small effects of the angiograms at the start of the intervention as shown in Figure 7B, which were more marked after the balloon angioplasty. Among the 28 coupled pre- and post-intervention signals collected from the patient cohort, twelve fit this case.
Figure 6C shows an example for case 3 of a patient in whom the DVOS HbT was almost flat before the intervention (red curve). This indicates a very poor perfusion in the foot, as a thigh cuff does not produce a change in the signal. After balloon angioplasty was performed, the HbT trace in response to a thigh cuff had a shape (blue curve) similar to that of a patient with healthy vasculature. We see an increase of SPC (from 1% to 6%), longer PT (from about 8 s to about 21) and shorter RT (from about 45 s to about 32 s). Note that in this patient the improvement was limited to the posterior tibial angiosome (shown in Figure 6C), with a smaller noticeable effect on the lateral plantar angiosome, and no effect on the dorsalis pedis angiosome. In fact, it was later confirmed with an angiogram that there were other occlusions in the upper part of the anterior tibial artery, which affected the dorsalis pedis angiosome. Among the 28 coupled pre- and post-intervention signals collected from the patient cohort, four fit this case.
Figures 6D, 7D show a case in which it was not possible to see the contrast agent passing under the probe or the balloon angioplasty effects during the intra-operative measurement. The cuff inflation produced very similar results before and after the intervention (very similar RT, PT and only slightly different SPC), with a poor blood perfusion characterized by a long RT of about 39 s. This indicates that the intervention did not considerably improve the blood perfusion of the target angiosome. Seven of the 28 pre- and post- coupled signals fit this case.
Figure 8 shows the distribution of the differences of PT, RT and SPC between pre- and post-intervention measurements for all 28 probes placed on different angiosomes. The green circles represent measurements on angiograms where the circulation improved after the intervention. The other markings (red crosses, blue stars, black squares) are based on the matching of the pre- and post-intervention couples with their respective intra-operative data. The red crosses correspond to two intra-operative measurements that did not show any signal changes in response to the injection of the contrast agent nor the balloon inflation/deflation (see Section 3.2). The blue stars correspond to two measurements that did not show changes in total hemoglobin level but were sensitive to the contrasting agent and balloon inflations/deflations. Finally, the three black squares indicate the measurements from the patient who did not receive a balloon angioplasty. One can see, as expected, all these measurements are near the origin of the axis (i.e., only minor changes in PT, RT and SPC).
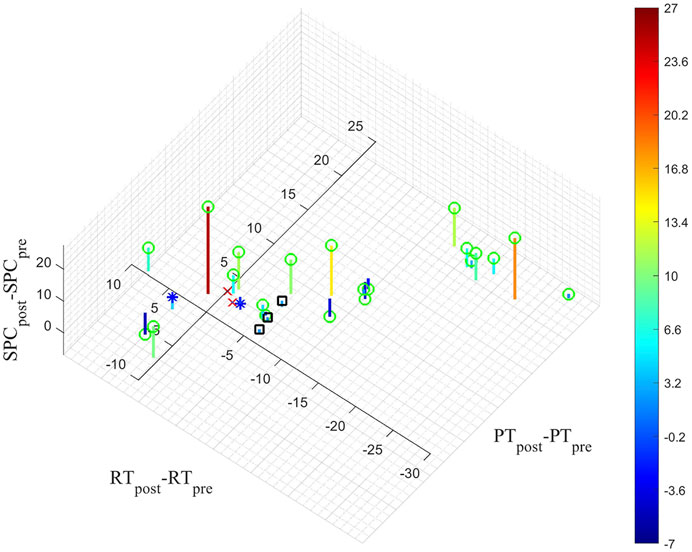
FIGURE 8. The difference between the average of the values obtained from the 60 and 100 mmHg cuff inflations pre- and post-measurements for PT, RT and PSC are shown. The markings on the figure are based on the matching of the pre- and post-intervention couples with their respective intra-operative data. The green circles represent measurements on angiograms where the circulation improved after the intervention. The red crosses correspond to the two intra-operative measurements that did not show any signal changes before or after the balloon angioplasty (see Section 3.2). The blue stars correspond to the two measurements that did not show changes in total hemoglobin levels but were sensitive to the contrast agent and balloon inflations/deflations (see Section 3.2). The black squares correspond to the measurements from the patient who did not receive a balloon angioplasty.
4 Discussion
We found that the injection of a contrast agent and the inflation and deflation of a balloon inside an artery can be detected by the DVOS system. The injection of a contrast agent temporarily replaces the blood in the vasculature, which in turn changes the absorption of light. Similarly, inflating a balloon will reduce or completely stop the blood flow down the arterial tree, leading to a reduction in blood concentration and an increase in the optical signal. Subsequently deflating the same balloon, will reestablish blood flow and decrease the optical signal to pre-inflation values, or decrease the signal further if reperfusion is achieved. Overall, we observed that these actions lead to a change in the measured DVOS signal amplitude between 1% to 8%. These changes are more marked once an artery has been successfully treated in the upper leg, showing a relationship with the perfusion status of the arterial tree.
There was also a marked increase (between 3% to 10%) in the total hemoglobin concentrations immediately following the opening of an occluded artery, depending on the healthiness of the remaining arterial tree and its effect on the angiosomes associated with each probe. In general, the percentage changes in the signals are different depending on the probe localization and might be absent from certain angiosomes, reflecting the differences in ability of the arterial tree to supply blood to different parts of the lower leg.
Furthermore, we observed a connection between the angiosomes which showed a limited perfusion before and after the intervention and the absence of angiographic contrast agent signals during the intervention. We identified four cases related to both the pre- and post-intervention measurements and the passing of the contrast agent under the probes as shown in Figures 6, 7: 1) a clearly identifiable signal was present before and after the balloon angioplasty; 2) a weak signal increased in amplitude after the balloon angioplasty; 3) no signal change due to the injection of the contrast agent was observed before the opening up of the occlusion but was possible to observe it after the balloon angioplasty; and, 4) no signal was visible during the duration of the intervention. The pre- and post-intervention measurements are also connected with optical signal changes caused by the inflation and deflation of the balloon during the angioplasty and with how much the baseline value changed. Higher changes in the baseline value and in the signal due to inflation and deflation of the balloon correspond to bigger changes between the pre- and post-intervention measurements (Figures 6, 7B,C).
There are some limitations of the technology. First, the system is sensitive to motion artifacts. This is mainly caused by the cables that connect the probes to the system’s operational unit. We found that abrupt leg movement can lead to stretching of the cables, which in turn may cause partial or complete detachment of a measurement probe. The DVOS signal will show spikes, and/or instantaneous shifts in the baseline values. These cases can be filtered out easily, but smaller twitches of the leg can add noise that is more difficult to identify. Also linked to the presence of the cables is the limitation on the area where the probes can be located to avoid interfering with the surgeon movements and entry points for the intervention, especially if an entry point is needed on the foot. All these issues could be overcome with a wireless data transfer, which we plan to implement in a next generation device. Another limitation is that the actions of the vascular surgeon were recorded only relative to the angiograms and inflating/deflating of the balloons. However, this recording was not automated and therefore some occurrences could have been missed and other actions were not recorded (i.e., the insertion/movements of the catheters, the movement of the bed, the movement of the patient, etc.).
5 Conclusion
We present first case studies involving the use of a DVOS system during a surgical intervention. We found that it was possible to detect the moment when a contrast agent used for an angiogram passed under a specific probe or angiosome. In addition, it was possible to observe in real time the effect that balloon inflation/deflations in the upper part of the leg had on the lower leg and the foot.
In general, these results suggest that DVOS can provide real-time feedback on the effectiveness of each action a vascular surgeon is performing during a surgical intervention to restore perfusion in the feet. It was also possible to see these effects only on some angiosomes and not others, underlining the presence of multiple occlusions in the arterial tree. Since DVOS can measure the changes in total hemoglobin concentration, a possible future application of the technology would be to simply use water as a contrast agent instead of iodine-based agents (Jara, et al., 2016). Iodine-based contrast agents are contra indicated for patients with kidney problems, which is a frequent comorbidity in PAD patients.
In future research, we will also test different controls. For example, we will test the effect of balloon inflation in a healthy artery, and we will place a probe upstream of an occlusion located in the lower leg. This will allow us to see the difference in the signals above and below the occlusion in the presence of contrast agent, balloon inflation, etc.
Data availability statement
The raw data supporting the conclusion of this article will be made available by the authors, without undue reservation.
Ethics statement
The studies involving human participants were reviewed and approved by Columbia University Medical Center Institutional Review Board (IRB). The patients/participants provided their written informed consent to participate in this study.
Author contributions
AM designed the experiment, acquired the data, analyzed the results, and drafted the article. NM helped with designing the MATLAB program for the data analysis and drafting of the article. SKK designed the reconstruction program to get the total hemoglobin concentrations from the raw data collected by the photodetectors. DB was the head vascular surgeon who performed all intervention. She also was closely involved in the design of specific procedure and experiment and the overall study. AH oversaw the overall conduct of the study, which include the conceptual design and implementation of the experiment and generation of the manuscript. All authors interpreted the experimental results and approved the submitted version of the article.
Funding
This work was supported in part through grants from the National Heart, Blood, and Lung Institute (NHLBI-1R01-HL115336-01), Wallace H. Coulter Foundation, Society of Vascular Surgery, Columbia University—Translational Research Fellowship, and New York University Tandon School of Engineering.
Conflict of interest
The authors declare that the research was conducted in the absence of any commercial or financial relationships that could be construed as a potential conflict of interest.
Publisher’s note
All claims expressed in this article are solely those of the authors and do not necessarily represent those of their affiliated organizations, or those of the publisher, the editors and the reviewers. Any product that may be evaluated in this article, or claim that may be made by its manufacturer, is not guaranteed or endorsed by the publisher.
Supplementary material
The Supplementary Material for this article can be found online at: https://www.frontiersin.org/articles/10.3389/fphot.2022.938144/full#supplementary-material
Examples of signal changes related to the passing of the contrast agent in the first five patients (P1 to P5). The start of the angiogram is marked in black. It is possible to distinguish the signal from the noise in 14 out of 15 probes. Probe P5C is the only one in which is not possible. In probes P2C and P5B the noise level is very high and the signal change could not be automatically detected by the Matlab program. Therefore, only data from 12 of the 15 probes was considered in the analysis as detectable by the system.
Examples of signal changes related to the passing of the contrast agent in the last five patients (P6 to P10). The start of the angiogram is marked in black. It is possible to distinguish the signal from the noise in 14 out of 16 probes. Probe P6A and P6C are the only ones in which a change in signal was not observed. For probes P6B, P7A and P10B is not possible to identify a signal change from the noise with the automated MATLAB program. Therefore, only data from 11 probes were considered in the analysis as detectable by the system.
References
Attinger, C. E., Evans, K. K., Bulan, E., Blume, P., and Cooper, P. (2006). Angiosomes of the foot and ankle and clinical implications for limb salvage: Reconstruction, incisions, and revascularization. Plastic Reconstr. Surg. 117 (7S), 261S–293S. doi:10.1097/01.prs.0000222582.84385.54
Cohoon, K. P., Wennberg, P. W., and Rooke, T. W. (2017). “Diagnosis and management of diseases of the peripheral arteries,” in Hurst's the Heart. 14e ed. (New York: McGraw-Hill). s.l.
Collins, R., Cranny, G., Burch, J., Aguiar-Ibanez, R., Craig, D., Wright, K., et al. (2007). A systematic review of duplex ultrasound, magnetic resonance angiography and computed tomography angiography for the diagnosis and assessment of symptomatic, lower limb peripheral arterial disease. Health Technol. Assess. 11 (20), 1–184. doi:10.3310/hta11200
Creager, M. A., and Loscalzo, J. (2018). “Arterial diseases of the extremities,” in Harrison's principles of internal medicine. 20e ed. (New York: McGraw-Hill). s.l.
Eiberg, J. P., Grønvall Rasmussen, J., Hansen, M. A., and Schroeder, T. V. (2010). Duplex ultrasound scanning of peripheral arterial disease of the lower limb. Eur. J. Vasc. Endovascular Surg. 40 (4), 507–512. doi:10.1016/j.ejvs.2010.06.002
Gerhard-Herman, M. D., Gornik, H. L., Barrett, C., Barshes, N. R., Corriere, M. A., Drachman, D. E., et al. (2016). 2016 AHA/ACC guideline on the management of patients with lower extremity peripheral artery disease: Executive summary: A report of the American College of cardiology/American Heart association task force on clinical practice guidelines. Circulation 135 (12), e686–e725. doi:10.1161/CIR.0000000000000470
Graeme, A. K., Radwan, R., Hayes, P. D., and Twine, C. P. (2014). Atherectomy for peripheral arterial disease. Cochrane Database Syst. Rev. 3, CD006680. doi:10.1002/14651858.cd006680.pub2
Hielscher, A. H., Marone, A., Altoé, M. L., Bajakian, D. R., Kalinsky, K., Hershman, D. L., et al. (2019). “14 - dynamic vascular optical tomographic imaging for peripheral artery disease and breast cancer,” in Neurophotonics and biomedical spectroscopy (Amsterdam: Elsevier), 353–400. s.l.
Hingorani, A., Ascher, E., and Marks, N. (2007). Preprocedural imaging: New options to reduce need for contrast angiography. Seminars Vasc. Surg. 20 (1), 15–28. doi:10.1053/j.semvascsurg.2007.02.005
Ipema, J., Huizing, E., Schreve, M. A., de Vries, J. P. P., and Unlu, C. (2020). Editor's choice – drug coated balloon angioplasty vs. Standard percutaneous transluminal angioplasty in below the knee peripheral arterial disease: A systematic review and meta-analysis. Eur. J. Vasc. Endovascular Surg. 59 (2), 265–275. doi:10.1016/j.ejvs.2019.10.002
Jara, H., Mian, A., Sakai, O., Anderson, S. W., Horn, M. J., Norbash, A. M., et al. (2016). Normal saline as a natural intravascular contrast agent for dynamic perfusion-weighted MRI of the brain: Proof of concept at 1.5T. J. Magn. Reson. Imaging 44 (6), 1580–1591. doi:10.1002/jmri.25291
Jongkind, V., Akkersdijk, G. J., Yeung, K. K., and Wisselink, W. (2010). A systematic review of endovascular treatment of extensive aortoiliac occlusive disease. J. Vasc. Surg. 52, 1376–1383. doi:10.1016/j.jvs.2010.04.080
Kim, H. K., Flexman, M., Yamashiro, D. J., Kandel, J. J., and Hielscher, A. H. (2010). PDE-constrained multispectral imaging of tissue chromophores with the equation of radiative transfer. Biomed. Opt. Express 1 (3), 812. doi:10.1364/boe.1.000812
Maheshwari, N., Marone, A., Altoé, M., Kim, H. K., Bajakian, D. R., and Hielscher, A. H. (2022). “Pilot study on monitoring ulcer healing with diffuse optical imaging in a patient cohort affected by peripheral arterial disease (PAD),” in Proceedings Volume 11968, Optical Diagnostics and Sensing XXII: Toward Point-of-Care Diagnostics; 119680A, San Francisco, CA (SPIE BiOS). doi:10.1117/12.2610373
Marone, A., Hoi, J. W., Khalil, M. A., Kim, H. K., Shrikhande, G., Dayal, R., et al. (2019). Modeling of the hemodynamics in the feet of patients with peripheral artery disease. Biomed. Opt. Express 10 (2), 657–669. doi:10.1364/boe.10.000657
Martinelli, O., Alunno, A., Drudi, F. M., Malaj, A., and Irace, L. (2021). Duplex ultrasound versus CT angiography for the treatment planning of lower-limb arterial disease. J. Ultrasound 24, 471–479. doi:10.1007/s40477-020-00534-y
Mustapha, J. A., Saab, F., Diaz-Sandoval, L., Karenko, B., McGoff, T., Heaney, C., et al. (2013). Comparison between angiographic and arterial duplex ultrasound assessment of tibial arteries in patients with peripheral arterial disease: On behalf of the joint endovascular and non-invasive assessment of LImb perfusion (JENALI) group. J. Invasive Cardiol. 25 (11), 606–611.
Potiera, L., Khalil, C. A., Mohammedi, K., and Roussel, R. (2011). Use and utility of ankle brachial index in patients with diabetes. Eur. J. Vasc. Endovascular Surg. 41 (1), 110–116. doi:10.1016/j.ejvs.2010.09.020
Suominen, V., Rantanen, T., Venermo, M., Saarinen, J., and Salenius, J. (2008). Prevalence and risk factors of PAD among patients with elevated ABI. Eur. J. Vasc. Endovascular Surg. 35 (6), 709–714. doi:10.1016/j.ejvs.2008.01.013
Keywords: peripheral arterial disease (PAD), angiogram and intravascular analysis, peripheral vascular interventions, monitoring-, dynamic vascular optical spectroscopy
Citation: Marone A, Maheshwari N, Kim SK, Bajakian DR and Hielscher AH (2022) Dynamic vascular optical spectroscopy for monitoring peripheral arterial disease patients undergoing a surgical intervention. Front. Photonics 3:938144. doi: 10.3389/fphot.2022.938144
Received: 07 May 2022; Accepted: 06 July 2022;
Published: 09 August 2022.
Edited by:
Sylvain Gioux, Intuitive Surgical Sàrl, SwitzerlandReviewed by:
Anouk Post, The Netherlands Cancer Institute (NKI), NetherlandsDale Waterhouse, University College London, United Kingdom
Copyright © 2022 Marone, Maheshwari, Kim, Bajakian and Hielscher. This is an open-access article distributed under the terms of the Creative Commons Attribution License (CC BY). The use, distribution or reproduction in other forums is permitted, provided the original author(s) and the copyright owner(s) are credited and that the original publication in this journal is cited, in accordance with accepted academic practice. No use, distribution or reproduction is permitted which does not comply with these terms.
*Correspondence: A. Marone, YW0xMTIwMUBueXUuZWR1