 Yulian Cao
 Ganbat Baasantseren
- Department of Electronics and Communication Engineering, National University of Mongolia, Ulaanbaatar, Mongolia
A high-resolution enhanced point light source integral imaging display is proposed. Using additional light sources to create extra point light sources in the point light source plane, the point light sources appeared on the plane that deviated from the expected values because of aberrations in the lens. Previously, only the lens array aberration was corrected and the distance along the horizontal and vertical axes was corrected too. The objective of this paper is to simultaneously correct the aberration between the lens array and the collimating lens, plus the horizontal and vertical axes, and correct the error along the z-axis. So, we determined the distance between the central light source and the additional light source to compensate for lens aberrations. From the experimental results, our technique precisely increased the resolution 3 times in both vertical and horizontal dimensions when compared to a traditional point light source display. Our method is applicable to 3D displays and compensates for the lens array and collimating lens aberrations.
Introduction
We can see three-dimensional (3D) images in many different technologies (Hong et al., 2011; Geng, 2013). The point light source (PLS) (Park et al., 2004; Kim et al., 2007) display is one of the integral imaging (InIm) (Okano et al., 1997; Lee et al., 2006) displays. The PLS display has certain advantages, such as without the need for special glasses (Lippmann, 1908), 3-D color, full parallax horizontal and vertical, and the wide depth range of 3-D images (Jang and Javidi, 2003; Park et al., 2004; Hong et al., 2004; Luo et al., 2012; Zhang et al., 2012; Oh et al., 2014). However, limited viewing angle (Lee et al., 2002; Kim et al., 2004) and low resolution (Kim et al., 2008) make PLS display unable to be widely used in life. Therefore, the resolution needs to be improved. The researchers studied the limitations of 3-D displays and tried to improve them.
Park et al. used an additional lens array between the collimating lens and the lens array to double the resolution (Park et al., 2005). However, the disadvantage is that the more lens arrays, the more expensive, the screen is thick, and the additional PLS is not precisely aligned with the boundary, and this method cannot compensate for lens aberrations.
Wang et al. nine light sources on the one board are being used to generate 4 times more point light sources than elemental lenses, and the resolution was enhanced two times (Fenghua et al., 2017). However, the additional PLS is not precisely aligned with the boundary due to aberrations in the lens array.
Choimaa et al. analyzed the effect of Petzval curvature in InIm display (Choimaa et al., 2015). Due to aberration of the elemental lens, the depth plane of the InIm display becomes an array curvature, reduces the depth range, changes the viewing direction, and increases the black stripe. Therefore, they suggested that the lens array on the InIm display should be customized. Although the Petzval double-lens can compensate Petzval curvature, however, it is difficult to apply to element lenses, and Petzval curvature becomes a mirror curve in the PLS display.
Our previous study compensated for lens aberrations on PLS displays by configuring the distance between additional light sources by design (Baasantseren et al., 2021). We changed the distance between the light sources along the x and y axes, the distance between the PLSs became uniform, and the resolution increased four times. However, the lens aberrations in which PLSs appear in different planes are not corrected.
In this paper, we first explained the effect of Petzval curvature in PLS display. The plane in front of the lens array is curved due to the Petzval curvature on the InIm display (Choimaa et al., 2015). Our experimental results that the effect of the Petzval curvature in the PLS display is mirror curvature. Then we also introduce a new method to compensate for lens aberrations with moving parts. We all know that enhancing the resolution uses an additional light source. Our new method is moving the additional light source along the z-axis to compensate for lens aberrations. So easily resolved problems due to lens aberrations that initially appear in a different plane than the theoretical value. This high-resolution PLS display is suitable for 3D display.
Figure 1A shows the structure of a conventional PLS display. Many small elemental lenses make up the lens array. The light source is placed at the focal point of a collimating lens. The collimating lens collimates the light emitted by the light source (one Surface-Mount-Device Light-Emitting-Diode (SMD LED)). The collimated light rays are imaged into an array of point light sources at the focal plane of the lens array. The corresponding elemental image pixels modulated the light rays from each point light source, which are then integrated into 3D images. The 3D resolution is determined by the number of PLS equal to the elemental lens number. In addition, Figure 1B shows enhanced 3D resolution, using an additional light source. According to the principle that light beams passing through the optical center of the lens do not change the propagation direction, and the collimated light rays converge at the focal points of elemental lenses on the PLS plane. The resolution of a PLS display is determined by the distance between two adjacent PLSs (Lippmann, 1908). The resolution of PLS display is calculated as follows:
where d is the distance between two adjacent PLSs. The resolution and distance between two PLSs are inversely proportional. The resolution improves as the distance between two PLSs is lowered, as shown in Eq 1.
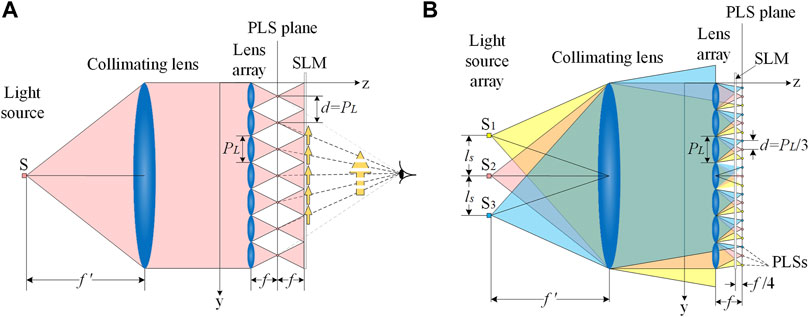
FIGURE 1. (A) Structure of conventional PLS display and (B) three light sources PLS display.
For the (3 × 3) light source PLS display, the light sources array is used to generate more PLSs as shown in Figure 1B. The SLM position is on the back of the PLS plane, distance from PLS plane 1/4f, and the illumination area size on SLM of each PLS is equal, therefore avoid crosstalk. The distance between two light sources determines the distance between adjacent PLSs (Baasantseren et al., 2021). When the distances between adjacent PLSs are equal, the distance between two light sources is as follows:
where f ʹ is the focal length of the collimating lens, PL is the pitch of the elemental lens, f is the focal length of the elemental lens, and n is the times resolution enhancement. When n is 3, the resolution of the display is three times that of a conventional PLS display.
The parallel rays are converged into PLSs on the PLS plane by the lens array. Due to aberrations of the lens array, additional light sources in a flat of normal to the main optical axis cannot be properly brought into focus on a PLS plane and call it the Petzval curvature.
Petzval Curvature
Petzval curvature describes the optical aberration in which a flat object normal to the optical axis cannot be properly brought into focus on a flat image plane. It appeared in an arc of radius RC as shown in Figure 2. A radius of the Petzval curvature of a thin lens can be obtained by
where nL is the refractive index of the lens and f is the focal length of the lens (Choimaa et al., 2015). The PLS of the central light source is focused at the focal plane, and the PLSs of additional light sources are focused behind the focal plane, as shown by the green curve. If the lens array and the collimating lens are ideal lenses, the addition of additional light sources can enhance the resolution by a factor of n. Unfortunately, both the lens array and the collimating lens have aberrations, which enlarges the size of the PLS.
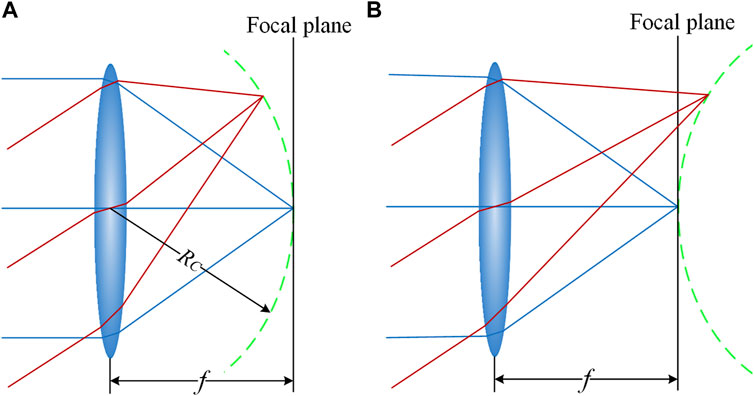
FIGURE 2. Green color shows (A) Petzval curvature and (B) the mirror Petzval curvature.
In our previous study, experimental results based on theoretical values showed that the distances between point light sources are close and appear on different planes (Baasantseren et al., 2021), which is believed to be the result of Petzval curvature. Therefore, we speculate that by moving the position of the additional light source, the Petzval curvature can be corrected. The experimental results show that the distance between the PLSs is modified, but the PLSs appear in different planes. The opposite of the Petzval curvature was found by measuring the distance between the lens array and the extra PLS, as shown in Figure 2B. Therefore, we recommend not placing the additional light source close to the collimating lens, but away from it, as shown in Figure 4. Moving distance Δz of the additional light source can only be obtained experimentally because both the lens array and the collimating lens have aberrations. After determined the distance Δz through experiments, we performed experiments with the newly proposed method. This part is written in the experimental results section, and we should do the experiment.
New Method
The Additional Light Sources Placed in Front of the Focal Plane of the Collimating Lens
Two light sources O and Aʹ are focused on the PLS plane through a collimating lens and lens array, the distance between the PLSs is adjusted to PL/3, as shown in Figure 3. According to the principle that a light beam passing through the optical center of the collimating and elemental lenses does not change direction, place the PLS generated by the additional light source at point F, connect point F with the center point D of the element lens with a straight line, and then draw a right triangle DEF. In the same way, the light beam passing through the center of the collimating lens does not change its propagation direction and draws a line AB parallel to the line DF move the A light source Δz distance to the right along the AB line and Δy distance down, and placed a new additional light source at point A'. Previously, as shown in Figure 2A, peripheral rays were thought to radiate close to the lens array due to Petzval curvature. Then, as shown in Figure 3, we experimented with the idea that the lens aberration could be corrected by moving the additional light source far to the collimating lens from the center light source at a distance of Δz.
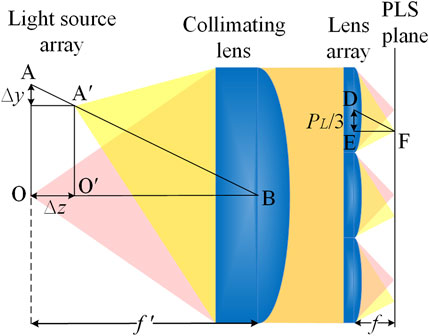
FIGURE 3. Additional light sources placed in front of the focal plane of the collimating lens.
Our Method
The additional light source A′ is placed behind the focal plane of the collimating lens, as shown in Figure 4. Finding the new position of the additional light source A′ is the same as the previous method. Move the A light source Δz distance to the left along the AB line and Δy distance up, and placed a new additional light source at point A'. The exact location of the new additional light source A′ and the distance Δz were experimentally determined. The experimental results show the opposite as shown in Figure 2B. We have previously considered an aberration of the lens array. However, it was assumed that the parallel rays were not generated because of the aberration of the collimating lens. In other words, the aberration of the lens array and the collimating lens had to be corrected at the same time. The proposed method is to move the additional light sources away from the center light source with the Δz distance, as shown in Figure 4. There is no other way than to determine this Δz distance experimentally. The experimental section explains how to find and configure the Δz distance and the Δy distance experimentally and create a 3D image.
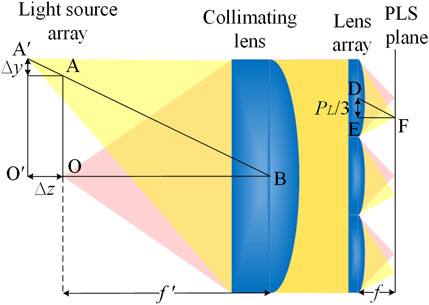
FIGURE 4. Additional light sources placed behind the focal plane of the collimating lens.
Experimental Results
The light source array of the PLS display is placed close to the collimating lens to compensate for the aberration caused by the Petzval curvature so that the point light sources all appear on the PLS plane. The moving distance Δz of the additional light source cannot be found theoretically, so it is found experimentally. We performed three experiments. In the first experiment, we attempted to move the additional light source forward along the z-axis, which compensated for the elemental lens aberration. In the second experiment, we determined the Petzval surface in the PLS display. In the third experiment, we moved the additional light source back along the z-axis, compensated for lens aberrations, and enhanced the resolution threefold compared to that of the conventional method. Table 1 shows the system parameters. Figure 5 shows the experimental setup of a PLS display that triples resolution by compensating for lens aberrations. We soldered nine surface-mount LEDs (SMLEDs) to different boards. The central LED LS1 is placed at the focal point of the collimating lens. LS2-LS9 are placed at Δz back the focal point of the collimating lens, respectively, and used to increase the number of PLSs.
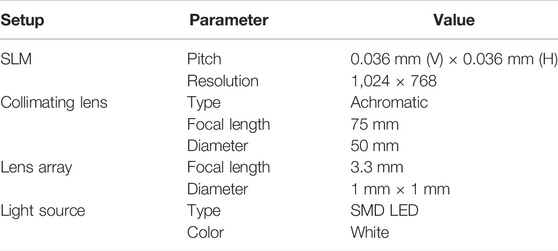
TABLE 1. Experimental specification.

FIGURE 5. Experimental setup of the PLS display.
Move the Additional Light Source Closer to the Collimating Lens
When the nine light sources are placed at the focal plane of the collimating lens, we only lit the three light sources of center, edge, and diagonal as shown in Figure 6A. Because the light sources of the PLS display are symmetrical. Figure 6B shows the result of taking a picture from the front using a camera, 3 PLS of different sizes when the diffuser is placed at the focal plane of the lens array.
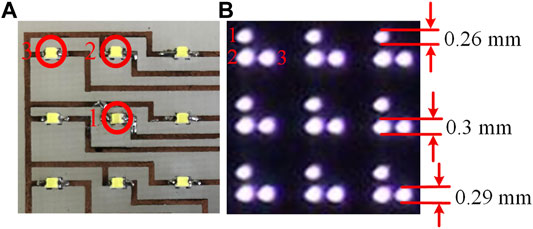
FIGURE 6. When the nine light sources are placed in the focal plane of the collimating lens (A) three light sources lit and (B) 3 PLS sizes.
Given the edge and diagonal PLS are minimal on the PLS plane, the correct distance Δz is found when moving the light source closer to the collimating lens, as shown in Figure 3; Table 2 shows the change in PLS size with Δz. As Δz longer, the size of the central PLS is increasing. The size of the additional edge and diagonal PLS first decreases next to the increase. Experimental results show when Δz = 8 mm same size of the edge and diagonal PLS. According to the experimental results of our proposed method, the limit of Δz is 8 mm.
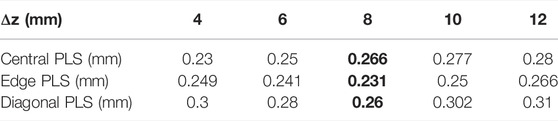
TABLE 2. Relationship between the size of the PLS and z.
Figure 7 shows a board corresponding to Figure 3, on which an additional light source is placed 8 mm in front of the central light source. At this time, eight additional light sources are lit. The experimental results are shown in Figure 8. When ∆z = 2 mm, the distance between adjacent PLSs is not uniform, as shown in Figure 8A. When ∆z = 2.5 mm, the size of the adjacent PLSs is uniform but the distance between the adjacent PLSs is not uniform, as shown in Figure 8B. When ∆z = 3 mm, the distance between adjacent PLSs is uniform, but the size of adjacent PLSs is not uniform, as shown in Figure 8C. Therefore, this method cannot be used. We initially considered that moving the additional light source closer to the collimating lens compensated for lens array aberrations due to the Petzval curvature. However, the experimental results were unexpected, so we tested the Petzval curvature.
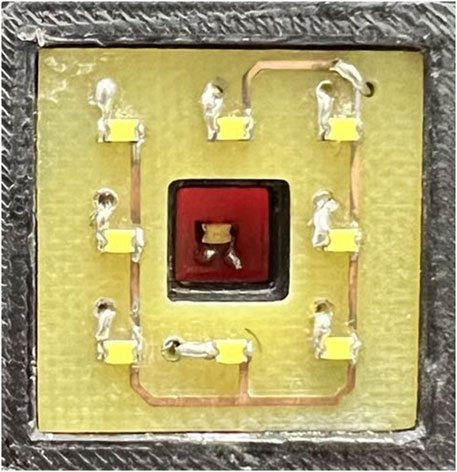
FIGURE 7. A board that additional light source placed 8 mm in front of the central light source.
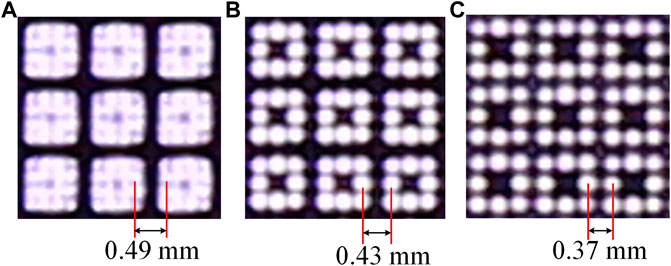
FIGURE 8. Experimental results show, at ∆z (A) 2 mm (B) 2.5 mm, and (C) 3 mm respectively when eight additional light sources.
Test Petzval Curvature
To find the exact location of the extra PLS, simply find the smallest corresponding extra PLS generated in front of the lens array. It should be noted that PLS is the smallest and sharpest when properly focused. First, the diffuser was placed 2 mm in front of the lens array, then the diffuser was moved from 2 to 3 mm in 0.05 mm steps and 21 images were taken from the diffuser. Because many high-resolution images are indistinguishable in size from the naked eye, we use Matlab to count the dots that are different from black. Consider the least white dots as the smallest dots. Figure 9 shows the result when only the central light source is lit. The central light source is colored red, as shown in Figures 9A, B, the vertical axis represents the sum of the number of white dots, and the horizontal axis represents the distance between the diffuser and the lens array. The least number of white dots at 2.5 mm, which we consider, is the focal length of the lens array. Therefore, we determine two conditions. The first condition that the distances of PLSs are 2.5 mm from the lens array. The second condition that the number of white dots is least at 2.5 mm from the lens array.
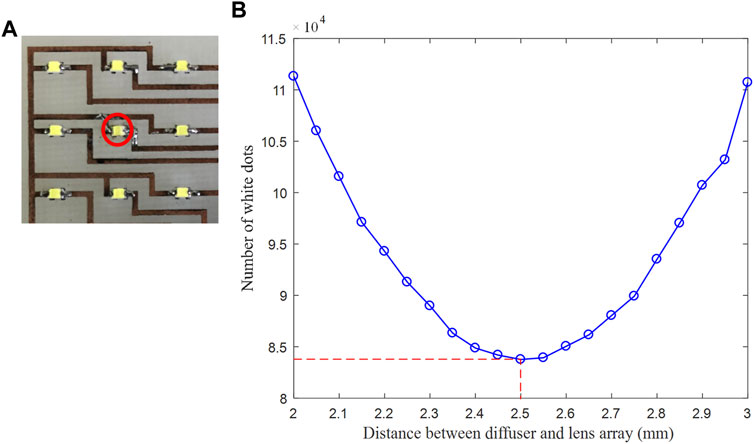
FIGURE 9. When only the central light source lit (A) the red circle refers to the lit light source and (B) the result in 2.5 mm.
The same method can find the position of the smallest white dots in Figures 10, 11, as shown by the red circle in Figures 10, 11A, when the two edge and two diagonal light sources are lit separately; the results are shown in Figures 10; Figure 11B repeat the previous experiment. The results show that when two edge light sources are lit, the least number of white dots at 2.55 mm. When two diagonal light sources are lit, the least number of white dots at 2.6 mm. From the test results, we obtain the opposite Petzval curvature, as shown in Figure 2B. On this opposite Petzval surface, central PLS is the same size as adjacent PLS. Therefore, we consider that when nine light sources are placed on the focal plane of the collimator lens and lited (spherical wave), the light passing through the collimating lens appears as the erroneous parallel light beams (transverse wave).

FIGURE 10. When two edge light sources are lit (A) red circle refers to the lit light sources and (B) result.
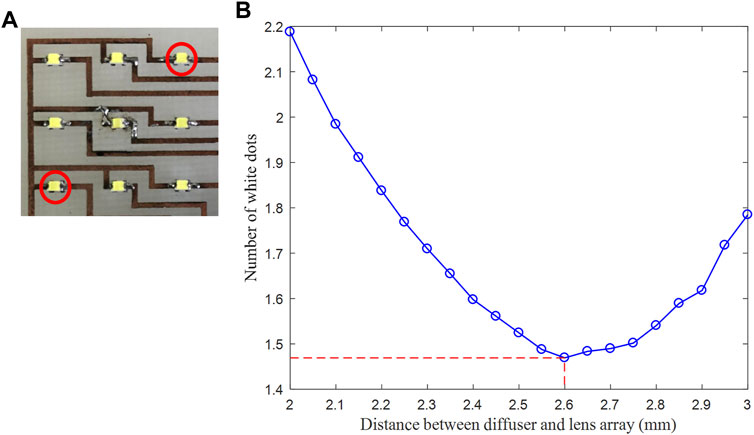
FIGURE 11. When two diagonal light sources are lit (A) the red circle refers to the lit light sources and (B) the result.
Move the Additional Light Source Away From the Collimating Lens
Since the central PLS is focused on the focal point of the lens array, the central light source position does not move. The eight additional light sources are moved by Δz and Δy in the same way, as shown in Figure 4; Figure 12A shows that the results show the positions with the least number of white dots when two edge light sources are lit at different Δz. In contrast, the green curve (Δz = 7 mm) has the least number of white points at 2.5 mm. We can conclude that edge light sources at Δz = 7 mm satisfy two conditions.
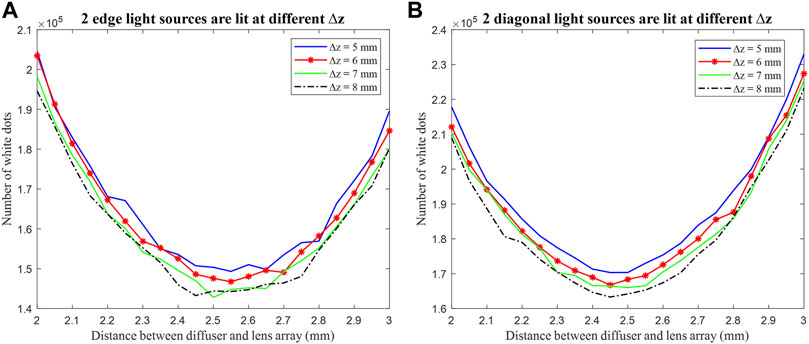
FIGURE 12. Results show the positions to the least number of white dots (A) when two edge light sources and (B) two diagonal light sources are lit at different Δz.
Figure 12B shows that the results show the positions with the least number of white dots when two diagonal light sources are lit at different Δz. The black dash-dot curve (Δz = 8 mm) has the least number of white points at 2.45 mm. However, it satisfies only the first condition. Figure 12B shows that the results show the positions with the least number of white dots when two diagonal light sources are lit at different Δz. The green curve (Δz = 7 mm) has the least number of white points at 2.5 mm, so it satisfies two conditions. Therefore, the additional light source is moved back by 7 mm from the collimating lens.
Figure 13 shows a new board with eight additional light sources placed 7 mm back from the central light source. The experimental results are shown in Figure 14A shows the result for the conventional PLS display with one central light source. The resolution is low and the distance between adjacent PLSs is 1 mm. Figure 14B shows the result for the conventional (3 × 3) PLS display with one board. It is the resolution enhanced three times, but the distance between adjacent PLSs is not uniform. The distance between adjacent PLSs is about 0.28 and 0.43 mm respectively. Figure 14C shows the result of our previous method (Baasantseren et al., 2021) for the (3 × 3) PLS display with one board. The resolution is enhanced three times, and the distance between adjacent PLSs is uniform, but the size of adjacent PLSs is not uniform. The adjacent size PLSs are about 0.3 and 0.35 mm, respectively. Figure 14D shows new method results for the (3 × 3) PLS display with a different plane board. It is the resolution precisely enhanced threefold. The distance between adjacent PLSs is uniform, and the size of adjacent PLSs is uniform. The adjacent size PLSs are all 0.35 mm.
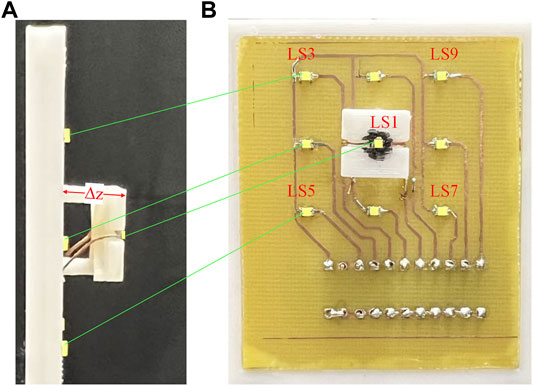
FIGURE 13. New board with an additional light source behind the central light source (A) left side and (B) front side.
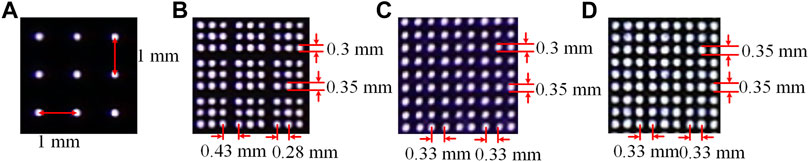
FIGURE 14. Take photos of the PLS plane, using (A) conventional PLS display (B) conventional (3 × 3) PLS display with one board (C) previous method with one board and (D) New diffrent board.
Our New PLS Display
The two objects ‘U’ and ‘T’ are 10 and 20 mm, respectively, in front of the SLM. We created two sets of EI and displayed them on the SLM. We photographed the two objects when the camera was focused on the PLS plane. The results are shown in Figure 15A shows the result of the traditional PLS display with one light source. It is difficult to identify ‘U’ and ‘T’ because the resolution is low. Figure 15B shows the result when (3 × 3) light sources are on one board. The resolution is three times higher than the traditional method. When the correct moving distance cannot be found, the distance between the PLS is not uniform, the PLS is not the same size. Figure 15C shows the result with (3 × 3) light sources on different plane boards. When the additional light source is placed back into the collimating lens at Δz = 7 mm, the distance between the PLS of ‘U’ and ‘T’ is uniform and the size of the PLS appears the same. The distance between adjacent PLSs is 0.35 mm and the adjacent size PLSs is 0.33 mm. Experimental results show that the new method of moving the position of the additional light source backward along the z-axis enhances the resolution threefold and compensates for lens aberrations more precisely.
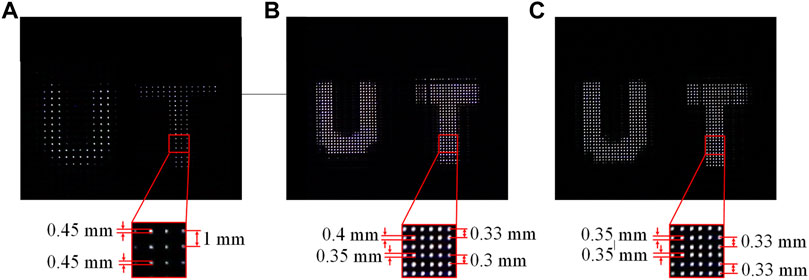
FIGURE 15. Experimental results of (A) traditional PLS display with one light source (B) (3 × 3) light sources are on one board, and (C) the new PLS display.
Conclusion
In this paper, a new high-resolution PLS display has been proposed using a (3 × 3) light source. Moving back the additional light sources along the z-axis correcting aberration in the lens array and the collimating lens enhance the resolution precisely threefold. Experimental results show that our new method makes all PLS appear on the PLS plane, allowing viewers to watch better quality 3D images. Our simple method will be used to compensate for aberration of the lens array and collimating lens in the integral imaging display. We are currently working to enhance the resolution of the PLS display.
Data Availability Statement
The original contributions presented in the study are included in the article/Supplementary Material, further inquiries can be directed to the corresponding author.
Author Contributions
CY developed a methodology, conducted data recording, and wrote the original draft. B-OC took experiment and validation. N-ED reviewed and edited the writing. GB developed the methodology, reviewed and edited the writing, and supervised the research project.
Conflict of Interest
The authors declare that the research was conducted in the absence of any commercial or financial relationships that could be construed as a potential conflict of interest.
Publisher’s Note
All claims expressed in this article are solely those of the authors and do not necessarily represent those of their affiliated organizations, or those of the publisher, the editors and the reviewers. Any product that may be evaluated in this article, or claim that may be made by its manufacturer, is not guaranteed or endorsed by the publisher.
References
Baasantseren, G., Cao, Y., and Dalkhaa, N.-E. (2021). Use of Multiple Light Sources to Enhance the Resolution of Point Light Source Displays. Appl. Opt. 60, 9213–9218. doi:10.1364/ao.438873
Choimaa, L., Batbayr, D., and Baasantseren, G. (2015). Effect of Petzval Curvature on Integral Imaging Display. Proc. SPIE 9391, 93911B.
Fenghua, X., Ming, M.-H., Wang, Z., and Wang, A. (2017). Resolution Enhanced Integral Imaging Display Using a Dense Point Light Source Array. Opt. Commun. 403, 110–114.
Geng, J. (2013). Three-Dimensional Display Technologies. Adv. Opt. Phot. 5, 456–535. doi:10.1364/aop.5.000456
Hong, J., Kim, Y., Choi, H. J., Hahn, J., Park, J. H., Kim, H., et al. (2011). Three-Dimensional Display Technologies of Recent Interest: Principles, Status, and Issues [Invited]. Appl. Opt. 50, H87–H115. doi:10.1364/AO.50.000H87
Hong, J., Park, J.-H., Jung, S., and Lee, B. (2004). Depth-Enhanced Integral Imaging by Use of Optical Path Control. Opt. Lett. 29, 1790–1792. doi:10.1364/ol.29.001790
Jang, J.-S., and Javidi, B. (2003). Large Depth-Of-Focus Time-Multiplexed Three-Dimensional Integral Imaging by Use of Lenslets with Nonuniform Focal Lengths and Aperturesizes. Opt. Lett. 28, 1924–1926. doi:10.1364/ol.28.001924
Kim, Y., Kim, J., Kang, J.-M., Jung, J.-H., Choi, H., and Lee, B. (2007). Point Light Source Integral Imaging with Improved Resolution and Viewing Angle by the Use of Electrically Movable Pinhole Array. Opt. Express 15, 18253–18267. doi:10.1364/oe.15.018253
Kim, Y., Kim, J., Kim, Y., Choi, H., Jung, J.-H., and Lee, B. (2008). Thin-Type Integral Imaging Method with an Organic Light Emitting Diode Panel. Appl. Opt. 47, 4927–4934. doi:10.1364/ao.47.004927
Kim, Y., Park, J.-H., Choi, H., Jung, S., Min, S.-W., and Lee, B. (2004). Viewing-Angle-Enhanced Integral Imaging System Using a Curved Lens Array. Opt. Express 12, 421–429. doi:10.1364/opex.12.000421
Lee, B., Jung, S., and Park, J.-H. (2002). Viewing-Angle-Enhanced Integral Imaging by Lens Switching. Opt. Lett. 27, 818–820. doi:10.1364/ol.27.000818
Lee, B., Park, J.-H., and Min, S.-W. (2006). “Three-Dimensional Display Аnd Information Processing Based on Integral Imaging,” in Digital Holography and Three-Dimensional Display. Editor T.-C. Poon (Boston, MA: Springer), 333–379. doi:10.1007/0-387-31397-4_12
Luo, C.-G., Ji, C.-C., Wang, F.-N., Wang, Y.-Z., and Wang, Q.-H. (2012). Crosstalk-Free Integral Imaging Display with Wide Viewing Angle Using Periodic Black Mask. J. Disp. Technol. 8, 634–638. doi:10.1109/jdt.2012.2210193
Oh, Y., Shin, D., Lee, B.-G., Jeong, S.-I., and Choi, H.-J. (2014). Resolution-Enhanced Integral Imaging in Focal Mode with a Time-Multiplexed Electrical Mask Array. Opt. Express 22, 17620–17629. doi:10.1364/oe.22.017620
Okano, F., Hoshino, H., Arai, J., and Yuyama, I. (1997). Real-Time Pickup Method for a Three-Dimensional Image Based on Integral Photography. Appl. Opt. 36, 1598–1603. doi:10.1364/ao.36.001598
Park, J.-H., Kim, H.-R., Kim, Y., Kim, J., Hong, J., Lee, S.-D., et al. (2004). Depth-Enhanced Three-Dimensional-Two-Dimensional Convertible Display Based on Modified Integral Imaging. Opt. Lett. 29, 2734–2736. doi:10.1364/ol.29.002734
Park, J.-H., Kim, J., Kim, Y., and Lee, B. (2005). Resolution-Enhanced Three-Dimension/Two-Dimension Convertible Display Based on Integral Imaging. Opt. Express 13, 1875–1884. doi:10.1364/opex.13.001875
Keywords: integral imaging, 3D display, point light source, high-resolution, lens aberration
Citation: Cao Y, Chagnaadorj B-O, Dalkhaa N-E and Baasantseren G (2022) Aberration Compensated Point Light Source Display With High-Resolution. Front. Photonics 3:919050. doi: 10.3389/fphot.2022.919050
Received: 13 April 2022; Accepted: 09 May 2022;
Published: 16 June 2022.
Edited by:
Keehoon Hong, Electronics and Telecommunications Research Institute (ETRI), South KoreaReviewed by:
Yu Zhao, Yangzhou University, ChinaKihong Choi, Electronics and Telecommunications Research Institute, South Korea
Copyright © 2022 Cao, Chagnaadorj, Dalkhaa and Baasantseren. This is an open-access article distributed under the terms of the Creative Commons Attribution License (CC BY). The use, distribution or reproduction in other forums is permitted, provided the original author(s) and the copyright owner(s) are credited and that the original publication in this journal is cited, in accordance with accepted academic practice. No use, distribution or reproduction is permitted which does not comply with these terms.
*Correspondence: Ganbat Baasantseren, Z2FuYmF0YkBudW0uZWR1Lm1u