 Xuan Wu1,2
 Jacqueline Chua1,2,3Candice Ho1Xinwen Yao1,2
 Arumugam R. Muralidharan1
 Raymond P. Najjar1,3
 Gavin Tan1,3Ernst R. Tamm4Leopold Schmetterer1,2,3,5,6,7,8Veluchamy A. Barathi1,3,9*
 Bingyao Tan1,2*
- 1Singapore Eye Research Institute, Singapore National Eye Centre, Singapore, Singapore
- 2SERI-NTU Advanced Ocular Engineering (STANCE) Program, Nanyang Technological University, Singapore, Singapore
- 3Academic Clinical Program, Duke-NUS Medical School, Singapore, Singapore
- 4Institute of Human Anatomy and Embryology, University of Regensburg, Regensburg, Germany
- 5School of Chemical and Biomedical Engineering, Nanyang Technological University, Singapore, Singapore
- 6Department of Clinical Pharmacology, Medical University of Vienna, Vienna, Austria
- 7Center for Medical Physics and Biomedical Engineering, Medical University of Vienna, Vienna, Austria
- 8Institute of Molecular and Clinical Ophthalmology, Basel, Switzerland
- 9Department of Ophthalmology, Yong Loo Lin School of Medicine, National University of Singapore, Singapore, Singapore
The purpose of this study is to characterize the retinal and choroidal vascular networks in some of the most common animal species using swept-source optical coherence tomography angiography (SS-OCTA). Retinal angiographic images were acquired from healthy, anesthetized animals of seven species (mouse, rat, pig, rabbit, guinea pig, chicken, and non-human primate). We generated the enface angiograms to visualize the different retinal vascular plexuses and the choroidal vascular plexus. Quantitative OCTA metrics, including perfusion density, vessel density, and fractal dimension, were compared amongst the different species. There was a noticeable difference in the OCTA enface maps of the distinct vascular layers amongst the various species. Specifically, the non-human primate retina has the highest level of perfusion density and vessel density, whereas the rabbit retina exhibited the lowest level of vessel density. The mouse and the rat retina shared similar vascular patterns, and there was no difference in the OCTA metrics. Using one specific SS-OCTA system for all experiments eliminated multiple instrument-dependent factors, but the lateral resolution was still affected by eye size. Effects of varying lateral resolution on vascular metrics were investigated via a simulation. Overall, we achieved a large field of view of the distinct retinal and choroidal vascular plexuses and quantified the vascular metrics in multiple species, which could serve as protocol guidance and atlas to study the retinal and choroidal vascular abnormalities and their roles in ocular diseases resembling in-vivo histology.
Introduction
Vascular abnormalities are closely related to a myriad of retinal diseases, including age-related macular degeneration (Lim et al., 2012), diabetic retinopathy (Hwang et al., 2016; Tan et al., 2020a), and glaucoma (Liu et al., 2015), which are associated with the leading causes of blindness globally (Flaxman et al., 2017). Moreover, the neurosensory retina and its microvasculature are the only part of the central nervous system optically visualized. Hence, there is also considerable interest in imaging the retina to understand cerebral diseases such as dementia or Parkinson’s disease (Cheung et al., 2017; Matlach et al., 2018; Kreeke et al., 2019). Animal models are important experimental tools for elucidating the pathological mechanisms underlying these diseases, as well as developing and testing therapeutic strategies. The topographical vascular patterns in various species differ significantly. For example, rodents, non-human primates, and pigs have layered vascular plexuses, branching from the optic nerve head to support the inner retinal cells (holangiotic) (Provis, 2001; Kornfield and Newman, 2014; Fouquet et al., 2017; Pi et al., 2018; Smith et al., 2019; Cuenca et al., 2020). In rabbits and guinea pigs, on the contrary, the retinal flow is limited to a confined area around the optic nerve head and does not exhibit a layered structure (merangiotic and paurangiotic) (Sugiyama et al., 1992; Alkin et al., 2013; Jnawali et al., 2018). Avian species such as chicken have an avascular retina but dense choroidal perfusion that nourishes the retina via diffusion (anagiotic) (May, 2008; Wisely et al., 2017). A proper selection of animal models for different diseases requires an understanding of the retinal vascular pattern in the different species.
Histological approaches are commonly used to study the vascular changes post mortem (Snodderly et al., 1992; Tan et al., 2015; Selvam et al., 2018). Vessels are usually perfused by a combination of fluorescein and gelatin or labeled by antigens, and then imaged by fluorescein imaging modalities, such as confocal microscopy (Giannakaki-Zimmermann et al., 2016; Kaizu et al., 2017). Longitudinal follow-up is, however, not possible with these approaches and therefore not always reproducible and expensive. Fluorescein angiography (FA) (Spaide et al., 2015a; Abucham-Neto et al., 2018) and indocyanine green angiography (ICGA) (Spaide et al., 1996; Herbort et al., 1998; Kawali et al., 2017) enable tracking of the ocular vasculature in-vivo over time. However, FA has limited access to the choroidal circulation as a result of free permeation of fluorescein in choroidal vessels (Agarwal et al., 2018). In contrast, the ICGA can evaluate the choroidal vasculature, but the images are often difficult to interpret (Kawali et al., 2017). Furthermore, both FA and ICGA are time-consuming, invasive, and require an intravenous dyes. Most importantly, these techniques are limited to two-dimension and unable to resolve different vascular plexuses (Bonte et al., 1998).
Optical coherence tomography angiography (OCTA), a functional extension of OCT, is an emerging technology to detect the motion contrast from blood cells in repeated OCT scans and enables three-dimensional visualization of the retinal vasculature (de Carlo et al., 2015; Chen and Wang, 2017; Spaide et al., 2018; Chua et al., 2019). Compared with dye-based FA and ICGA approaches, OCTA is non-invasive, non-hazardous, easy and fast to apply, and provides a three-dimensional, high-resolution representation of the retinal vasculature, of which the plexuses are usually displayed in a two-dimensional (2D) and enface fashion. Its ability to provide the quantitative vascular density of the retinal and choroidal network also makes longitudinal studies on vascular abnormalities possible, which allows for in-vivo studies of disease progression (Park et al., 2016; Suh et al., 2016), as well as the optimization of pharmacological treatments (Lumbroso et al., 2015; Muakkassa et al., 2015).
Only a few studies have used the OCTA to image various animal models, such as rodents (Zhi et al., 2015; Alnawaiseh et al., 2016; Bernucci et al., 2018; Tan et al., 2018), non-human primates (Scoles et al., 2009; Sun et al., 2018; Tan et al., 2019a), cats (Wada et al., 2020) and zebrafishes (Bozic et al., 2018). OCTA imaging is technically more challenging than conventional OCT imaging, as it requires greater animal stabilization as well as eye and focus alignments. Furthermore, there is no consensus on OCTA metrics quantification, which is affected by different instrumental parameters, including incident power, imaging wavelengths, scanning speeds, fields of view, and optical resolutions (Salas et al., 2017; Tan et al., 2020b).
The main objective of the study is to characterize the retinal and choroidal vascular networks in seven commonly used laboratory animal types, namely rat, mouse, non-human primate, pig, rabbit, guinea pig and chicken, using a swept-source optical coherence tomography angiography (SS-OCTA) (PlexElite 9000, Zeiss Meditec, CA, United States). We explored the suitable image acquisition and processing protocol for each species. Moreover, we provided the OCTA quantitative metrics of the perfusion density, vessel density and fractal dimension of the distinct retinal vascular layers. This study could serve as protocol guidance and atlas for future studies examining vascular abnormality, disease identification, and drug response.
Methods
Animals Utilized
All animal procedures were conducted in accordance with the ARVO Statement for the Use of Animals in Ophthalmic and Vision Research and the SingHealth standard for responsible use of animals in research. The animal facility is accredited by the Association for Assessment and Accreditation of Laboratory Animal Care International (AAALAC), and the experimental preclinical testing protocols were approved by the Institutional Animal Care and Use Committee of SingHealth (Singapore). Seven different animal species were used, including cynomolgus macaque monkeys (N = 9, male and female, age range: 4–18 years), New Zealand white rabbit (N = 3, male, age range: 12–24 months), white Yorkshire pig (N = 4, male and female, age range: 2–14 months), Wistar and Brown Norway rat (N = 19, male, age range: 2–15 months), Elm Hill pigmented and Dunkin Hartley albino guinea pig (N = 7, male, age range: 1–4 months), and C57BL/6J mouse (N = 4, female, age range: 4–14 months) and Lohmann Brown chicken (N = 13, male, age range: 3 weeks).
Animal Preparation
Animals were given comprehensive ocular examinations, including anterior segment and fundus examination, to exclude any ocular disease before imaging. All the procedures were conducted while the animals were under anesthesia. Anesthesia details for each animal are listed in Table 1. Prior to imaging, pupils were dilated with 1 drop of 2.5% Phenylephrine Hydrochloride Ophthalmic Solution (Bausch and Lomb Pharmaceuticals, Inc., Tampa, FL, United States) and 1 drop of 1% Tropicamide (Alcon Laboratories Inc., Fort Worth, TX, United States) in all species but chicken. The eyelids were held open with customized lid speculums except for rodents, and all eyes were kept lubricated frequently using saline during the imaging.
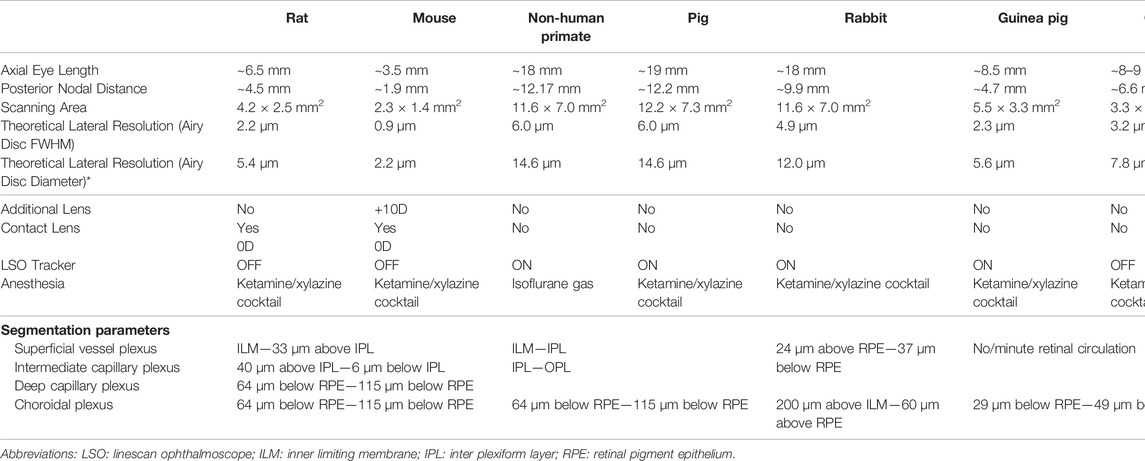
TABLE 1. Related animal information, imaging protocols, and post-processing protocols.
Tissue Dissection
Non-Human-Primates, Pigs and Rabbits
Eyes were embedded in paraffin or directly frozen (eyes injected with Cy5.5 labeled liposomes). For paraffin embedding, the enucleated rabbit eye was fixed in 10% neutral buffered formalin solution (Leica Surgipath, Leica Biosystems Richmond, Inc.) for 24 h. The whole rabbit eye was then dissected prior to dehydration in increasing ethanol concentrations, clearance in xylene, and embedding in paraffin (Leica-Surgipath, Leica Biosystems Richmond, Inc.). Five-micron sections were cut with a rotary microtome (RM2255, Leica Biosystems Nussloch GmbH, Germany) and collected on POLYSINETM microscope glass slides (Gerhard Menzel, Thermo Fisher Scientific, Newington, CT). The sections were dried in an oven of 37 °C for at least 24 h. To prepare the sections for histopathological and immunohistochemical examination, the sections were heated on a 60 °C heat plate, deparaffinized in xylene and rehydrated in decreasing ethanol concentration. A standard procedure for Hematoxylin and Eosin (H&E) was performed. A light microscope (Axioplan 2; Carl Zeiss Meditec GmbH, Oberkochen, Germany) was used to examine the slides and images were captured (Wong et al., 2018).
For Mice, Rats, Chickens and Guinea Pigs
The animals were euthanized with an intravenous injection of pentobarbital (100 mg/kg). Dissected eye cups were incubated in Perfix [4% paraformaldehyde (PFA), 20% isopropanol, 2% trichloroacetic acid, and 2% zinc chloride] for 24 h, dehydrated in graded alcohol series, and embedded in paraffin; 5-μm tissue sections were cut using a microtome (Leica Microsystems, Heidelberger, Germany) and placed on polylysine-coated glass slides. The slides were heated at 60°C for 30 min on a hot plate and stained with hematoxylin for 40 s and eosin for 25 s (Surgipath Europe Ltd., Peterborough, Cambridgeshire, UK). The tissue sections were washed in tap water, mounted with paramount and imaged under bright field using a Zeiss AX10 fluorescence microscope equipped with an AxioVision 4.7.1 Imaging System (Carl Zeiss Microscopy GmbH, Jena, Germany) (Su et al., 2016).
OCTA and Imaging Protocols
All images were acquired with a prototype SS-OCT system (PLEX Elite 9000, Carl Zeiss Meditec Inc., Dublin, California, United States). The built-in optical microangiography protocol enables the generation of volumetric angiographic images and structural OCT cross-sections (Wang et al., 2010; An et al., 2011). This instrument uses a swept-source laser operating at a central wavelength of 1,050 nm, allowing increased light penetration into deeper tissues and improved choroidal blood flow visualization. The A-scan rate of 100,000 Hz enables a short acquisition time and thus reduces motion artifacts. It provides a ∼6.3 µm axial resolution in tissue. The lateral resolution ∆x on the retina depends on the eye optics and can be defined as (Bille, 2019):
where
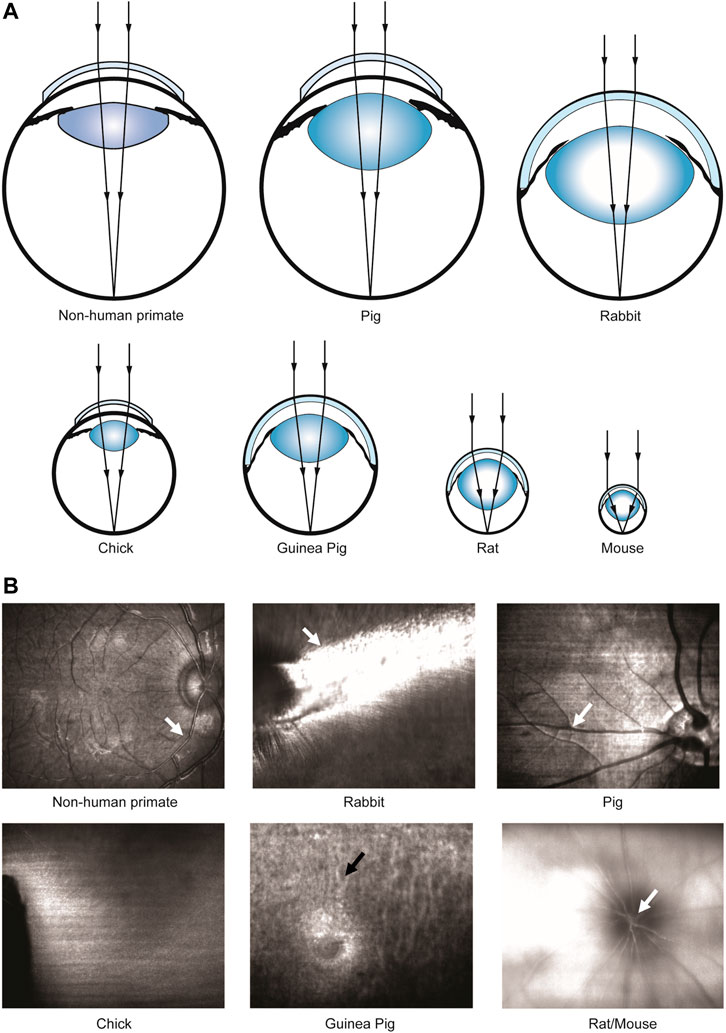
FIGURE 1. Scheme of beam focusing and different NAs of different animal species for retinal imaging. (A) Schematic of eye focusing on different animal species. (B) Enface line-scanning ophthalmoscope (LSO) images during focus tuning in different animal species. White arrows: strong reflection from superficial retinal blood vessels. Black arrow: choroidal vessels.
A line-scanning ophthalmoscope (LSO, λ = 750 nm) provided a real-time fundus view for alignment. The optical power of LSO was reduced from 1 mW to 580 µW for all animal species except for chicken to avoid saturation. Beam focus was tuned to achieve high visibility of large superficial vessels (white arrows, Figure 1B) or choroidal vessels (black arrows, Figure 1B) in species with or without retinal blood circulation. Retinal structures could only be visualized using a power of 1 mW. This is related to the lack of high pigmentation (Slijkerman et al., 2015) or retinal vessels in this species, so generally the reflectance from the posterior segment is weak. Moreover, an eye-tracking system based on the LSO channel was used to reduce motion artifacts during image acquisition. A 10 diopter (D) lens (Thorlabs, United States) was added for mouse imaging to better focus the laser onto the retinal periphery. A customized animal holder with five degrees of freedom (3 translational + 2 rotational) was employed for facilitating eye alignment. A built-in wide-field scanning protocol (15 mm × 9 mm) that covers ∼50 × 30 field of view (FOV) was applied for all the animals. Note that this 15 mm × 9 mm scanning area is intended for the human eye size, and the actual scanning area for each species was estimated according to the axial length of the eye (Table. 1). Each wide-field scan consisted of 500 A-scans per B-scan and 834 B-scans per volume, and the acquisition time for each volume was 10–15 s. A fine scan (3 mm × 3 mm) that covers 15° square FOV was applied further to unveil details in regions of interest (ROI), with 300 A-scans per B-scan, 300 B-scans per volume and 4–5 s acquisition time. The sampling rates, defined as the ratio between lateral resolution and step size between adjacent Ascans (Tan et al., 2019a), of a wide-field scan and fine scan were approximately 1.1 and 2, respectively.
Post Processing and Image Analysis
For layer segmentation, the acquired datasets were transferred to a review software (PlexElite Review Software, version 2.0, Zeiss Meditec, CA, United States). The post-processing steps were implemented as follows:
1. We used the pre-segmented four retinal layers [the Inner Limiting Membrane (ILM), Inner Plexiform Layer (IPL), Outer Plexiform Layer (OPL), and RPE] from the PlexElite Review Software as a guide. Afterwards, we manually modified the segmentation to match the retinal layers in histology. Two examples of layer segmentation pre- and post-manual correction are shown in Supplementary Figure S1.
2. One or several angiograms were identified for each species based on histology knowledge, and the segmentation details were included in Table 1. Three retinal plexuses and one choroid plexus were determined for rodents (Kornfield and Newman, 2014; Cuenca et al., 2020; Tan et al., 1167). The superficial vessel plexus (SVP) contains the large retinal blood vessels, arterioles and venules, and the capillaries in the retinal nerve fiber layer (RNFL) and ganglion cell layer (GCL). Intermediate capillary plexus (ICP) contains the capillaries in the IPL and deep capillary plexus (DCP) contains the capillaries of the most distal retinal vascular bed localized in the OPL. The retinal vasculature in non-human primates and pigs consists of four anatomical retinal plexuses (Fouquet et al., 2017; Lutty and McLeod, 2018; Selvam et al., 2018): radial peripapillary capillaries (RPC), SVP, ICP, and DCP. However, RPC and ICP were not delineated as regional layers and the instrument’s limited axial resolution and residual dispersion mismatch. Therefore, only two vascular plexuses: superficial vascular complex (SVC; a combination of RPC and SVP) and deep vascular complex (DCC; a combination of ICP and DCP) were extracted from the OCTA measurements (Provis, 2001; Fouquet et al., 2017). One retinal angiogram and one choroid plexus were extracted for rabbits (Sugiyama et al., 1992; Alkin et al., 2013). Both guinea pigs and chickens have rich choroidal circulation but no/minute retinal perfusion (Schaepdrijver et al., 1989; Rees and Bainbridge, 1992; Wisely et al., 2017), and only vertical blood vessels around the optic nerve head (ONH) of guinea pigs could be detected.
Different approaches were developed to visualize choroidal vasculature. In non-human primates, pigs and guinea pigs, only thick choroidal vessels are visualized and appear dark in OCT images. A slab was segmented in their structural OCT volumes ranging from RPE to choroidal-scleral interface, and a minimum projection was performed to project the dark vessels onto a 2D map. In chicken, choroidal vessels appear white, probably due to low RPE scattering; hence, a maximum projection was performed to project the “bright vessels” onto a 2D map. In rodents and rabbits, the choroidal layers are thin and hard to segment, so the choroidal vessel map was extracted on the sclera layer: a maximum projection on the OCTA sclera slab was performed to visualize the choroidal vessels’ shadows.
The segmented plexuses were exported to MATLAB (2018b, MathWorks, MA, United States) for further analysis. The retinal vasculature was binarized using a global threshold. These threshold values were selected to provide an optimized representation of the vasculature to match histology images. Perfusion density was calculated as the perfused area per imaged area. The binarized perfusion map was further skeletonized (Matlab function: bwmorph) to obtain a vessel map and vessel density was calculated as the vessel length per imaged area. Furthermore, fractal dimension using the Hausdorff (box-counting) method was computed. The entire binarized perfusion map was split into evenly spaced boxes with length s and the perfused area that could be covered by a minimum of
Choroidal vessels don’t form a parallel plexus organization with many axial orientated vessels that cannot be fully resolved by enface views, and they were extracted in different ways depending on the angioarchitecture. Hence, only a qualitative assessment of the choroidal vasculature was conducted here.
Lateral Resolution vs. Vascular Parameters
We simulated the effect of the lateral resolution on vascular parameters. High-resolution immunohistochemistry (IHC) images (N = 9) of the DCP in the mouse retina were used. The tissue was prepared following an IHC protocol described previously (Tan et al., 1167), and images were captured by a confocal microscope system (FV3000, Olympus) with 20X magnification (Numerical Aperture: 0.75, lateral resolution: 0.9 µm). A Gaussian kernel with different sizes convoluted IHC images to simulate varied lateral resolutions was used. Here, the lateral resolution was defined by the diameter of the Airy disc, and the Gaussian approximation of the Airy disc was adopted. Perfusion density, vessel density and fractal dimension were computed for each simulated lateral resolution.
Statistical Analysis
Data were analyzed using STATISTICA, version 8.0 (StateSoft, Inc., OK, United States). Primary outcomes were measurements of perfusion density, vessel density and fractal dimension. Outcome parameters were checked for normality using the Shapiro Wilk test. A one-way analysis of variance (ANOVA) was performed to compare the vascular metrics among species. The null hypothesis of the ANOVA analysis is that the OCTA metrics between species are similar, and a p-value less than 0.05 represents a rejection of this null hypothesis. Pairwise comparisons between species were performed using an independent t-test. We used a conservative Bonferroni correction to avoid α error accumulation due to multiple testing. A p-value < 0.05 was regarded as statistically significant and all the data were reported in a Mean ± Standard Deviation format.
Results
Rats and Mise
SS-OCT provided a sufficient axial resolution to resolve the retinal layers in both species (Tan et al., 1167; Ruggeri et al., 2007), except the external limiting membrane (ELM) that could not be identified (Figures 2A,I). They share a similar layered structure (Figures 2B,J) and high lateral resolution imaging in rodents enabled us to track the radial nerve fiber bundles from the enface structural images (blue arrows; Figures 2C,K). In the OCTA image, the holangiotic vascular pattern with its distinctive three capillary plexuses (Kornfield and Newman, 2014; Cuenca et al., 2020; Tan et al., 1167) could be visualized in the entire retina (Figures 2D,F–H and Figures 2L,O–Q). The vertical anastomosing capillaries connecting the plexuses were difficult to isolate in OCTA volume and were grouped into parallel plexuses. Two types of venules could be identified in OCTA SVP images from the mouse retina. Long venules extended to the retinal margin (red arrow, Figure 2O), whereas shorter venules drained the blood mainly from the deep and intermediate capillary plexuses (yellow arrows, Figure 2O,Q). By contrast, two types of venules could not be differentiated from the rat eye in OCTA images because of limited FOV.
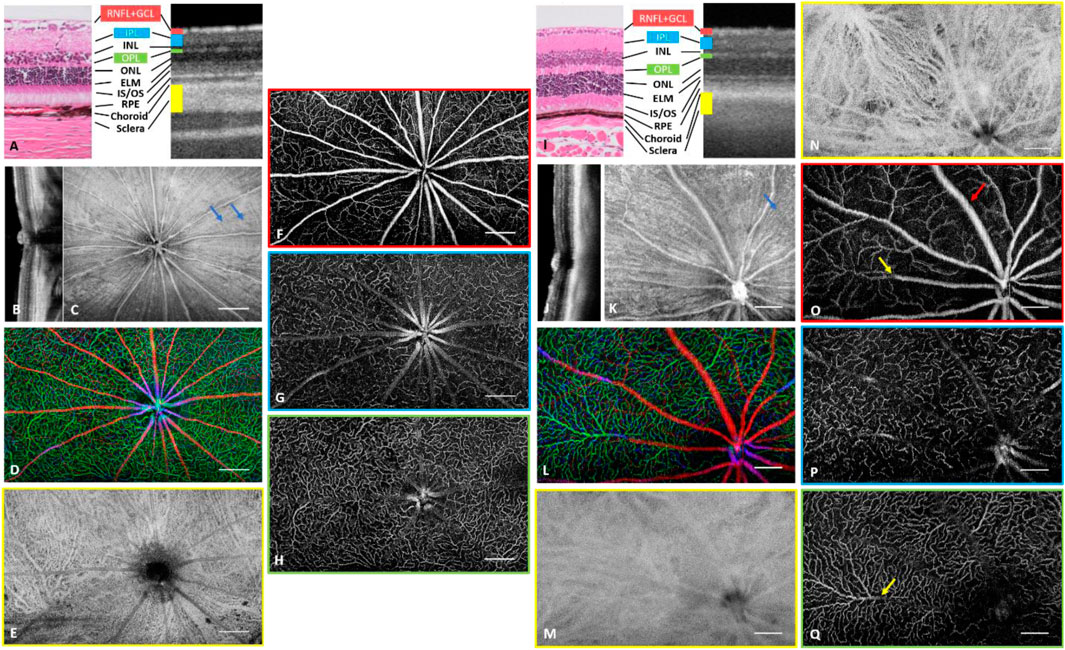
FIGURE 2. Depth-resolved angiographic and structural images of a rat eye (A–H) and a mouse eye (I–Q). (A) Comparison of histology with OCT cross-sectional image on distinguishable retinal layers. RNFL: Retinal Nerve Fiber Layer. GCL: ganglion cell layer. IPL: inner plexiform layer. INL: inner nuclear layer. OPL: outer plexiform layer. ONL: outer nuclear layer. ELM: External limiting membrane. IS: inner segment. OS: outer segment. RPE: retinal pigment epithelium. (B) Cross sectional OCT scan across optic nerve head (ONH). (C) Structural image from RNFL. The hyper reflection results from the surface reflection of the inner limiting membrane and the wall of the major blood vessels. (D) Depth coded retinal vasculature. Red: Superficial vascular plexus, Blue: Intermediate vascular plexus, Green: Deep vascular plexus. (E) Choroidal vascular plexus. (F) Superficial vascular plexus. (G) Intermediate vascular plexus. (H) Deep vascular plexus. (I) Comparison of histology with OCT cross-sectional image on distinguishable retinal layers. (J) Cross sectional OCT scan across ONH. (K) Structural image from RNFL. The hyperreflection results from surface reflection of inner limited membrane and vessel wall of major blood vessels. (L) Depth coded retinal vasculature. Red: Superficial vascular plexus, Blue: Intermediate vascular plexus, Green: Deep vascular plexus. (M, N) Choroidal vascular plexus with (M) and without (N) tight optical focus onto the plexus. (O) Superficial vascular plexus. Red arrow indicates a venule draining from the periphery and yellow arrow indicates a short venule. (P) Intermediate vascular plexus. (Q) Deep vascular plexus. Yellow arrow indicates the exit of blood from DCP to a superficial venule. Scale Bar: 0.5 mm (A–H), 0.25 mm (I–Q).
Using a human system to image rodents resulted in high NA imaging to resolve capillaries, especially in mice. However, adjusting the focus during such measurements was not easy because of the short depth of focus and strong chromatic aberration between LSO and OCT channels. Figure 2P,Q show angiograms of ICP and DCP with great sharpness where capillaries could be seen, which compromised the sharpness of the SVP (Figure 2O) and choroidal vessels (Figure 2M). In the rat eyes with lower NA and longer depth of focus, all retinal plexuses can appear sharp throughout one volume (Figures 2F–H).
Choroidal vessels, in contrast to retinal vessels, appeared dark in OCT images. Moreover, the attenuation coefficient in choroidal vessels is lower than that in connective tissue, and as such more photons penetrate the choroidal vessels and scatterer back from the static scleral tissue, which appears as bright projections of the choroidal vessels. OCTA signal from the rat sclera clearly showed the projection of choroidal vessels including choriocapillaris and larger choroidal arteries and veins (Figure 2E). Mouse choroidal vessels appeared blurred because of the focus on ICP and DCP as mentioned above. Focusing the light onto the choroidal layer resulted in clear visibility of choroidal arteries, veins and choriocapillaris, as shown in Figure 2N from another mouse.
Non-Human Primates
Wide-field images from one non-human primate eye are shown in Figures 3A–G. Structural comparison between B-scan and histology showed a clear delineation of nuclear layers, photoreceptor bands and choroid (Figure 3A and Anger et al., 2004). A wide-field cross-sectional OCT image across both the fovea and ONH (Figure 3B) reveals both retinal layers and deeper tissue such as the Lamina cribrosa (yellow arrow, Figure 3B) and part of the sclera, where shadows of the choroidal vessels appeared (red arrow, Figure 3B). The wide-field en face structural image displays the reflection from major superficial vessels and ILM (white arrow, Figure 3C). Moreover, high lateral resolution enabled the visualization of the papillomacular bundle coursing directly from the macula to OHN. The inferior and superior arcuate fibers met at the temporal horizontal raphe (black arrow, Figure 3C). Angiograms from retina/choroid and the SVC/DCC are shown in Figures 3D,E–G, respectively. Fine details of the vasculature in the periphery, the foveal region and the ONH area were zoomed-in Figures 3A–C,F. Moreover, the peripapillary SVC (Figures 3C,F) had a different vascular pattern with a radially oriented capillary network arranged in parallel with the NFL axons.
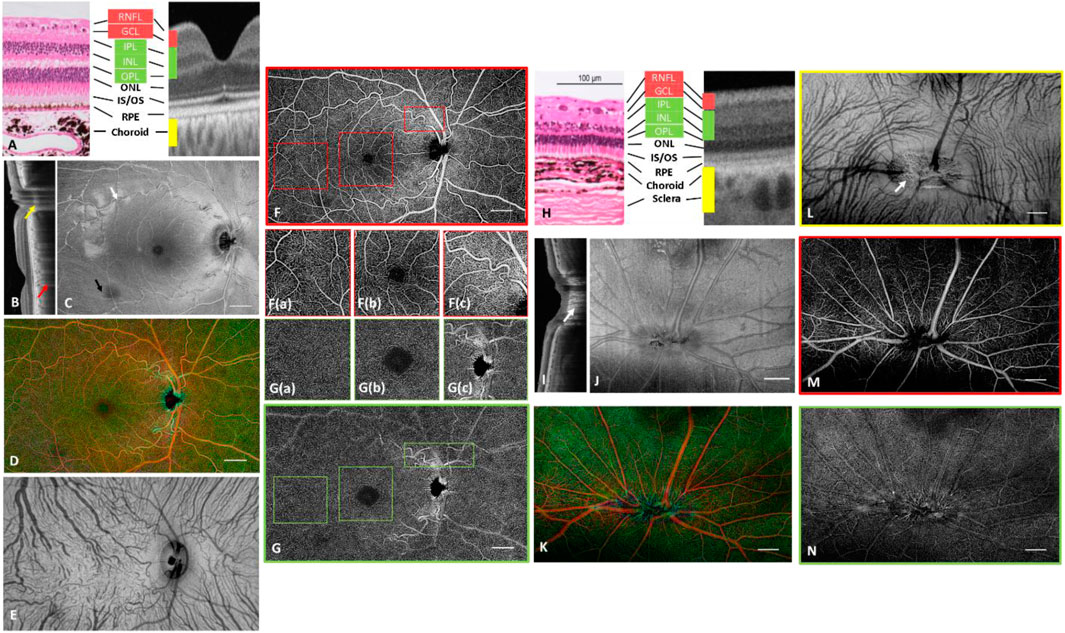
FIGURE 3. Depth-resolved angiographic and structural images from one non-human primate (A–G) and a pig (H–N). (A) Comparison of histology with OCT cross-sectional image on distinguishable retinal layers. (B) Wide-field cross sectional OCT scan showing both fovea and ONH. Red arrow: shadow of a choroidal vessel; Yellow arrow: Lamina cribrosa. (C) Structural image from RNFL. The hyperreflection results from surface reflection of the inner limited membrane and the vessel wall of major blood vessels. White arrow: surface reflection from ILM, Black arrow: nerve fiber bundle. (D) Depth coded retinal vasculature. Red: Superficial vascular complex, Green: Deep capillary complex. (E) Choroidal vascular plexus. (F) SVC. High magnification images of (a) the typical vascular pattern, (b) the parafoveal vascular pattern, (c) the radial peripapillary capillaries (RPCs) in SVC. (G) DCP. High magnification images of (a) the typical vascular pattern, (b) the parafoveal vascular pattern, (c) the peripapillary vascular pattern in DCC. (H) Comparison of histology with OCT cross-sectional image on distinguishable retinal layers. CC: choriocapillaris. (I) Cross sectional OCT scan across ONH. (J) Structural image from RNFL. The hyper-reflection results from the surface reflection of the inner limiting membrane and the vessel wall of major blood vessels. (K) Depth coded retinal vasculature. Red: Superficial vascular complex, Green: Deep capillary complex. (L) Choroidal vascular plexus with visualization of choroidal arteries and venules. (M) Superficial vascular complex. (N) Deep capillary complex. Scale Bar: 1 mm.
A wide-field OCTA image from the DCC is shown in Figure 3G, and details of the vasculature were zoomed-in Figures 3A–C,G. The DCC was arranged in lobular and tortuous patterns without directional preference, characterized by a mixture of vascular loops and “spider-like” structures (Provis, 2001). The superficial large blood vessels caused projection artifacts onto the deeper plexus which could be resolved in post processing (Zhang et al., 2016; Zhang et al., 2017). The performance of the vessel removing algorithm was better in the macula and periphery (Figures 3G(a,b)), but residual projection artifacts were still noticeable in the peripapillary area where the layered structure was more difficult to be precisely segmented and some of the major vessels had an axial orientation across different vascular plexuses.
Pigs
Representative wide-field images of a pig retina are shown in Figures 3H–N. Comparison with histology showed that all retinal layers can be visualized in the structural OCT images (Gloesmann et al., 2003) (Figure 3H). In addition, the structure of the lamina cribrosa was seen (white arrow; Figure 3I). The pig retina has a holangiotic vascular pattern without a fovea (Fouquet et al., 2017), but similar vascular plexuses to primates. Choroidal vessels could be observed from the structural image. Most of the vessels branched from inferior to superior and their diameters were larger in the nasal than in the temporal region. The minimum projection was adopted to visualize the choroidal vasculature. The pig’s large and oval optic disc enabled clear observation of the porous surface of the lamina cribrosa (white arrow; Figure 3L), as the shadowing arising from large vessels was mitigated compared to primates.
Rabbits
Representative wide-field OCT images of a rabbit eye are shown in Figure 4. The individual layers of the retina could be distinguished in the B-scan (Muraoka et al., 2012) of Figure 4A. However, the structure of the nuclear layers was less distinct than in other species, probably due to the insufficient axial resolution and less prominent differences in layer contrast. The histology in Figure 4A indicates that the New Zealand white rabbit’s nuclear layers (INL- ONL) are only ∼30–40 µm. The residual dispersion mismatch will worsen the axial resolution of ∼6.3 µm in tissue, making it difficult to resolve these layers. A cross-sectional image of the retina close to the ONH showed that the major retinal vessels were located within the inner surface of the retina and protruded far into the vitreous body (white arrows; Figure 4B). The dome-like thickened RNFL around the optic disc (asterisk) was evident as well (Kashani et al., 2011). The enface structural image (Figure 4C) shows the radially/horizontally oriented nerve fiber bundles (white arrow; Figure 4C) and vertically oriented choroidal vessels (black arrow; Figure 4C). A merangiotic retinal vascular pattern could be seen in the enface angiograms of the rabbit retina (Figure 4D). In contrast, all retinal vessels were confined to a broad horizontal band coincident with the area of dispersion of the myelinated nerve fibers extending from the optic disc to the equator (Sugiyama et al., 1992; Alkin et al., 2013). The hairpin-like capillary loops were only present in the peridiscal section of the vascularized area, while the peripheral capillaries consisted of vascular loops between neighboring arterioles and venules at the border of the vascularized area. Figure 4E shows an enface angiogram from the choroidal plexus. The choroidal vessels mostly ran perpendicular to the retinal vessels along the equator and both large choroidal veins and arteries (white arrow; Figure 4E) and the choriocapillaris could be differentiated (black arrow; Figure 4E).
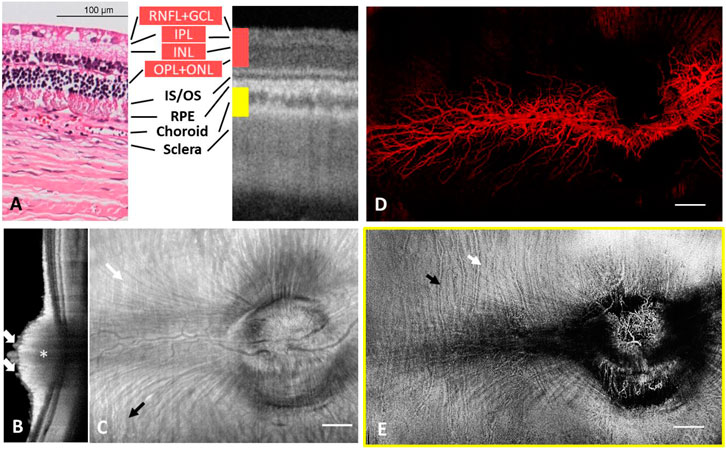
FIGURE 4. Depth-resolved angiographic and structural images from one rabbit. (A) Comparison of histology with OCT cross-sectional image on distinguishable retinal layers. (B) Cross sectional OCT scan across ONH. White arrow: retinal vessels. Asterisk: thickened RNFL. (C) Structural image from the whole eye. The hyperreflection results from reflection of the whole eye and vessel wall of major retinal and choroid blood vessels. White arrow: radially/horizontally oriented nerve fiber bundles. Black arrow: vertically oriented choroidal vessels. (D) Vasculature of the entire retina colour coded in red. (E) Choroidal vascular plexus. White arrow: large choroidal veins and arteries. Black arrow: choriocapillaris.
Guinea Pigs and Chickens
Figure 5 show wide-field images from a guinea pig eye and a chicken eye, respectively. Comparison of OCT cross-sections and histology revealed high similarity (Figures 5A,I) (Moayed et al., 2011; Jnawali et al., 2018). Deep tissue imaging enabled the visualization of both choroid and sclera, and in particular, the dual-layer sclera in chicken was distinguishable (Figures 5B,J). Spike-shaped nerve fiber bundles emanating from the ONH in guinea pigs could be easily identified with high contrast, making tracking of individual nerve fiber bundles possible (Figure 5C).
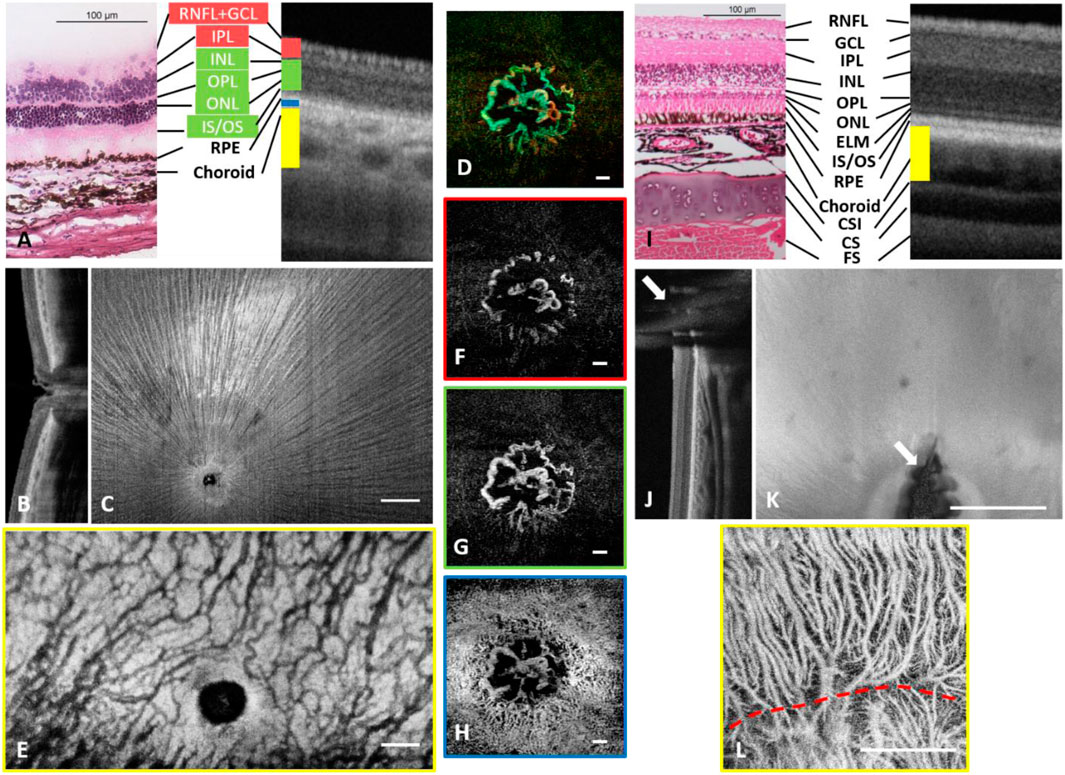
FIGURE 5. Depth-resolved angiographic and structural images from one guinea pig eye (A–H) and a chicken eye (I–L). (A) Comparison of histology with OCT cross-sectional image on distinguishable retinal layers. (B) Cross sectional OCT scan across ONH. (C) Structural image from RNFL. The hyperreflection results from the surface reflection of the inner limiting membrane and an uninterrupted view of nerve fibers radiating from the periphery to the optic disc. (D) Depth coded ONH vasculature. Red: Vessels around ONH in superficial plexus, Green: Vessels around ONH in deep plexus and avascular layer, Blue: Vessels around ONH in choroidal plexus. (E) Choroidal vascular plexus. High magnification images of (F) blood vessels around ONH in the superficial layer. (G) blood vessels around ONH in the deep and avascular layer. (H) choriocapillaris around the ONH. (I) Comparison of histology with OCT cross-sectional image on distinguishable retinal layers. CSI: Chorioscleral interface. CS: Cartilaginous sclera. FS: Fibrous sclera. (J) Cross-sectional OCT scan. White arrows: shadow of Pecten oculi. (K) Enface OCT scan. White arrows: shadow of Pecten oculi. (L) Choroidal vascular plexus. Scale Bar: 0.5 mm. Scale Bar: 1 mm (A–H), 0.5 mm (I–L).
Both species have no/minute retinal perfusion but a rich choroidal circulation (paurangiotic pattern for guinea pig retina and anangiotic pattern for chicken retina). Guinea pigs showed a circulation limited to the ONH (Figure 5D) aligned axially with limited visibility in OCTA angiograms (Figures 5F,G). These discal vessels ran vertically across the whole retina finally reaching the choroid (Schaepdrijver et al., 1989; Rees and Bainbridge, 1992). It was also noticed that the choriocapillaris could be observed and flow voids were large enough to be resolved from a finer scan (Figure 5H). Moreover, compared to other species, choroidal circulation in guinea pigs had higher tortuosity, and visually the vessels had less diameter variability than in other species (Figures 5H,E).
In chickens, blood flow in the Pecten oculi supplies the inner retina and choroidal circulation provides the nutrient and metabolic supply to the outer retina. The shadow of Pecten oculi can be visualized from cross-sectional and enface images (white arrows in Figures 5J,K). In the OCTA image, both large choroidal vessels and choriocapillaris could be visualized (Figure 5L). A “watershed” area could also be identified (red dashed line; Figure 5L) as a separation of blood vessels branched out from different choroidal arteries (Wisely et al., 2017).
Qualitative and Quantitative Comparisons
Quantitative OCTA analysis of retinal and choroidal vasculatures is essential to standardize objective interpretation of clinical outcomes, especially for determining disease progression or classification. Representative binarized perfusion maps from different species are shown in Supplementary Figure S2. Visually, the non-human primate retina was the most perfused, and both SVC and DCC are highly vascularized, whereas pig retina shows higher perfusion in the DCC than SVC. In rodents, binarized capillaries in ICP and DCP looked similar, while the defocused SVP in the mouse made binarized superficial capillaries appear thicker than that in the rat.
The quantitative OCTA metrics of the perfusion density, vessel density and fractal dimension are shown in Supplementary Table S1. Boxplots of vascular metrics comparisons from entire retinal angiograms are illustrated in Figure 6. There are significant interspecies differences in perfusion density, vessel density and fractal dimension (p < 0.001) assessed by the angiograms over the entire retina. Overall, the non-human primate retina had the highest level of perfusion density and vessel density (both p < 0.001), whereas the rabbit retina exhibited the lowest level of vessel density (p = 0.001). The mouse and rat retina shared similar vascular patterns and there was no difference in the OCTA metrics (p = 1.000). In Post Hoc comparison with Bonferroni correction, when the resultant p-value was >1, the software set an upper boundary of p = 1.000 on the probability.
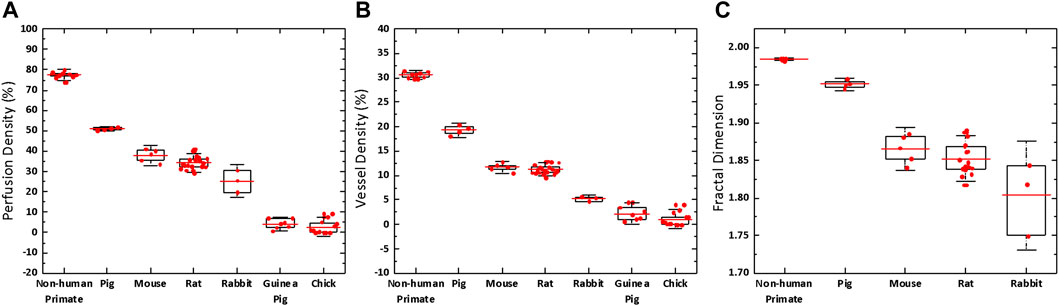
FIGURE 6. Boxplot of the retinal vascular metrics comparison between different species. There are significant interspecies differences in perfusion density (p < 0.001), vessel density (p < 0.001) and fractal dimension (p < 0.001) assessed by the angiograms over the entire retina. Red bar: mean value. Box edge: 25 and 75 percentiles. Whisker: 1.5 × standard deviation (SD).
Figure 7 illustrates the effect of lateral resolution on the three vascular metrics. Lower lateral resolution thickened the vessels and smoothened the edges in the images (Figures 7B–G). By simulating the lateral resolution from 1 to 15 µm, perfusion density and fractal dimension increased by ∼40% (Figure 7K) and ∼3.6% (Figure 7M), respectively, and vessel density decreased by ∼22% (Figure 7L). The decreased vessel density was due to failure to detect some capillaries (Insets of Figures 7H–J). In other words, taking lateral resolution into account, the absolute values of perfusion density in pig eyes should be 1.3–1.4 times of those in mouse eyes. The absolute values of vessel density should be 0.8–0.9 times lower, and fractal dimension ∼1.03 times higher.
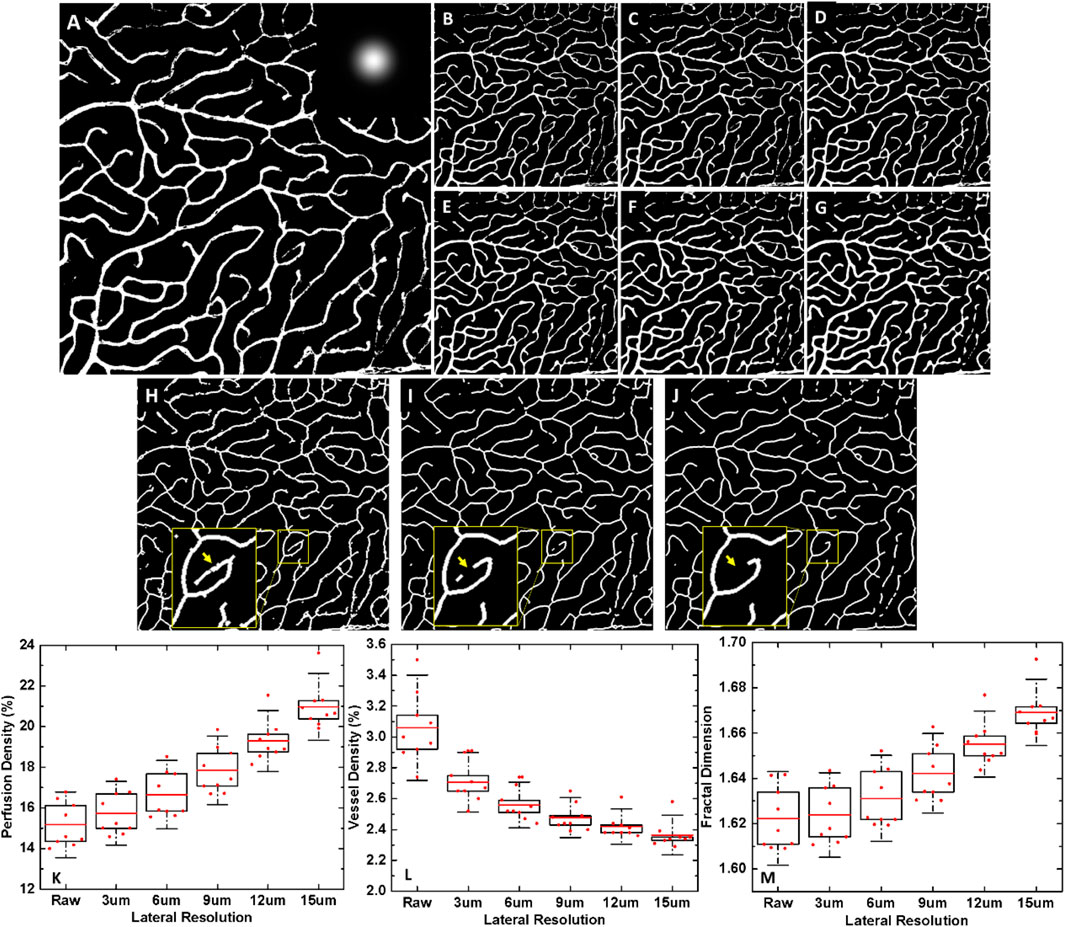
FIGURE 7. The effect of lateral resolutions on vascular metrics. (A) Binarized vasculature of the high-resolution confocal image of the deep vascular plexus in the mouse retina, pixel size: 1 um, 700 × 700 pixels. Inset: Gaussian kernel. Binarized vasculature at a simulated lateral resolution of (B) 1 µm. (Raw image) (C) 3 µm. (D) 6 µm. (E) 9 µm. (F) 12 µm. (G) 15 µm. Skeletonized vasculature (H) of the high-resolution confocal image of the deep vascular plexus in the mouse retina, and at a simulated lateral resolution of (I) 9 µm, (J) 15 µm. Insets: magnified views to show the failed detection of some capillaries with worsening lateral resolution, indicated by yellow arrows (K–M) Boxplots of three vascular parameters: perfusion density, vessel density and fractal dimension with respect to lateral resolution. Red bar: mean value. Box edge: 25 and 75 percentiles. Whisker: 1.5 × standard deviation (SD).
Discussion
In this study, we used the SS-OCTA machine to image the retinal and the choroidal vasculature of seven types of lab animals by modifying the commercial OCT prototype. We have also optimized the image formation processing protocol for each species, considering the angioarchitecture of the retina and choroid. With these modifications, we achieved high-quality images of retina and choroid in all the species, which can be valuable for future biomedical research in vascular ophthalmic pathologies.
Experimental models for various ocular diseases were developed in rats (Baba et al., 2010; Agarwal and Agarwal, 2017), mice (Maeda and Maeda, 2018), non-human primates (Harwerth, 2010; Grünert and Martin, 2020), pigs (Kyhn et al., 2009), rabbits (Wong et al., 2017; Tsujinaka et al., 2020), guinea pigs (Edwards, 1996; Chakraborty et al., 2020) and chickens (Wisely et al., 2017). Previous studies have used OCTA to visualize retinal and choroidal vessels in these species (Pi et al., 2018; Cuenca et al., 2020; Tan et al., 1167; Hosseinaee et al., 2018; Zhao et al., 2020; Kim et al., 2019; Tan et al., 2019b; Zhang et al., 2019) either with custom-built OCT prototypes or modified systems adapted for use in experimental animals. We show that the anatomical characteristics of posterior eye pole vasculature can be visualized and excellent quality images can be captured with the commercial SS-OCTA system. The layered arrangement of the retinal capillaries could be observed but the axial resolution of the OCTA system was not sufficient to delineate all plexuses, in particular for the non-human primates and pigs (Fouquet et al., 2017; Lutty and McLeod, 2018; Selvam et al., 2018). In the non-human primates and pigs, we could delineate SVP and DCP, whereas ICP could not be resolved. However, it was difficult to quantify the relationship between the axial resolution and plexuses delineation, as the inability to separate layers is a combination of low resolution and poor contrast. In OCT the axial resolution is dependent on the coherence length of the light source (Drexler and Fujimoto, 2008; Ang et al., 2018). When using OCT with a central wavelength of 800 nm, the high axial resolution of ∼1 µm (Bizheva et al., 2016; Werkmeister et al., 2017; Wang et al., 2019) can benefit the retinal imaging, but the high scattering from the RPE layer at this wavelength will lead to weaker signals and reduced visibility of the choroid.
Even though the vasculature of the different species is well-known by histology, it appears different on OCTA images (Yu et al., 2021). Despite tissue preparation-related causes, there are two remaining reasons. First, OCTA detects the motion contrast (e.g., moving red blood cells), and loss of OCTA signal does not necessarily indicate non-perfusion. It could also mean very slow blood flow–slower than the system threshold. Second, differences in lateral resolution resulting from interspecies differences in eye sizes can affect the OCTA images. On the other hand, the higher lateral resolution is accompanied by a shorter depth of focus, which is why not all layers can be captured in-focus in mouse OCTA scans.
Considerable efforts have been made to identify all layers as seen in OCT images and compare them with histology (Berger et al., 2014; Staurenghi et al., 2014; Xie et al., 2018). This has primarily facilitated the use of the technique in experimental animals. As for OCTA, additional methodological problems may occur and require case-by-case consideration. A detailed description of all artifacts in OCTA images has been provided previously (Spaide et al., 2015b; Ghasemi Falavarjani et al., 2017; Say et al., 2017; Spaide et al., 2018). Since OCTA is a decorrelation-based technique, it is sensitive to all types of sample movement. While motion artifact is common in humans, it can be significantly reduced with optimized animal restraints and anesthetic protocols in experimental animals. Projection artifacts are inevitable in OCTA images of the deeper layers. This is because the moving scatters at the top layers of the retina may cast a moving shadow in the deeper layers, both of which can be detected by OCTA. The system we used in the present study has an inbuilt function to remove projection artifacts, but it may not remove all large retinal vessel projections from deeper layers as clearly seen in the presented enface images.
OCTA artifacts are, however, an important feature to exploit when it comes to the choroid (Borrelli et al., 2018). The choroid consists of the larger vessels in the Haller’s and Sattler’s layer, and the choriocapillaris (Nickla and Wallman, 2010; Kur et al., 2012). The choriocapillaris has a thickness of approximately 10 µm in humans (Almeida et al., 2015) and is on the same order of the axial resolution. When the slab is selected to include the choriocapillaris, projection artifacts from retinal vessels are predominant. However, if the slab is moved slightly deeper to a hyperreflective layer, the choroidal microvasculature becomes visible.
The appearance of large choroidal vessels in structural OCT and OCTA is complex, and it depends on the thickness and arrangement of the choroidal vasculature (Lee et al., 2006; Yasuno et al., 2007; Hua et al., 2017; Saxena et al., 2021; Tan et al., 2020c). In general, there were three approaches to visualize choroidal vasculature: 1. Directly from its OCTA decorrelation signal; 2. From OCT structural contrast; 3. From its projected decorrelation signal on the scleral layer. Different scattering properties of the RPE in inter-species affect visualization of choroidal vessels using OCTA, but there is no experimental evidence for this hypothesis. In non-human primates, pigs and guinea pigs, light backscattered from the choroidal vessels is too weak to generate a reliable decorrelation signal for OCTA. This observation is supported by the visibility of large choroidal vessels in patients with geographic atrophy (Todisco et al., 2016; Qin et al., 2018). In rodents, a relative thin choroidal layer allows the vascular OCTA signal to project onto the sclera, which can be assessed indirectly. It is worth noticing that the protocols designed for naïve animals could change in animal diseases models, especially with RPE or choroidal thickness change. Nevertheless, our study may provide a starting point for the choroidal imaging in various models of eye diseases such as age-related macular degeneration (Bhutto and Lutty, 2012), polypoidal choroidal vasculopathy (Baek et al., 2018), central serous chorioretinopathy (Daruich et al., 2015) and high myopia (Morgan et al., 2012), where the choroid is a major pathophysiological factor.
The present study also provided quantitative metrics to characterize the differences in retinal vascular supply between species. In past literature, various approaches have been proposed for quantifying retinal perfusion based on OCTA (Tan et al., 2020b). We chose measures including perfusion density, vessel density and fractal dimension to provide stable and reproducible outcomes. The present metrics quantify the inter-species differences as expected from anatomy, including the highest vessel density in the non-human primate. The comparison of OCTA metrics between species in the current study is robust. The same OCTA machine was used, removing any machine-dependent factors such as instrument-dependent wavelength, speed, and optical power. The sampling frequency is also a factor of OCTA metrics. Increasing the oversampling ratio leads to an improved lateral resolution in smaller eyes (Bousi et al., 2017). However, sampling frequency is similar in different species using the same scanning protocol because the field of view and lateral resolution are both proportional to eye sizes. Nevertheless, the quantitative metrics remains affected by the different lateral resolution, and a compensation scheme is needed when comparing the OCTA metrics with different lateral resolutions.
The strength of this study is to use a single SS-OCT machine to assess retinal and choroidal vasculature in seven types of lab animals, which could rule out the effects from system and software parameters. There are some limitations. First, the sample size and the age span of some species are limited. Second, although we explored the most suitable imaging protocols, not all the options were exhausted, such as different contact lenses.
Conclusion
In conclusion, we investigated the depth-resolved vascular plexuses in both retina and choroid in seven common animal species for eye research, using a commercially available SS-OCT prototype. Taking into consideration the different eye sizes ranging from 3 to 25 mm, the differences in optical media, and the particularities of the vascular supply in each of these species, we were able to characterize the choroidal and retinal vascular networks, including the vascular patterns, distinct layers of vascular plexuses with specific structures, as well as the local vascular variations of the retinal vasculature plexuses. A three-index quantitative analysis was performed as well, for image interpretation and facilitating vascular abnormality identification in the future. The work presented in this paper can serve as a basis for future projects looking into longitudinal vascular changes in a wide variety of animal types. Our data indicate that the OCTA based on the presented protocols can become a widely used tool in vasculature-related biomedical eye research.
Data Availability Statement
The original contributions presented in the study are included in the article/Supplementary Material, further inquiries can be directed to the corresponding authors.
Ethics Statement
The animal study was reviewed and approved by the Institutional Animal Care and Use Committee of SingHealth (Singapore).
Author Contributions
VB, LS and BT conceived the study. XW, CH, AM and BT performed the study. XW, BT, JC, CH, XY, AM, RN, GT and ET analyzed and interpreted the data. XW and BT wrote the draft. All authors reviewed the final manuscript.
Funding
This work was funded by grants from the National Medical Research Council (CG/C010A/2017_SERI; CG-INCEPTOR/Pre-Clinical Core Platform/2017_SERI; OFIRG/0048/2017; OFLCG/004c/2018; TA/MOH-000249-00/2018; MOH-OFIRG20nov-0014 and NMRC/CG2/004b/2022-SERI), National Research Foundation Singapore (NRF2019-THE002-0006 and NRF-CRP24-2020-0001), A*STAR (A20H4b0141), the Singapore Eye Research Institute and Nanyang Technological University (SERI-NTU Advanced Ocular Engineering (STANCE) Program), the Duke-NUS Medical School (Duke-NUS-KP(Coll)/2018/0009A), and the SERI-Lee Foundation (LF1019-1) Singapore. The equipment used for experiments reported in this paper were supported by the IAF-ICP/JJVC-2019.
Conflict of Interest
The authors declare that the research was conducted in the absence of any commercial or financial relationships that could be construed as a potential conflict of interest.
Publisher’s Note
All claims expressed in this article are solely those of the authors and do not necessarily represent those of their affiliated organizations, or those of the publisher, the editors and the reviewers. Any product that may be evaluated in this article, or claim that may be made by its manufacturer, is not guaranteed or endorsed by the publisher.
Acknowledgments
We would like to acknowledge Kai Ying Teo for the assistance of animal imaging.
Supplementary Material
The Supplementary Material for this article can be found online at: https://www.frontiersin.org/articles/10.3389/fphot.2022.867594/full#supplementary-material
References
Abucham-Neto, J. Z., Torricelli, A. A. M., Lui, A. C. F., Guimarães, S. N., Nascimento, H., and Regatieri, C. V. (2018). Comparison between Optical Coherence Tomography Angiography and Fluorescein Angiography Findings in Retinal Vasculitis. Int. J. Retin. Vitr. 4, 15. doi:10.1186/s40942-018-0117-z
Agarwal, A., Invernizzi, A., Singh, R. B., Foulsham, W., Aggarwal, K., Handa, S., et al. (2018). An Update on Inflammatory Choroidal Neovascularization: Epidemiology, Multimodal Imaging, and Management. J. Ophthal Inflamm. Infect. 8, 13. doi:10.1186/s12348-018-0155-6
Agarwal, R., and Agarwal, P. (2017). Rodent Models of Glaucoma and Their Applicability for Drug Discovery. Expert Opin. Drug Discov. 12, 261–270. doi:10.1080/17460441.2017.1281244
Alkin, Z., Kashani, A. H., López-Jaime, G. R., Ruiz García, H., Humayun, M. S., and Sadda, S. R. (2013). Quantitative Analysis of Retinal Structures Using Spectral Domain Optical Coherence Tomography in normal Rabbits. Curr. Eye Res. 38, 299–304. doi:10.3109/02713683.2012.757625
Almeida, D. R. P., Zhang, L., Chin, E. K., Mullins, R. F., Kucukevcilioglu, M., Critser, D. B., et al. (2015). Comparison of Retinal and Choriocapillaris Thicknesses Following Sitting to Supine Transition in Healthy Individuals and Patients with Age-Related Macular Degeneration. JAMA Ophthalmol. 133, 297. doi:10.1001/jamaophthalmol.2014.5168
Alnawaiseh, M., Rosentreter, A., Hillmann, A., Alex, A. F., Niekämper, D., Heiduschka, P., et al. (2016). OCT Angiography in the Mouse: A Novel Evaluation Method for Vascular Pathologies of the Mouse Retina. Exp. Eye Res. 145, 417–423. doi:10.1016/j.exer.2016.02.01210.1016/j.exer.2016.02.012
An, L., Shen, T. T., and Wang, R. K. (2011). Using Ultrahigh Sensitive Optical Microangiography to Achieve Comprehensive Depth Resolved Microvasculature Mapping for Human Retina. J. Biomed. Opt. 16, 106013. doi:10.1117/1.3642638
Ang, M., Baskaran, M., Werkmeister, R. M., Chua, J., Schmidl, D., Aranha dos Santos, V., et al. (2018). Anterior Segment Optical Coherence Tomography. Prog. Retin. Eye Res. 66, 132–156. doi:10.1016/j.preteyeres.2018.04.00210.1016/j.preteyeres.2018.04.002
Anger, E. M., Unterhuber, A., Hermann, B., Sattmann, H., Schubert, C., Morgan, J. E., et al. (2004). Ultrahigh Resolution Optical Coherence Tomography of the Monkey Fovea. Identification of Retinal Sublayers by Correlation with Semithin Histology Sections. Exp. Eye Res. 78, 1117–1125. doi:10.1016/j.exer.2004.01.011
Baba, T., Bhutto, I. A., Merges, C., Grebe, R., Emmert, D., McLeod, D. S., et al. (2010). A Rat Model for Choroidal Neovascularization Using Subretinal Lipid Hydroperoxide Injection. Am. J. Pathol. 176, 3085–3097. doi:10.2353/ajpath.2010.09098910.2353/ajpath.2010.090989
Baek, J., Lee, J. H., Jung, B. J., Kook, L., and Lee, W. K. (2018). Morphologic Features of Large Choroidal Vessel Layer: Age-Related Macular Degeneration, Polypoidal Choroidal Vasculopathy, and central Serous Chorioretinopathy. Graefes Arch. Clin. Exp. Ophthalmol. 256, 2309–2317. doi:10.1007/s00417-018-4143-1
Berger, A., Cavallero, S., Dominguez, E., Barbe, P., Simonutti, M., Sahel, J.-A., et al. (2014). Spectral-domain Optical Coherence Tomography of the Rodent Eye: Highlighting Layers of the Outer Retina Using Signal Averaging and Comparison with Histology. PLoS One 9, e96494. doi:10.1371/journal.pone.0096494
Bernucci, M. T., Merkle, C. W., and Srinivasan, V. J. (2018). Investigation of Artifacts in Retinal and Choroidal OCT Angiography with a Contrast Agent. Biomed. Opt. Express 9, 1020–1040. doi:10.1364/BOE.9.001020
Bhutto, I., and Lutty, G. (2012). Understanding Age-Related Macular Degeneration (AMD): Relationships between the Photoreceptor/retinal Pigment epithelium/Bruch's Membrane/choriocapillaris Complex. Mol. Aspects Med. 33, 295–317. doi:10.1016/j.mam.2012.04.00510.1016/j.mam.2012.04.005
Bille, J. F. (2019). High Resolution Imaging in Microscopy and Ophthalmology: New Frontiers in Biomedical Optics. Springer.
Bizheva, K., Haines, L., Mason, E., MacLellan, B., Tan, B., Hileeto, D., et al. (2016). Vivo Imaging and Morphometry of the Human Pre-descemet's Layer and Endothelium with Ultrahigh-Resolution Optical Coherence Tomography. Invest. Ophthalmol. Vis. Sci. 57, 2782–2787. doi:10.1167/iovs.15-18936
Bonte, C. A., Ceuppens, J., and Leys, A. M. (1998). Hypotensive Shock as a Complication of Infracyanine green Injection. Retina 18, 476–477. doi:10.1097/00006982-199805000-00018
Borrelli, E., Sarraf, D., Freund, K. B., and Sadda, S. R. (2018). OCT Angiography and Evaluation of the Choroid and Choroidal Vascular Disorders. Prog. Retin. Eye Res. 67, 30–55. doi:10.1016/j.preteyeres.2018.07.002
Bousi, E., Zouvani, I., and Pitris, C. (2017). Lateral Resolution Improvement of Oversampled OCT Images Using Capon Estimation of Weighted Subvolume Contribution. Biomed. Opt. Express 8, 1319. doi:10.1364/BOE.8.001319
Bozic, I., Li, X., and Tao, Y. (2018). Quantitative Biometry of Zebrafish Retinal Vasculature Using Optical Coherence Tomographic Angiography. Biomed. Opt. Express 9, 1244. doi:10.1364/boe.9.00124410.1364/boe.9.001244
Chakraborty, R., Ostrin, L. A., Benavente‐perez, A., and Verkicharla, P. K. (2020). Optical Mechanisms Regulating Emmetropisation and Refractive Errors: Evidence from Animal Models. Clin. Exp. Optom. 103, 55–67. doi:10.1111/cxo.12991
Chen, C.-L., and Wang, R. K. (2017). Optical Coherence Tomography Based Angiography [Invited]. Biomed. Opt. Express 8, 1056–1082. doi:10.1364/BOE.8.001056
Cheung, C. Y.-l., Ikram, M. K., Chen, C., and Wong, T. Y. (2017). Imaging Retina to Study Dementia and Stroke. Prog. Retin. Eye Res. 57, 89–107. doi:10.1016/j.preteyeres.2017.01.00110.1016/j.preteyeres.2017.01.001
Chua, J., Tan, B., Ang, M., Nongpiur, M. E., Tan, A. C., Najjar, R. P., et al. (2019). Future Clinical Applicability of Optical Coherence Tomography Angiography. Clin. Exp. Optom. 102, 260–269. doi:10.1111/cxo.12854
Cuenca, N., Ortuño-Lizarán, I., Sánchez-Sáez, X., Kutsyr, O., Albertos-Arranz, H., Fernández-Sánchez, L., et al. (2020). Interpretation of OCT and OCTA Images from a Histological Approach: Clinical and Experimental Implications. Prog. Retin. Eye Res. 77, 100828. doi:10.1016/j.preteyeres.2019.100828
Daruich, A., Matet, A., Dirani, A., Bousquet, E., Zhao, M., Farman, N., et al. (2015). Central Serous Chorioretinopathy: Recent Findings and New Physiopathology Hypothesis. Prog. Retin. Eye Res. 48, 82–118. doi:10.1016/j.preteyeres.2015.05.00310.1016/j.preteyeres.2015.05.003
de Carlo, T. E., Romano, A., Waheed, N. K., and Duker, J. S. (2015). A Review of Optical Coherence Tomography Angiography (OCTA). Int. J. Retin. Vitr. 1, 5. doi:10.1186/s40942-015-0005-8
Drexler, W., and Fujimoto, J. (2008). State-of-the-art Retinal Optical Coherence Tomography. Prog. Retin. Eye Res. 27, 45–88. doi:10.1016/j.preteyeres.2007.07.00510.1016/j.preteyeres.2007.07.005
Edwards, M. H. (1996). Animal Models of Myopia. A Review. Acta Ophthalmol. Scand. 74, 213–219. doi:10.1111/j.1600-0420.1996.tb00078.x
Flaxman, S. R., Bourne, R. R. A., Resnikoff, S., Ackland, P., Braithwaite, T., Cicinelli, M. V., et al. (2017). Global Causes of Blindness and Distance Vision Impairment 1990-2020: a Systematic Review and Meta-Analysis. Lancet Glob. Health 5, e1221. doi:10.1016/S2214-109X(17)30393-5
Fouquet, S., Vacca, O., Sennlaub, F., and Paques, M. (2017). The 3D Retinal Capillary Circulation in Pigs Reveals a Predominant Serial Organization. Invest. Ophthalmol. Vis. Sci. 58, 5754–5763. doi:10.1167/iovs.17-22097
Ghasemi Falavarjani, K., Al-Sheikh, M., Akil, H., and Sadda, S. R. (2017). Image Artefacts in Swept-Source Optical Coherence Tomography Angiography. Br. J. Ophthalmol. 101, 564–568. doi:10.1136/bjophthalmol-2016-30910410.1136/bjophthalmol-2016-309104
Giannakaki-Zimmermann, H., Kokona, D., Wolf, S., Ebneter, A., and Zinkernagel, M. S. (2016). Optical Coherence Tomography Angiography in Mice: Comparison with Confocal Scanning Laser Microscopy and Fluorescein Angiography. Trans. Vis. Sci. Tech. 5, 11. doi:10.1167/tvst.5.4.11
Gloesmann, M., Hermann, B., Schubert, C., Sattmann, H., Ahnelt, P. K., and Drexler, W. (2003). Histologic Correlation of Pig Retina Radial Stratification with Ultrahigh-Resolution Optical Coherence Tomography. Invest. Ophthalmol. Vis. Sci. 44, 1696–1703. doi:10.1167/iovs.02-0654
Grünert, U., and Martin, P. R. (2020). Cell Types and Cell Circuits in Human and Non-human Primate Retina. Prog. Retin. Eye Res. 78, 100844. doi:10.1016/j.preteyeres.2020.100844
Harwerth, R. S. (2010). Primate Glaucoma Models. Neuromethods, 165–189. doi:10.1007/978-1-60761-541-5_9
Herbort, C. P., LeHoang, P., and Guex-Crosier, Y. (1998). Schematic Interpretation of Indocyanine green Angiography in Posterior Uveitis Using a Standard Angiographic Protocol. Ophthalmology 105, 432–440. doi:10.1016/s0161-6420(98)93024-x
Hosseinaee, Z., Tan, B., Martinez, A., and Bizheva, K. K. (2018). Comparative Study of Optical Coherence Tomography Angiography and Phase-Resolved Doppler Optical Coherence Tomography for Measurement of Retinal Blood Vessels Caliber. Trans. Vis. Sci. Tech. 7, 18. doi:10.1167/tvst.7.4.18
Hua, R., and Wang, H. (2017). Dark Signals in the Choroidal Vasculature on Optical Coherence Tomography Angiography: An Artefact or Not? J. Ophthalmol. 2017, 1–8. doi:10.1155/2017/5498125
Hughes, A. (1972). A Schematic Eye for the Rabbit. Vis. Res. 12, 123–IN6. doi:10.1016/0042-6989(72)90143-5
Hughes, A. (1979). A Schematic Eye for the Rat. Vis. Res 19 (5), 569–588. doi:10.1016/0042-6989(79)90143-3
Hwang, T. S., Gao, S. S., Liu, L., Lauer, A. K., Bailey, S. T., Flaxel, C. J., et al. (2016). Automated Quantification of Capillary Nonperfusion Using Optical Coherence Tomography Angiography in Diabetic Retinopathy. JAMA Ophthalmol. 134, 367–373. doi:10.1001/jamaophthalmol.2015.5658
Jnawali, A., Beach, K. M., and Ostrin, L. A. (2018). In Vivo imaging of the Retina, Choroid, and Optic Nerve Head in guinea Pigs. Curr. Eye Res. 43, 1006–1018. doi:10.1080/02713683.2018.1464195
Kaizu, Y., Nakao, S., Wada, I., Yamaguchi, M., Fujiwara, K., Yoshida, S., et al. (2017). Imaging of Retinal Vascular Layers: Adaptive Optics Scanning Laser Ophthalmoscopy versus Optical Coherence Tomography Angiography. Trans. Vis. Sci. Tech. 6, 2. doi:10.1167/tvst.6.5.2
Kashani, A. H., Kirkman, E., Martin, G., and Humayun, M. S. (2011). Hyperspectral Computed Tomographic Imaging Spectroscopy of Vascular Oxygen Gradients in the Rabbit Retina In Vivo. PLoS One 6, e24482. doi:10.1371/journal.pone.002448210.1371/journal.pone.0024482
Kawali, A., Pichi, F., Avadhani, K., Invernizzi, A., Hashimoto, Y., and Mahendradas, P. (2017). Multimodal Imaging of the normal Eye. Ocul. Immunol. Inflamm. 25, 726–736. doi:10.1080/09273948.2017.1375531
Kim, T.-H., Son, T., Le, D., and Yao, X. (2019). Longitudinal OCT and OCTA Monitoring Reveals Accelerated Regression of Hyaloid Vessels in Retinal Degeneration 10 (Rd10) Mice. Sci. Rep. 9, 16685. doi:10.1038/s41598-019-53082-9
Kornfield, T. E., and Newman, E. A. (2014). Regulation of Blood Flow in the Retinal Trilaminar Vascular Network. J. Neurosci. 34, 11504–11513. doi:10.1523/jneurosci.1971-14.2014
Kreeke, J. A., Nguyen, H. T., Haan, J., Konijnenberg, E., Tomassen, J., Braber, A., et al. (2019). Retinal Layer Thickness in Preclinical Alzheimer's Disease. Acta Ophthalmol. 97, 798–804. doi:10.1111/aos.1412110.1111/aos.14121
Kur, J., Newman, E. A., and Chan-Ling, T. (2012). Cellular and Physiological Mechanisms Underlying Blood Flow Regulation in the Retina and Choroid in Health and Disease. Prog. Retin. Eye Res. 31, 377–406. doi:10.1016/j.preteyeres.2012.04.004
Kyhn, M. V., Klassen, H., Johansson, U. E., Warfvinge, K., Lavik, E., Kiilgaard, J. F., et al. (2009). Delayed Administration of Glial Cell Line-Derived Neurotrophic Factor (GDNF) Protects Retinal Ganglion Cells in a Pig Model of Acute Retinal Ischemia. Exp. Eye Res. 89, 1012–1020. doi:10.1016/j.exer.2009.08.014
Lapuerta, P., and Schein, S. J. (1995). A Four-Surface Schematic Eye of Macaque Monkey Obtained by an Optical Method. Vis. Res. 35, 2245–2254. doi:10.1016/0042-6989(94)00320-L
Lee, E. C. W., de Boer, J. F., Mujat, M., Lim, H., and Yun, S. H. (2006). In Vivo optical Frequency Domain Imaging of Human Retina and Choroid. Opt. Express 14, 4403–4411. doi:10.1364/oe.14.004403
Lim, L. S., Mitchell, P., Seddon, J. M., Holz, F. G., and Wong, T. Y. (2012). Age-related Macular Degeneration. Lancet. doi:10.1016/S0140-6736(12)60282-710.1016/S0140-6736(12)60282-7
Liu, L., Jia, Y., Takusagawa, H. L., Pechauer, A. D., Edmunds, B., Lombardi, L., et al. (2015). Optical Coherence Tomography Angiography of the Peripapillary Retina in Glaucoma. JAMA Ophthalmol. 133, 1045–1052. doi:10.1001/jamaophthalmol.2015.2225
Lumbroso, B., Rispoli, M., and Savastano, M. C. (2015). Longitudinal Optical Coherence Tomography-Angiography Study of Type 2 Naive Choroidal Neovascularization Early Response after Treatment. Retina 35, 2242–2251. doi:10.1097/IAE.000000000000087910.1097/IAE.0000000000000879
Lutty, G. A., and McLeod, D. S. (2018). Development of the Hyaloid, Choroidal and Retinal Vasculatures in the Fetal Human Eye. Prog. Retin. Eye Res. 62, 58–76. doi:10.1016/j.preteyeres.2017.10.00110.1016/j.preteyeres.2017.10.001
Maeda, A., and Maeda, T. (2018). “Modeling Retinal Diseases Using Genetic Approaches in Mice,” in Methods in Molecular Biology, 41–59. doi:10.1007/978-1-4939-7720-8_3
Matlach, J., Wagner, M., Malzahn, U., Schmidtmann, I., Steigerwald, F., Musacchio, T., et al. (2018). Retinal Changes in Parkinson’s Disease and Glaucoma. Park. Relat. Disord. 56, 41–46. doi:10.1016/j.parkreldis.2018.06.016
May, C. A. (2008). Comparative Anatomy of the Optic Nerve Head and Inner Retina in Non-primate Animal Models Used for Glaucoma Research. Toophtj 2, 94–101. doi:10.2174/1874364100802010094
Moayed, A. A., Hariri, S., Song, E. S., Choh, V., and Bizheva, K. (2011). In Vivo volumetric Imaging of Chicken Retina with Ultrahigh-Resolution Spectral Domain Optical Coherence Tomography. Biomed. Opt. Express 2, 1268–1274. doi:10.1364/boe.2.001268
Morgan, I. G., Ohno-Matsui, K., and Saw, S.-M. (2012). Myopia. The Lancet 379, 1739–1748. doi:10.1016/s0140-6736(12)60272-4
Muakkassa, N. W., Chin, A. T., de Carlo, T., Klein, K. A., Baumal, C. R., Witkin, A. J., et al. (2015). Characterizing the Effect of Anti-vascular Endothelial Growth Factor Therapy on Treatment-Naive Choroidal Neovascularization Using Optical Coherence Tomography Angiography. Retina 35, 2252–2259. doi:10.1097/IAE.000000000000083610.1097/IAE.0000000000000836
Muraoka, Y., Ikeda, H. O., Nakano, N., Hangai, M., Toda, Y., Okamoto-Furuta, K., et al. (2012). Real-time Imaging of Rabbit Retina with Retinal Degeneration by Using Spectral-Domain Optical Coherence Tomography. PLoS One 7, e36135. doi:10.1371/journal.pone.0036135
Nickla, D. L., and Wallman, J. (2010). The Multifunctional Choroid. Prog. Retin. Eye Res. 29, 144–168. doi:10.1016/j.preteyeres.2009.12.002
Park, J. R., Choi, W., Hong, H. K., Kim, Y., Jun Park, S., Hwang, Y., et al. (2016). Imaging Laser-Induced Choroidal Neovascularization in the Rodent Retina Using Optical Coherence Tomography Angiography. Invest. Ophthalmol. Vis. Sci. 57, OCT331. doi:10.1167/iovs.15-1894610.1167/iovs.15-18946
Pi, S., Camino, A., Wei, X., Simonett, J., Cepurna, W., Huang, D., et al. (2018). Rodent Retinal Circulation Organization and Oxygen Metabolism Revealed by Visible-Light Optical Coherence Tomography. Biomed. Opt. Express 9, 5851–5862. doi:10.1364/boe.9.005851
Provis, J. (2001). Development of the Primate Retinal Vasculature. Prog. Retin. Eye Res. 20, 799–821. doi:10.1016/s1350-9462(01)00012-x
Qin, J., Rinella, N., Zhang, Q., Zhou, H., Wong, J., Deiner, M., et al. (2018). OCT Angiography and Cone Photoreceptor Imaging in Geographic Atrophy. Invest. Ophthalmol. Vis. Sci. 59, 5985. doi:10.1167/iovs.18-2503210.1167/iovs.18-25032
Rees, S., and Bainbridge, A. (1992). The Structural and Neurochemical Development of the Fetal guinea Pig Retina and Optic Nerve in Experimental Growth Retardation. Int. J. Dev. Neurosci. 10, 93–101. doi:10.1016/0736-5748(92)90010-w
Ruggeri, M., Wehbe, H., Jiao, S., Gregori, G., Jockovich, M. E., Hackam, A., et al. (2007). Vivo Three-Dimensional High-Resolution Imaging of Rodent Retina with Spectral-Domain Optical Coherence Tomography. Invest. Ophthalmol. Vis. Sci. 48, 1808–1814. doi:10.1167/iovs.06-0815
Salas, M., Augustin, M., Ginner, L., Kumar, A., Baumann, B., Leitgeb, R., et al. (2017). Visualization of Micro-capillaries Using Optical Coherence Tomography Angiography with and without Adaptive Optics. Biomed. Opt. Express 8, 207. doi:10.1364/boe.8.00020710.1364/boe.8.000207
Saxena, A., Yao, X., Wong, D., Chua, J., Ang, M., Hoang, Q. V., et al. (2021). Framework for Quantitative Three-Dimensional Choroidal Vasculature Analysis Using Optical Coherence Tomography. Biomed. Opt. Express 12, 4982. doi:10.1364/boe.426093
Say, E. A. T., Ferenczy, S., Magrath, G. N., Samara, W. A., Khoo, C. T. L., and Shields, C. L. (2017). Image Quality and Artifacts on Optical Coherence Tomography Angiography. Retina 37, 1660–1673. doi:10.1097/iae.0000000000001414
Schaeffel, F., Glasser, A., and Howland, H. C. (1988). Accommodation, Refractive Error and Eye Growth in Chickens. Vis. Res. 28, 639–657. doi:10.1016/0042-6989(88)90113-7
Schaepdrijver, L. D., Simoens, P., Lauwers, H., and Geest, J. P. D. (1989). Retinal Vascular Patterns in Domestic Animals. Res. Vet. Sci. 47, 34–42. doi:10.1016/s0034-5288(18)31228-1
Schmucker, C., and Schaeffel, F. (2004). A Paraxial Schematic Eye Model for the Growing C57BL/6 Mouse. Vis. Res. 44, 1857–1867. doi:10.1016/j.visres.2004.03.011
Scoles, D., Gray, D. C., Hunter, J. J., Wolfe, R., Gee, B. P., Geng, Y., et al. (2009). In-vivo Imaging of Retinal Nerve Fiber Layer Vasculature: Imaging Histology Comparison. BMC Ophthalmol. 9, 9. doi:10.1186/1471-2415-9-9
Selvam, S., Kumar, T., and Fruttiger, M. (2018). Retinal Vasculature Development in Health and Disease. Prog. Retin. Eye Res. 63, 1–19. doi:10.1016/j.preteyeres.2017.11.001
Slijkerman, R. W. N., Song, F., Astuti, G. D. N., Huynen, M. A., van Wijk, E., Stieger, K., et al. (2015). The Pros and Cons of Vertebrate Animal Models for Functional and Therapeutic Research on Inherited Retinal Dystrophies. Prog. Retin. Eye Res. 48, 137–159. doi:10.1016/j.preteyeres.2015.04.004
Smith, C. A., Hooper, M. L., and Chauhan, B. C. (2019). Optical Coherence Tomography Angiography in Mice: Quantitative Analysis after Experimental Models of Retinal Damage. Invest. Ophthalmol. Vis. Sci. 60, 1556–1565. doi:10.1167/iovs.18-26441
Snodderly, D., Weinhaus, R., and Choi, J. (1992). Neural-vascular Relationships in central Retina of Macaque Monkeys (Macaca fascicularis). J. Neurosci. 12, 1169–1193. doi:10.1523/jneurosci.12-04-01169.1992
Spaide, R. F., Fujimoto, J. G., and Waheed, N. K. (2015). Image Artifacts in Optical Coherence Tomography Angiography. Retina 35, 2163–2180. doi:10.1097/iae.0000000000000765
Spaide, R. F., Fujimoto, J. G., Waheed, N. K., Sadda, S. R., and Staurenghi, G. (2018). Optical Coherence Tomography Angiography. Prog. Retin. Eye Res. 64, 1–55. doi:10.1016/j.preteyeres.2017.11.00310.1016/j.preteyeres.2017.11.003
Spaide, R. F., Hall, L., Haas, A., Campeas, L., Yannuzzi, L. A., Fisher, Y. L., et al. (1996). Indocyanine green Videoangiography of Older Patients with central Serous Chorioretinopathy. Retina 16, 203–213. doi:10.1097/00006982-199616030-00004
Spaide, R. F., Klancnik, J. M., and Cooney, M. J. (2015). Retinal Vascular Layers Imaged by Fluorescein Angiography and Optical Coherence Tomography Angiography. JAMA Ophthalmol. 133, 45–50. doi:10.1001/jamaophthalmol.2014.3616
Staurenghi, G., Sadda, S., Chakravarthy, U., and Spaide, R. F. (2014). Proposed Lexicon for Anatomic Landmarks in Normal Posterior Segment Spectral-Domain Optical Coherence Tomography. Ophthalmology 121, 1572–1578. doi:10.1016/j.ophtha.2014.02.023
Su, X., Tan, Q. S. W., Parikh, B. H., Tan, A., Mehta, M. N., Sia Wey, Y., et al. (2016). Characterization of Fatty Acid Binding Protein 7 (FABP7) in the Murine Retina. Invest. Ophthalmol. Vis. Sci. 57, 3397–3408. doi:10.1167/iovs.15-18542
Sugiyama, K., Bacon, D. R., Morrison, J. C., and Van Buskirk, E. M. (1992). Optic Nerve Head Microvasculature of the Rabbit Eye. Invest. Ophthalmol. Vis. Sci. 33, 2251–2261.
Suh, M. H., Zangwill, L. M., Manalastas, P. I. C., Belghith, A., Yarmohammadi, A., Medeiros, F. A., et al. (2016). Deep Retinal Layer Microvasculature Dropout Detected by the Optical Coherence Tomography Angiography in Glaucoma. Ophthalmology 123, 2509–2518. doi:10.1016/j.ophtha.2016.09.002
Sun, M., Zhang, F., Ouyang, B., Wang, M., Li, Y., Jiao, X., et al. (2018). Study of Retina and Choroid Biological Parameters of Rhesus Monkeys Eyes on Scleral Collagen Cross-Linking by Riboflavin and Ultraviolet A. PLoS One 13, e0192718. doi:10.1371/journal.pone.0192718
Tan, B., Chua, J., Barathi, V. A., Baskaran, M., Chan, A., Lin, E., et al. (2019). Quantitative Analysis of Choriocapillaris in Non-human Primates Using Swept-Source Optical Coherence Tomography Angiography (SS-OCTA). Biomed. Opt. Express 10, 356–371. doi:10.1364/BOE.10.000356
Tan, B., Sim, R., Chua, J., Wong, D. W. K., Yao, X., Garhöfer, G., et al. (2020). Approaches to Quantify Optical Coherence Tomography Angiography Metrics. Ann. Transl. Med. 8, 1205. doi:10.21037/atm-20-3246
Tan, B., Barathi, V. A., Lin, E., Hom, C., Gan, A., Yao, X., et al. Longitudinal Structural and Microvascular Observation in RCS Rat Eyes Using Optical Coherence Tomography Angiography. Invest. Ophthalmol. Vis. Sci. 61 (6), 54. doi:10.1167/iovs.61.6.54
Tan, B., Chua, J., Barathi, V. A., Baskaran, M., Chan, A., Lin, E., et al. (2019). Quantitative Analysis of Choriocapillaris in Non-human Primates Using Swept-Source Optical Coherence Tomography Angiography (SS-OCTA). Biomed. Opt. Express 10, 356. doi:10.1364/boe.10.00035610.1364/boe.10.000356
Tan, B., Chua, J., Lin, E., Cheng, J., Gan, A., Yao, X., et al. (2020). Quantitative Microvascular Analysis with Wide-Field Optical Coherence Tomography Angiography in Eyes with Diabetic Retinopathy. JAMA Netw. Open 3, e1919469. doi:10.1001/jamanetworkopen.2019.19469
Tan, B., MacLellan, B., Mason, E., and Bizheva, K. (2018). Structural, Functional and Blood Perfusion Changes in the Rat Retina Associated with Elevated Intraocular Pressure, Measured Simultaneously with a Combined OCT+ERG System. PLoS One 13, e0193592. doi:10.1371/journal.pone.0193592
Tan, B., Wong, D. W. K., Yow, A. P., Yao, X., and Schmetterer, L. (2020). “Three-dimensional Choroidal Vessel Network Quantification Using Swept Source Optical Coherence Tomography,” in 2020 42nd Annual International Conference of the IEEE Engineering in Medicine & Biology Society (EMBC) 1883–1886 (IEEE). doi:10.1109/embc44109.2020.9175242
Tan, P. E. Z., Balaratnasingam, C., Xu, J., Mammo, Z., Han, S. X., Mackenzie, P., et al. (2015). Quantitative Comparison of Retinal Capillary Images Derived by Speckle Variance Optical Coherence Tomography with Histology. Invest. Ophthalmol. Vis. Sci. 56, 3989–3996. doi:10.1167/iovs.14-15879
Todisco, L., Capuano, V., Costanzo, E., Recupero, S. M., Souied, E. H., and Querques, G. (2016). Hyperreflective Choroidal Vessels in Geographic Atrophy Secondary to Age-Related Macular Degeneration. Ophthalmic Surg. Lasers Imaging Retina 47, 1106–1114. doi:10.3928/23258160-20161130-0410.3928/23258160-20161130-04
Tsujinaka, H., Fu, J., Shen, J., Yu, Y., Hafiz, Z., Kays, J., et al. (2020). Sustained Treatment of Retinal Vascular Diseases with Self-Aggregating Sunitinib Microparticles. Nat. Commun. 11 (–13), 694. doi:10.1038/s41467-020-14340-x
Wada, T., Song, Y., Oomae, T., Sogawa, K., Yoshioka, T., Nakabayashi, S., et al. (2020). Longitudinal Changes in Retinal Blood Flow in a Feline Retinal Vein Occlusion Model as Measured by Doppler Optical Coherence Tomography and Optical Coherence Tomography Angiography. Invest. Ophthalmol. Vis. Sci. 61, 34. doi:10.1167/iovs.61.2.3410.1167/iovs.61.2.34
Wang, R. K., An, L., Francis, P., and Wilson, D. J. (2010). Depth-resolved Imaging of Capillary Networks in Retina and Choroid Using Ultrahigh Sensitive Optical Microangiography. Opt. Lett. 35, 1467–1469. doi:10.1364/OL.35.001467
Wang, T.-A., Chan, M.-C., Lee, H.-C., Lee, C.-Y., and Tsai, M.-T. (2019). Ultrahigh-resolution Optical Coherence Tomography/angiography with an Economic and Compact Supercontinuum Laser. Biomed. Opt. Express 10, 5687. doi:10.1364/boe.10.00568710.1364/boe.10.005687
Werkmeister, R. M., Sapeta, S., Schmidl, D., Garhöfer, G., Schmidinger, G., Aranha dos Santos, V., et al. (2017). Ultrahigh-resolution OCT Imaging of the Human Cornea. Biomed. Opt. Express 8, 1221. doi:10.1364/boe.8.00122110.1364/boe.8.001221
Wisely, C. E., Sayed, J. A., Tamez, H., Zelinka, C., Abdel-Rahman, M. H., Fischer, A. J., et al. (2017). The Chick Eye in Vision Research: an Excellent Model for the Study of Ocular Disease. Prog. Retin. Eye Res. 61, 72–97. doi:10.1016/j.preteyeres.2017.06.004
Wong, C. G., Taban, M., Osann, K., Ross-Cisneros, F. N., Bruice, T. C., Zahn, G., et al. (2017). Subchoroidal Release of VEGF and bFGF Produces Choroidal Neovascularization in Rabbit. Curr. Eye Res. 42, 237–243. doi:10.1080/02713683.2016.1227448
Wong, C. W., Czarny, B., Metselaar, J. M., Ho, C., Ng, S. R., Barathi, A. V., et al. (2018). Evaluation of Subconjunctival Liposomal Steroids for the Treatment of Experimental Uveitis. Sci. Rep. 8. doi:10.1038/s41598-018-24545-210.1038/s41598-018-24545-2
Xie, W., Zhao, M., Tsai, S.-H., Burkes, W. L., Potts, L. B., Xu, W., et al. (2018). Correlation of Spectral Domain Optical Coherence Tomography with Histology and Electron Microscopy in the Porcine Retina. Exp. Eye Res. 177, 181–190. doi:10.1016/j.exer.2018.08.003
Yasuno, Y., Hong, Y., Makita, S., Yamanari, M., Akiba, M., Miura, M., et al. (2007). Vivo High-Contrast Imaging of Deep Posterior Eye by 1-microm Swept Source Optical Coherence Tomography and Scattering Optical Coherence Angiography. Opt. Express 15 (10), 6121–6139. doi:10.1364/oe.15.006121
Yu, P. K., Mehnert, A., Athwal, A., Sarunic, M. V., and Yu, D.-Y. (2021). Use of the Retinal Vascular Histology to Validate an Optical Coherence Tomography Angiography Technique. Trans. Vis. Sci. Tech. 10, 29. doi:10.1167/tvst.10.1.29
Zeng, G., Bowrey, H. E., Fang, J., Qi, Y., and McFadden, S. A. (2013). The Development of Eye Shape and the Origin of Lower Field Myopia in the guinea Pig Eye. Vis. Res. 76, 77–88. doi:10.1016/j.visres.2012.10.002
Zhang, M., Hwang, T. S., Campbell, J. P., Bailey, S. T., Wilson, D. J., Huang, D., et al. (2016). Projection-resolved Optical Coherence Tomographic Angiography. Biomed. Opt. Express 7, 816. doi:10.1364/boe.7.000816
Zhang, Q., Zhang, A., Lee, C. S., Lee, A. Y., Rezaei, K. A., Roisman, L., et al. (2017). Projection Artifact Removal Improves Visualization and Quantitation of Macular Neovascularization Imaged by Optical Coherence Tomography Angiography. Ophthalmol. Retina 1, 124–136. doi:10.1016/j.oret.2016.08.005
Zhang, S., Zhang, G., Zhou, X., Xu, R., Wang, S., Guan, Z., et al. (2019). Changes in Choroidal Thickness and Choroidal Blood Perfusion in Guinea Pig Myopia. Invest. Ophthalmol. Vis. Sci. 60, 3074. doi:10.1167/iovs.18-2639710.1167/iovs.18-26397
Zhao, D., He, Z., Wang, L., Fortune, B., Lim, J. K. H., Wong, V. H. Y., et al. (2020). Response of the Trilaminar Retinal Vessel Network to Intraocular Pressure Elevation in Rat Eyes. Invest. Ophthalmol. Vis. Sci. 61, 2. doi:10.1167/iovs.61.2.210.1167/iovs.61.2.2
Zhi, Z., Cepurna, W., Johnson, E., Jayaram, H., Morrison, J., and Wang, R. K. (2015). Evaluation of the Effect of Elevated Intraocular Pressure and Reduced Ocular Perfusion Pressure on Retinal Capillary Bed Filling and Total Retinal Blood Flow in Rats by OMAG/OCT. Microvasc. Res. 101, 86–95. doi:10.1016/j.mvr.2015.07.001
Keywords: optical coherence tomograph angiography, retinal vasculature, animal models, choroidal vasculature, optical coherence tomography, lab animals
Citation: Wu X, Chua J, Ho C, Yao X, Muralidharan AR, Najjar RP, Tan G, Tamm ER, Schmetterer L, Barathi VA and Tan B (2022) In-Vivo Imaging of Ocular Microvasculature Using Swept-Source Optical Coherence Tomography Angiography in Seven Types of Lab Animals. Front. Photonics 3:867594. doi: 10.3389/fphot.2022.867594
Received: 01 February 2022; Accepted: 15 March 2022;
Published: 26 April 2022.
Edited by:
Mengyang Liu, Medical University of Vienna, AustriaReviewed by:
Qian Li, Medical University of Vienna, AustriaDanielle Harper, Harvard Medical School, United States
Copyright © 2022 Wu, Chua, Ho, Yao, Muralidharan, Najjar, Tan, Tamm, Schmetterer, Barathi and Tan. This is an open-access article distributed under the terms of the Creative Commons Attribution License (CC BY). The use, distribution or reproduction in other forums is permitted, provided the original author(s) and the copyright owner(s) are credited and that the original publication in this journal is cited, in accordance with accepted academic practice. No use, distribution or reproduction is permitted which does not comply with these terms.
*Correspondence: Veluchamy A. Barathi, YW11dGhhLmIudmVsdWNoYW15QHNlcmkuY29tLnNn; Bingyao Tan, YmluZ3lhby50YW5AbnR1LmVkdS5zZw==