 Wenjing Zhou
 Shili Liu
 Chen Wang1
 Ting-Chung Poon
- 1Department of Precision Mechanical Engineering, Shanghai University, Shanghai, China
- 2Department of Engineering Technology, Middle Tennessee State University, Murfreesboro, TN, United States
- 3Bradley Department of Electrical and Computer Engineering, Virginia Tech, Blacksburg, VA, United States
We propose to reconstruct 3D images by combining the merits of transport of intensity and digital holography. The proposed method solves the transport-of-intensity equation by using digital holographic reconstructed images as inputs. Our simulation and experimental results show that this method can eliminate quadratic phase aberration introduced by the microscope objective in digital holographic microscopy. This proposed phase retrieval method is free of phase unwrapping process. It is thus efficient in removing quadratic phase aberration introduced by the microscope objective.
1 Introduction
Holography was invented in 1948 by Dennis Gabor (1948) to improve the resolution of an electron microscope. Leith and Upatnieks (1964) proposed off-axis illumination with an off-axis reference beam, thus eliminating the spectral overlap of the zeroth-order beam and the twin image inherent in Gabor’s in-line configuration. Schnars and Jüptner (1994) first used a CCD camera to capture a hologram and subsequently reconstruct the hologram numerically. They termed the technique as Digital Holography (DH).
In order to improve the transverse resolution of holographic measurements, digital holographic microscopy (DHM) was developed. In combination with microscopy, DHM provides label-free, quantitative phase imaging (Cuche et al., 1999; Mann et al., 2005). Even though DHM has significant advantages such as being simple, non-intrusive, and dynamic. However, quadratic phase aberration introduced by the microscope objective is a great issue (Zuo et al., 2013a). In addressing this issue, quadratic error compensation method has been applied (Zhou et al., 2009). It includes an optical design compensation (Rappaz et al., 2005) such as the use of a telecentric architecture (Sánchez-Ortiga et al., 2011) and a tunable lens compensation (Deng et al., 2017). The removal of quadratic phase aberration by software-based methods has also been investigated (Liu et al., 2018). Computer simulations of quadratic phase compensation (Colomb et al., 2006; Wang et al., 2019), least squares surface fitting compensation (Di et al., 2009), and automatic spectral energy analysis (Liu et al., 2014) have also been proven successfully. Most recently, deep learning compensation based on convolutional neural network has also shown great success (Nguyen et al., 2017). While these methods are promising, they mostly involve post processing steps for the quadratic phase removal, e.g., after holographic reconstruction. It is also feasible that intensity images can be reconstructed from a digital hologram to provide inputs for the transport-of-intensity equation (TIE) for unwrapped phase recovery. By doing this, we avoid shifting the sample or the camera in the experiment (Yan et al., 2019). In this research, we combine DH and TIE (DH-TIE) algorithm with regularization parameters. The TIE is a second-order elliptic partial differential equation for the phase φ. We use a fast method based on FFT to solve the TIE. Within the method of DH-TIE, a single hologram can provide phase retrieval without phase unwrapping (Zhou et al., 2018; Yan et al., 2019; Zuo et al., 2020; Lu et al., 2021).
Many scholars have combined digital holography and TIE in many applications. In the works by Zuo et al., TIE was invoked following the numerical reconstruction and propagation of the digital hologram, and the absolute phase without 2π discontinuities has been directly recovered (Zuo et al., 2013b). Whittkopp et al. described a microscopic setup implementing phase imaging by DHM and TIE, which allowed the results of both measurements to be quantitatively compared for either live cell or static samples (Wittkopp et al., 2020). Gupta et al. combined TIE with DH to overcome the artifacts caused by TIE phase recovery under low-light conditions by reconstructing the desired multiple out-of-focus intensity maps from the captured coaxial digital holograms (Gupta et al., 2020; Gupta and Nishchal, 2021). Kelly et al. (2013) compared Fresnel-based digital holography and phase retrieval from TIE. All these studies provide a lot of new ideas and methods for DH-TIE applications. In this paper, we employ the technique of DH-TIE to eliminate quadratic phase aberration introduced by a microscope objective in DHM. However, a suitable regularization parameter
2 Key Formulas of DH-TIE Algorithm
In DH, a laser beam illuminates an object and the amplitude (
In DHM (Figure 1), the object wave is magnified on the holographic plane by a microscope objective (MO), and the image of the object beam satisfies the rule of lens imaging. The wavefront of the object wave therefore contains an additional quadratic phase aberration introduced by the microscope objective and is given by
where
where
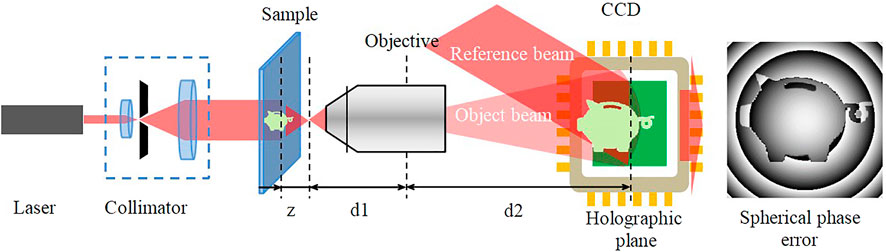
FIGURE 1. Diagram of digital holographic plane microscopy.
For off-axis holography, the digital hologram is generated through the interference between the object wave and the reference wave given by
where
Finally, the complex amplitude distribution of the original sample needs to be calculated by a convolution formula under paraxial approximations based on Kirchhoff scalar diffraction (Poon and Liu, 2014). The diffraction process can be regarded as a linear and space invariant system. After illuminating the hologram with
where
is the point spread function in free space. Note that the quadratic phase aberration,
where
Figure 1 shows a diagram of the digital holographic microscopy system. The laser passes through the beam collimator and is divided into two beams, one of which passes through the object sample and is magnified by the microscope, and the other, which does not pass through the object, is served as a reference beam at the CCD to obtain the hologram of the sample. Furthermore in Figure 1, z is the reconstruction distance, d1 is the object distance, and d2 is the image distance.
The transport-of-intensity equation (TIE) is an elliptic partial differential equation (Zuo et al., 2014). In order to improve the speed of solving the equation, it can be approximated by the following Poisson equation:
where
where
3 Simulation Analysis
We have simulated a sine grating as a sample. The sinusoidal grating is expressed as follows:
The wavelength used is 632.8
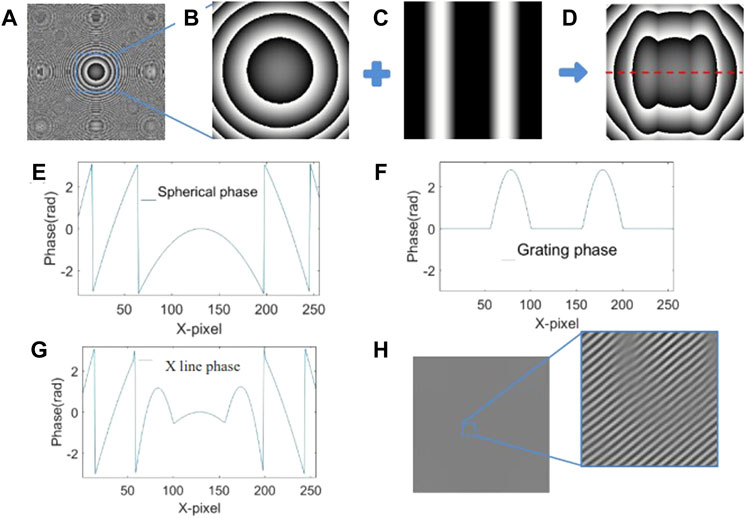
FIGURE 2. Simulation of object wave and digital hologram. (A) Quadratic phase aberration simulated as the effect due to the microscope objective (wrapped), (B) Spherical phase map in center 256 × 256 region, (C) Object phase (sine grating function of two periods) located at the center of 256 × 256 region, (D) Wrapped phase map of quadratic phase combined with object. (E) Line trace of the quadratic phase extracted from the red line in (B). (F) Line trace of the sine grating object from (C), (G) Line trace of the combined phase extracted from the red line of (D). (H) Simulated off axis digital hologram map with 50 mm recording distance.
As shown in Figures 3A–C, in the holographic reconstruction process, the simulated phase of the object wave modulates the intensity image, but quadratic phase aberration added to the object only affects the boundary region of the phase retrieval. Figure 3A is the intensity image with 50 mm reconstruction distance equal to the recording distance. Figures 3B,C are the intensity image with 49 and 51 mm reconstruction distance, respectively. We solve the TIE to calculate the object phase with three intensity images. Figures 3D,E show the phase retrieval by DH-TIE with
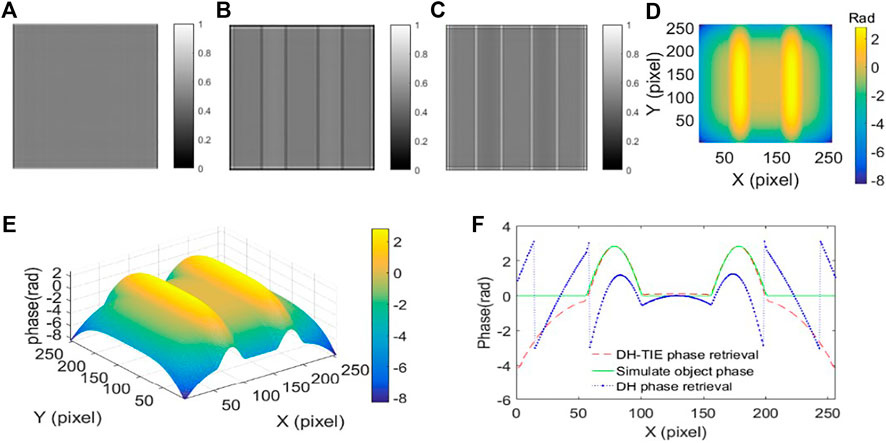
FIGURE 3. Holographic reconstruction intensity images and TIE phase retrieval results. (A) Reconstruction intensity image (256 × 256 size of the center of the region) with 50 mm reconstruction distance. (B) Reconstruction intensity image with 49 mm reconstruction distance. (C) Reconstruction intensity image with 51 mm reconstruction distance. (D) Phase retrieval by DH-TIE with 1 mm Δz (vertical view). (E) 3D profile view of (D). (F) Line traces of simulated object (Green), DH (Blue) and DH-TIE (Red) retrieval phase.
As it turns out, the DH-TIE phase retrieval is improved drastically by zero padding. We summarize the results in Figure 4. In Figure 4A, we have used a 256 × 256 image. In Figures 4B–D, we perform zero padding on the image file in Figure 4A to have 512 × 512, 768 × 768, 1,024 × 1,024 image files, respectively. It is evident that phase retrieval of using 512 × 512, 768 × 768, 1,024 × 1,024 image files are better than that from the 256 × 256 image file, and the reconstruction effect of 512 × 512 image file is the best among them. It is also clear that quadratic phase aberration added to the object does not impact phase retrieval using the DH-TIE method. Simulation results show that the DH-TIE method can effectively eliminate quadratic phase aberration in DHM, greatly simplifying the phase reconstruction process of real objects. Zero padding provides a larger uniform background on the original image file and can achieve better retrieval results.
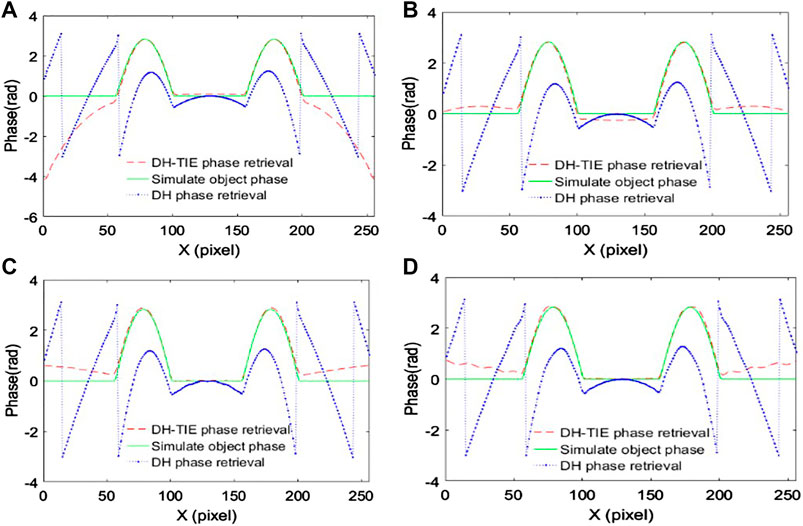
FIGURE 4. Reconstruction under zero padding of different sizes and the line traces of simulated object (Green), DH (Blue) and DH-TIE (Red) phase retrieval. Reconstruction intensity images are with Δz = 1 mm. (A) The image file is 256 × 256. (B) The image file is 512 × 512. (C) The image file is 768 × 768. (D) The image file is 1,024 × 1,024.
We also study the reconstruction effectiveness due to the regularization parameter under different severities of quadratic phase aberration. A two-dimensional correlation coefficient
where
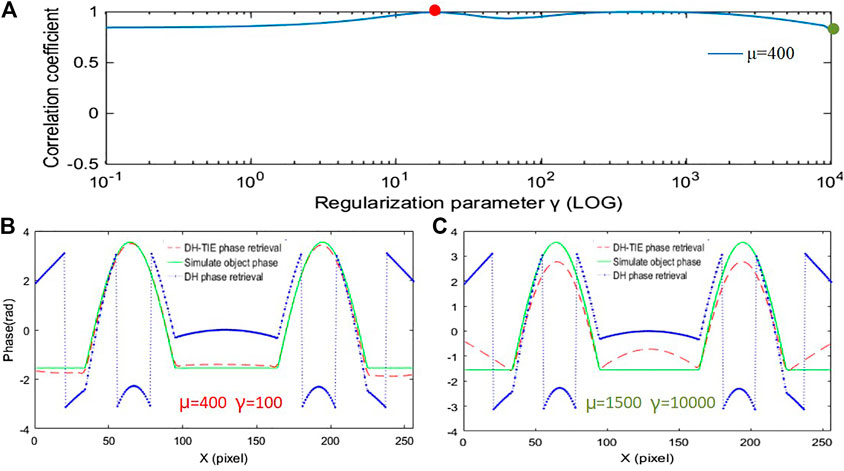
FIGURE 5. (A) Correlation coefficient plots corresponding to different regularization parameters when the quadratic phase aberration factor μ = 400. (B) Reconstruction results, line traces when the value of the regularization parameter γ is taken as 100. (C) Reconstruction results, line traces when the value of the regularization parameter γ is taken as 10,000.
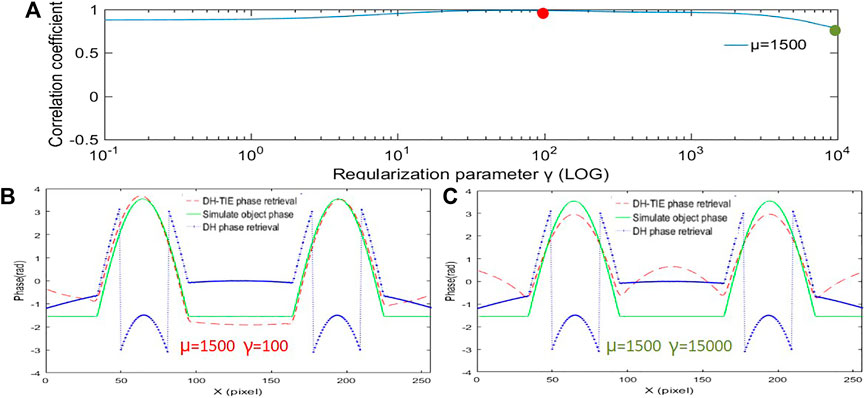
FIGURE 6. (A) Correlation coefficient plots corresponding to different regularization parameters when the quadratic phase aberration factor μ = 1,500. (B) Reconstruction results, line traces when the value of the regularization parameter γ is taken as 100. (C) Reconstruction results, line traces when the value of the regularization parameter γ is taken as 15,000.
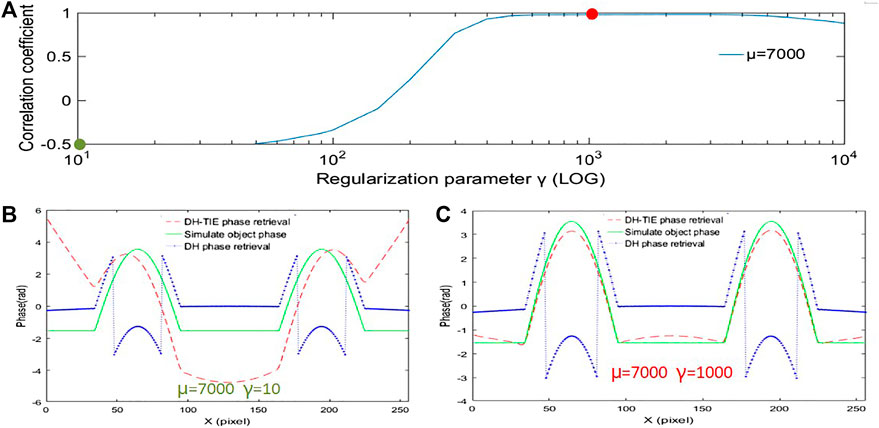
FIGURE 7. (A) Correlation coefficient plots corresponding to different regularization parameters when the quadratic phase aberration factor μ = 7,000. (B) Reconstruction results, line traces when the value of the regularization parameter is taken as 10. (C) Reconstruction results when taking the red point in (A), line trace when the value of the regularization parameter is taken as 1,000.
4 Experiment and Results
To verify the effectiveness of the proposed method, a DHM system of off-axis Mach-Zehnder interferometer combined with an inverted microscopy (Olympus CKX53) has been constructed. The wavelength of He-Ne laser source (Da Heng DH-NH250) is 632.8 nm
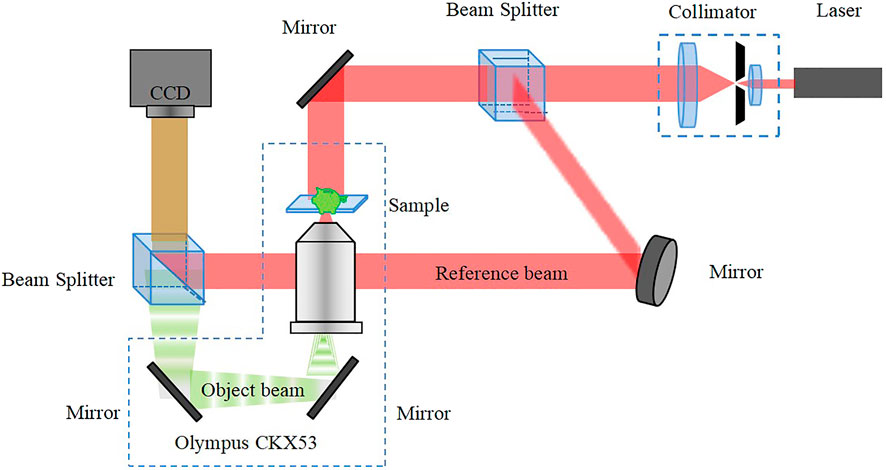
FIGURE 8. Diagram of off-axis digital holographic microscopy system setup.
A collimated laser beam is divided into two beams after passing through a laser collimator and a beam-splitting prism. One of the beams is reflected by a reflector mirror and modulated by the sample phase to become the object beam, where the object wavefront (green) is magnified by an Olympus microscope and diffracted onto the CCD plane. The other beam is used as the reference light. An off-axis angle between the two beams is created to form an interference between the object and reference light waves on the CCD plane.
The actual off-axis digital holographic system is shown in Figure 9. The light beam emitted by the laser passes through a collimator and then passes through a beamsplitter (BS) which is divided into an object beam and a reference beam. The object beam passes through another beamsplitter and passes down through the object and the microscope, while the reference beam passes through the two beamsplitters and is incident onto the CCD together with the object beam (green arrow) to form an interference beam. In the system, the laser enters the Olympus microscope through a mirror, and by this way, the laser replaces the original light source of the microscope with vertical incidence, and the inverted microscope has been used to form a post-amplification digital holographic microscope. The merit of using an inverted microscope is that the microscope objective lens can be flexibly switched to change the magnification of the system.
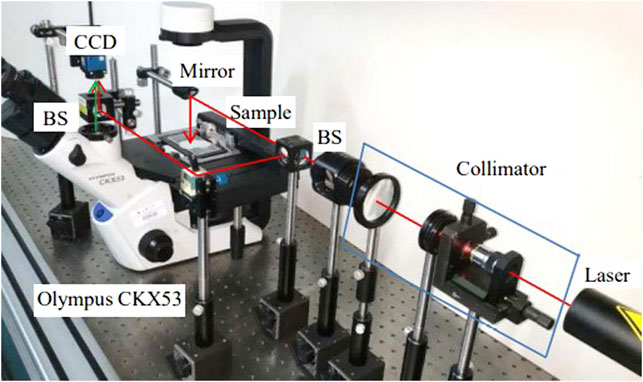
FIGURE 9. Experimental setup diagram of off-axis digital holographic microscopy system.
We have obtained the holograms of a USAF 1951 resolution chart (Edmund Optics) using the holographic microscope. The digital holograms that we have captured under ×4 and ×10 microscope objectives are shown in Figures 10A,B, respectively. Figures 10C,D are the spectra of these two holograms, respectively, and Figures 10E,F are the focused intensity reconstructed images of Figures 10A,B, respectively.
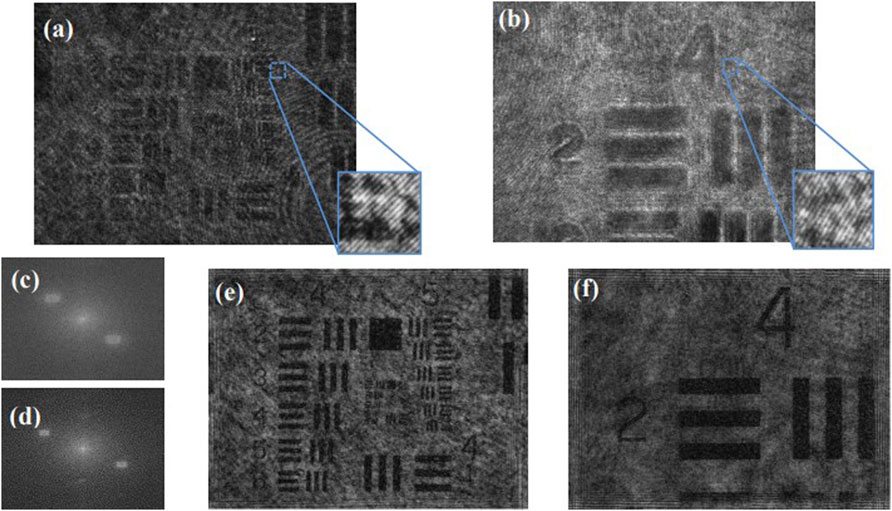
FIGURE 10. Recorded holograms, two-dimensional spectra and reconstructed intensity images. (A) Hologram under X4 MO with 20 mm recording distance, (B) Hologram under ×10 MO with 30 mm recording distance, (C,D) are the two-dimensional spectra of holograms (A,B), respectively, (E) Focused intensity reconstructed image of (A), (F) Focused intensity reconstructed image of (B).
In the DH-TIE phase retrieval process, we have used a focused image and two defocused images with 1 mm away from the focused image. We have reconstructed two holograms (Figures 10A,B) by the DH and DH-TIE methods. Figures 11A,B are the DH retrieved phase, and Figures 11C,D are the DH-TIE retrieved phase. In the DH-TIE phase reconstruction, the regulation parameter has been set to 5,000.
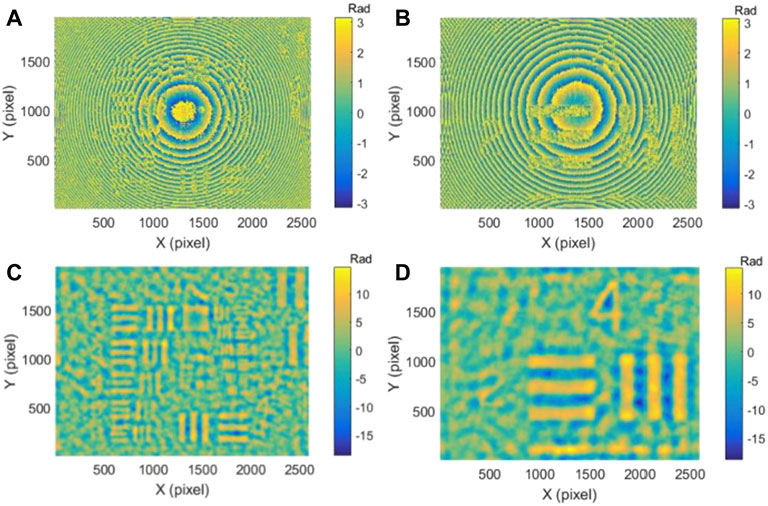
FIGURE 11. Phase retrievals of DH and DH-TIE. (A,B) are the DH phase map retrievals from Figures 10A,B, respectively. (C,D) are the DH-TIE phase map retrievals from Figures 10A,B.
It can be seen in Figures 11A,B that quadratic phase aberration is sharp in the DH reconstruction. Quadratic phase aberration introduced by the microscope objective is so strong that the phase information of the objects have been completely buried. Under the ×4 and ×10 microscope objective, quadratic phase aberration has different curvatures. The quadratic phase factor in Figure 11A is μ = 200, and the quadratic phase factor in Figure 11B is μ = 400. This problem does not exist in the phase retrieval process using DH-TIE as quadratic phase aberration has been eliminated and the object phase has been retrieved successfully as shown in Figures 11C,D. In order to verify the effect of different regularization parameters on the reconstruction phase, we compare reconstructions when γ = 1,000 and γ = 10,000 under the ×10 microscope objective. It can be seen from Figure 12 that reconstruction is worse when γ = 10,000 as compared to that when γ = 1,000. Clearly, regularization parameter plays an important role in reconstruction.
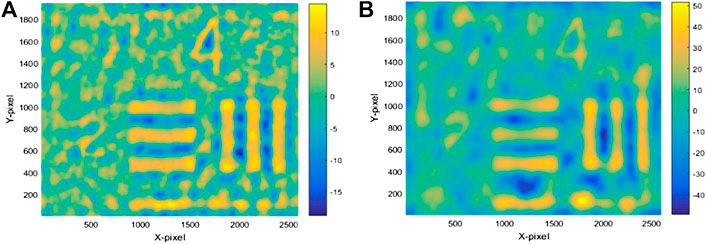
FIGURE 12. Phase retrievals of DH-TIE under ×10 MO. (A) Phase map retrieval when γ = 1,000 (B) Phase map retrieval when γ = 10,000.
5 Concluding Remarks
Off-axis DHM simulation results show that, for quadratic phase aberration generated by a microscope objective, the DH-TIE method along with regularization can effectively eliminate quadratic phase aberration. The unique advantage of DH-TIE is that phase unwrapping is not needed. In contrast, conventional DH phase retrieval method is not able to remove quadratic phase aberration since there is no such process (regularization within TIE) for the removal of the quadratic phase. We have performed simulations that provide guidance for the proper selection of the regularization process under the TIE.
Through optical experimental results, along with regularization the DH-TIE method shows consistency in phase retrieval under quadratic phase aberration introduced by the microscope objective in the DH system. It should be noted that the uniformity of the beam brightness in the holographic plane should affect the accuracy of the DH-TIE reconstruction, because only when the light intensity is uniformly distributed on the hologram plane, the TIE equation can then be directly reduced to a Poisson equation, which can be solved directly by using Fourier transforms. This aspect should be further studied.
Data Availability Statement
The original contributions presented in the study are included in the article/supplementary material, further inquiries can be directed to the corresponding author.
Author Contributions
WZ, HZ, and T-CP contributed to conception and design of the study. CW organized the database. YY performed the statistical analysis. SL wrote the first draft of the manuscript. All authors contributed to manuscript revision, read, and approved the submitted version.
Funding
This project was supported by the National Natural Science Foundation of China (No.51775326 and No.61975112); the Major State Research Development Program of China (2020YFE024600); Shanghai Key Laboratory of Intelligent Manufacturing and Robotics.
Conflict of Interest
The authors declare that the research was conducted in the absence of any commercial or financial relationships that could be construed as a potential conflict of interest.
Publisher’s Note
All claims expressed in this article are solely those of the authors and do not necessarily represent those of their affiliated organizations, or those of the publisher, the editors and the reviewers. Any product that may be evaluated in this article, or claim that may be made by its manufacturer, is not guaranteed or endorsed by the publisher.
References
Banerjee, P. P. (2022). University of Dayton.[Private Communications]. Dayton, Ohio: University of Dayton.
Colomb, T., Kühn, J., Charrière, F., Depeursinge, C., Marquet, P., and Aspert, N. (2006). Total Aberrations Compensation in Digital Holographic Microscopy with a Reference Conjugated Hologram. Opt. Express 14, 4300. doi:10.1364/oe.14.004300
Cuche, E., Marquet, P., and Depeursinge, C. (1999). Simultaneous Amplitude-Contrast and Quantitative Phase-Contrast Microscopy by Numerical Reconstruction of Fresnel off-axis Holograms. Appl. Opt. 38, 6994–7001. doi:10.1364/ao.38.006994
Deng, D., Peng, J., Qu, W., Wu, Y., Liu, X., He, W., et al. (2017). Simple and Flexible Phase Compensation for Digital Holographic Microscopy with Electrically Tunable Lens. Appl. Opt. 56, 6007. doi:10.1364/AO.56.006007
Di, J., Zhao, J., Sun, W., Jiang, H., and Yan, X. (2009). Phase Aberration Compensation of Digital Holographic Microscopy Based on Least Squares Surface Fitting. Opt. Commun. 282, 3873–3877. doi:10.1016/j.optcom.2009.06.049
Gupta, A. K., Nishchal, N. K., and Banerjee, P. P. (2020). Transport of Intensity Equation Based Photon-Counting Phase Imaging. OSA Continuum. 3, 236–245. doi:10.1364/OSAC.383527
Gupta, A. K., and Nishchal, N. K. (2021). Low-light Phase Imaging Using In-Line Digital Holography and the Transport of Intensity Equation. J. Opt. 23, 025701. doi:10.1088/2040-8986/abe18a
Kelly, D. P., Megel, L., Meinecke, T., and Sinzinger, S. (2013). A Theoretical Comparison of Fresnel Based Digital Holography and Phase Retrieval from the Transport of Intensity Equation. Proc. SPIE. 8833, 88330G. doi:10.1117/12.2024855
Leith, E. N., and Upatnieks, J. (1964). Wavefront Reconstruction with Diffused Illumination and Three-Dimensional Objects*. J. Opt. Soc. Am. 54, 1295–1301. doi:10.1364/JOSA.54.001295
Liu, S., Xiao, W., and Pan, F. (2014). Automatic Compensation of Phase Aberrations in Digital Holographic Microscopy for Living Cells Investigation by Using Spectral Energy Analysis. Opt. Laser Technology. 57, 169–174. doi:10.1016/j.optlastec.2013.10.014
Liu, Y., Wang, Z., and Huang, J. (2018). Recent Progress on Aberration Compensation and Coherent Noise Suppression in Digital Holography. Appl. Sci. 8, 444. doi:10.3390/app8030444
Lu, L., Fan, Y., Sun, J., Zhang, J., Wu, X., Chen, Q., et al. (2021). Accurate Quantitative Phase Imaging by the Transport of Intensity Equation: a Mixed-Transfer-Function Approach. Opt. Lett. 46, 1740–1743. doi:10.1364/OL.422095
Mann, C. J., Yu, L., Lo, C.-M., and Kim, M. K. (2005). High-resolution Quantitative Phase-Contrast Microscopy by Digital Holography. Opt. Express. 13, 8693–8698. doi:10.1364/opex.13.008693
Nguyen, T., Bui, V., Lam, V., Raub, C. B., Chang, L.-C., and Nehmetallah, G. (2017). Automatic Phase Aberration Compensation for Digital Holographic Microscopy Based on Deep Learning Background Detection. Opt. Express. 25, 15043–15057. doi:10.1364/OE.25.015043
Poon, T.-C., and Liu, J.-P. (2014). Introduction to Modern Digital Holography with MATLAB. Cambridge, UK: Cambridge University Press.
Rappaz, B., Marquet, P., Cuche, E., Emery, Y., Depeursinge, C., and Magistretti, P. J. (2005). Measurement of the Integral Refractive index and Dynamic Cell Morphometry of Living Cells with Digital Holographic Microscopy. Opt. Express. 13, 9361–9373. doi:10.1364/opex.13.009361
Sánchez-Ortiga, E., Ferraro, P., Martínez-Corral, M., Saavedra, G., and Doblas, A. (2011). Digital Holographic Microscopy with Pure-Optical Spherical Phase Compensation. J. Opt. Soc. Am. A. 28, 1410–1417. doi:10.1364/JOSAA.28.001410
Schnars, U., and Jüptner, W. (1994). Direct Recording of Holograms by a CCD Target and Numerical Reconstruction. Appl. Opt. 33, 179–181. doi:10.1364/AO.33.000179
Teague, M. R. (1983). Deterministic Phase Retrieval: a Green's Function Solution. J. Opt. Soc. Am. 73, 1434–1441. doi:10.1364/JOSA.73.001434
Wang, H., Dong, Z., Wang, X., Lou, Y., and Xi, S. (2019). Phase Compensation in Digital Holographic Microscopy Using a Quantitative Evaluation Metric. Opt. Commun. 430, 262–267. doi:10.1016/j.optcom.2018.08.061
Wittkopp, J. M., Khoo, T. C., Carney, S., Pisila, K., Bahreini, S. J., Tubbesing, K., et al. (2020). Comparative Phase Imaging of Live Cells by Digital Holographic Microscopy and Transport of Intensity Equation Methods. Opt. Express 28, 6123–6133. doi:10.1364/OE.385854
Yan, K., Yu, Y., Huang, C., Sui, L., Qian, K., and Asundi, A. (2019). Fringe Pattern Denoising Based on Deep Learning. Opt. Commun. 437, 148–152. doi:10.1016/j.optcom.2018.12.058
Zhou, W.-J., Guan, X., Liu, F., Yu, Y., Zhang, H., Poon, T.-C., et al. (2018). Phase Retrieval Based on Transport of Intensity and Digital Holography. Appl. Opt. 57, A229. doi:10.1364/AO.57.00A229
Zhou, W., Yu, Y., and Asundi, A. (2009). Study on Aberration Suppressing Methods in Digital Micro-holography. Opt. Lasers Eng. 47, 264–270. doi:10.1016/j.optlaseng.2008.04.026
Zuo, C., Chen, Q., Li, H., Qu, W., and Asundi, A. (2014). Boundary-artifact-free Phase Retrieval with the Transport of Intensity Equation II: Applications to Microlens Characterization. Opt. Express 22, 18310–18324. doi:10.1364/OE.22.018310
Zuo, C., Chen, Q., Qu, W., and Asundi, A. (2013a). Direct Continuous Phase Demodulation in Digital Holography with Use of the Transport-Of-Intensity Equation. Opt. Commun. 309, 221–226. doi:10.1016/j.optcom.2013.07.013
Zuo, C., Chen, Q., Qu, W., and Asundi, A. (2013b). Phase Aberration Compensation in Digital Holographic Microscopy Based on Principal Component Analysis. Opt. Lett. 38, 1724–1726. doi:10.1364/OL.38.001724
Keywords: phase retrieval, aberration elimination, digital holography, transport of intensity, phase unwrapping
Citation: Zhou W, Liu S, Wang C, Zhang H, Yu Y and Poon T-C (2022) Elimination of Quadratic Phase Aberration in Digital Holographic Microscopy by Using Transport of Intensity. Front. Photonics 3:848453. doi: 10.3389/fphot.2022.848453
Received: 04 January 2022; Accepted: 28 January 2022;
Published: 18 February 2022.
Edited by:
Yaping Zhang, Kunming University of Science and Technology, ChinaReviewed by:
Chao Zuo, Nanjing University of Science and Technology, ChinaNaveen Nishchal, Indian Institute of Technology Patna, India
Copyright © 2022 Zhou, Liu, Wang, Zhang, Yu and Poon. This is an open-access article distributed under the terms of the Creative Commons Attribution License (CC BY). The use, distribution or reproduction in other forums is permitted, provided the original author(s) and the copyright owner(s) are credited and that the original publication in this journal is cited, in accordance with accepted academic practice. No use, distribution or reproduction is permitted which does not comply with these terms.
*Correspondence: Wenjing Zhou, bGF6eWJlZUBzaHUuZWR1LmNu